A method for random uncertainties validation and probing the natural variability with application to TROPOMI on board Sentinel-5P total ozone ...
←
→
Page content transcription
If your browser does not render page correctly, please read the page content below
Atmos. Meas. Tech., 14, 2993–3002, 2021
https://doi.org/10.5194/amt-14-2993-2021
© Author(s) 2021. This work is distributed under
the Creative Commons Attribution 4.0 License.

A method for random uncertainties validation and probing the
natural variability with application to TROPOMI on board
Sentinel-5P total ozone measurements
Viktoria F. Sofieva1 , Hei Shing Lee1,2 , Johanna Tamminen1 , Christophe Lerot3 , Fabian Romahn4 , and
Diego G. Loyola4
1 Space and Earth Observation Centre, Finnish Meteorological Institute, Helsinki, Finland
2 Atmospheric   Sciences Department, University of Helsinki, Helsinki, Finland
3 Belgian Institute for Space Aeronomy (BIRA-IASB), Brussels, Belgium
4 German Aerospace Centre (DLR), Remote Sensing Technology Institute, Oberpfaffenhofen, Germany

Correspondence: Viktoria F. Sofieva (viktoria.sofieva@fmi.fi)

Received: 5 October 2020 – Discussion started: 28 October 2020
Revised: 4 February 2021 – Accepted: 9 March 2021 – Published: 22 April 2021

Abstract. In this paper, we discuss the method for validation      1   Introduction
of random uncertainties in the remote sensing measurements
based on evaluation of the structure function, i.e., root-mean-    The information about uncertainties of measurements is im-
square differences as a function of increasing spatiotemporal      portant in many data analyses: data averaging, comparison,
separation of the measurements. The limit at the zero mis-         data assimilation etc. The uncertainties are usually catego-
match provides the experimental estimate of random noise in        rized into “random” and “systematic” (for more discussion,
the data. At the same time, this method allows probing of the      see von Clarmann et al., 2020).
natural variability of the measured parameter. As an illus-           For remote sensing measurements, the random compo-
tration, we applied this method to the clear-sky total ozone       nent of uncertainty budget is estimated via propagation of
measurements by the TROPOspheric Monitoring Instrument             measurement noise through the inversion algorithm (e.g.,
(TROPOMI) on board the Sentinel-5P satellite.                      Rodgers, 2000). If the linear or linearized model is adequate,
   We found that the random uncertainties reported by the          the Gaussian error propagation can be used for simplicity. In
TROPOMI inversion algorithm, which are in the range 1–             von Clarmann et al. (2020) the term “ex ante” is used for the
2 DU, agree well with the experimental uncertainty estimates       uncertainty estimates by an inversion algorithm, as do we in
by the structure function.                                         our paper.
   Our analysis of the structure function has shown the ex-           Ex ante uncertainty estimates might be incomplete: this
pected results on total ozone variability: it is significantly     might be due to incomplete or simplified models of the pro-
smaller in the tropics compared to mid-latitudes. At mid-          cesses that describe the satellite measurements and/or un-
latitudes, ozone variability is much larger in winter than in      known and unresolved atmospheric features. Another con-
summer. The ozone structure function is anisotropic (being         tributing factor might be the imperfect estimates of measure-
larger in the latitudinal direction) at horizontal scales larger   ment uncertainties, as well as the uncertainties of external
than 10–20 km. The structure function rapidly grows with the       auxiliary data. Therefore, validation of theoretical (ex ante)
separation distance. At mid-latitudes in winter, the ozone val-    uncertainty estimates is needed for remote-sensing measure-
ues can differ by 5 % at separations 300–500 km.                   ments. For atmospheric measurements specifically, valida-
   The method discussed is a powerful tool in experimental         tion of random uncertainty estimates is not a trivial task
estimates of the random noise in data and studies of natural       because the measurements are performed in a continuously
variability, and it can be used in various applications.           changing atmosphere.

Published by Copernicus Publications on behalf of the European Geosciences Union.
2994                                                         V. F. Sofieva et al.: A method for random uncertainties validation

   This short paper is dedicated to a simple method, which
allows simultaneous probing of small-scale variability on an
atmospheric parameter and validation of random uncertain-
ties in the measurements of this parameter.
   The paper is organized as follows. Section 2 briefly
describes the methodology of the analysis. In Sect. 3,
we describe the TROPOspheric Monitoring Instrument
(TROPOMI) total ozone data, which are used in our paper.
In Sect. 4, we briefly explain the technical details of the com-
putation of the structure function using TROPOMI data. The
results and discussion are presented in Sect. 5. The summary
(Sect. 6) concludes the paper.
                                                                     Figure 1. The schematic representation of the structure function
                                                                     estimated from noisy measurements.
2   Methodology

In our work, we will exploit the concept of the structure func-
tion, which characterizes the degree of spatial dependence of
                                                                     considered as an experimental random uncertainty estimate,
a random field f (r) (or a stochastic process, e.g., Tatarskii,
                                                                     ex post in the terminology of von Clarmann et al. (2020).
1961):
                                                                     The application of the structure function method requires
                1 D                   2 E                          many measurement points with different spatial and tempo-
D(r 1 , r 2 ) =     f (r 1 ) − f (r 2 ) ,                   (1)      ral separations, including very small separations, and these
                2
                                                                     measurements should have nearly the same random uncer-
where r 1 and r 2 are two locations (in space and in time).          tainties. For satellite measurements in limb-viewing geom-
In geostatistics, D is called the variogram (e.g., Cressie,          etry, such information is very limited. Nevertheless, several
1993; Matheron, 1963; Wackernagel, 2003). For random pro-            applications using this method have been published. Staten
cesses with stationary increments – i.e., under the assump-          and Reichler (2009) applied this method to the validation
tion that the variance of the increments is a finite value           of radio-occultation measurements by the Constellation Ob-
depending only on the length and orientation of a vector             serving System for Meteorology, Ionosphere, and Climate
ρ = r 1 − r 2 , but notD on the position ofE ρ – the structure     (COSMIC), which consists of identical instruments on board
                     1                      2
function D(ρ) = 2 f (r + ρ) − f (r) is one of the main               of six microsatellites. In their work, the authors evaluated
characteristics (e.g., Kolmogorov, 1940; Yaglom, 1987). The          two-dimensional structure function using the data from the
concept of structure function is widely used in the theory           beginning of COSMIC mission, when the satellites were in
of small-scale atmospheric processes including turbulence            close orbits (and therefore measurements in close separations
(e.g., Gurvich and Brekhovskikh, 2001; Monin and Yaglom,             were found). An analogous method – evaluation of the one-
1975; Tatarskii, 1971; Yaglom, 1987). Evidently, D(0) = 0.           dimensional structure function in polar regions (with trans-
For geophysical processes, smooth functions are usually used         formation of temporal mismatch to spatial separation) – has
for characterization and parameterization of D(ρ). For exam-         been applied for validation of random uncertainty estimates
ple, a power function is usually used for D(ρ) in the theory         of the MIPAS (Michelson Interferometer for Passive Atmo-
of atmospheric turbulence (recall the famous Kolmorogov’s            spheric Sounding) and GOMOS (Global Ozone Monitoring
relation for the locally isotropic turbulence D(ρ) = Cρ 2/3 , ρ      by Occultation of Stars) instruments on board the Envisat
being the separation distance; Frisch, 1995). For white noise        satellite (Laeng et al., 2015; Sofieva et al., 2014). The one-
                   2
with variance σnoise    , the structure function is the step func-   dimensional structure function has been evaluated in Sofieva
                 2
tion D(ρ) = σnoise with discontinuity at zero.                       et al. (2008) using collocated temperature profiles by ra-
   When using experimental (noisy) data for evaluation of            diosondes at Sodankylä.
variogram and structure function, the difference of an atmo-            For satellite measurements in nadir-viewing geometry, the
spheric parameter in two locations is defined not only by the        smallest separation is usually defined by the ground pixel
natural variability of this atmospheric parameter, but also by       size of an instrument, and the application of the structure
uncertainty of measurements. Therefore, with the spatiotem-          function method looks very attractive: measurements with
poral separation ρ → 0, D(ρ) tends to the random uncer-              small spatiotemporal mismatch can be found in all locations
                     2
tainty variance σnoise     (the offset at zero is called “nugget”    and in all seasons. However, we are not aware of the ap-
in geostatistics), as illustrated in Fig. 1.                         plication of the structure function method for validation of
   This constitutes the principle of the proposed method: at         random uncertainty estimates from nadir-viewing satellite in-
very small separations, the estimation of the structure func-        struments. In our paper, we use total ozone measurements by
tion will tend towards random error variance. This can be            TROPOMI on board Sentinel-5P, which has a very fine spa-

Atmos. Meas. Tech., 14, 2993–3002, 2021                                               https://doi.org/10.5194/amt-14-2993-2021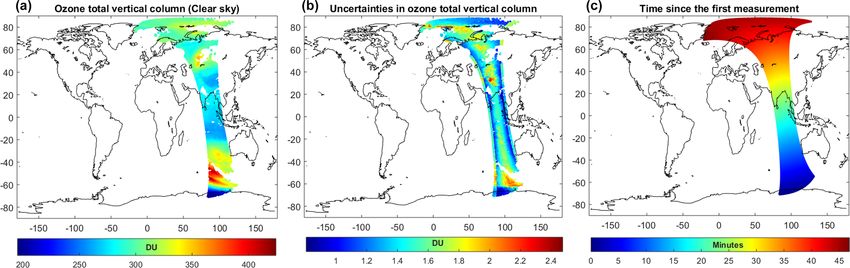
V. F. Sofieva et al.: A method for random uncertainties validation                                                          2995

tial resolution, for the illustration of the structure function   cloud product (Loyola et al., 2018) to select ozone data with
method.                                                           cloud fraction smaller than 0.2.
                                                                     Figure 2 shows typical TROPOMI clear-sky total ozone
                                                                  column observations in one orbit. Typical values of random
                                                                  uncertainties (Fig. 2, center) range from 0.5 to 2 DU. As
3   Case study: total ozone data by TROPOMI                       shown in Fig. 2 (right), the measurement points in a certain
                                                                  latitude band are performed nearly at the same time, for one
The TROPOMI satellite instrument on board the Coper-              orbit.
nicus Sentinel-5 Precursor (S5P) satellite was launched
in October 2017 (http://www.tropomi.eu, last access:
15 April 2021; https://sentinel.esa.int/web/sentinel/missions/    4   Evaluation of ozone structure functions using
sentinel-5p, last access: 15 April 2021; Veefkind et al.,             TROPOMI data
2012). The mission of S5P is to perform atmospheric mea-
surements with high spatiotemporal resolution for monitor-        In our analyses, we selected the TROPOMI Level 2 clear-sky
ing air quality and forecasting climate. TROPOMI imple-           total ozone data in several broad latitude bands (60–90◦ S,
ments passive remote sensing techniques by measuring the          30–60◦ S, 20◦ S–20◦ N, 30–60◦ N, 60–90◦ N) and in certain
solar radiation reflected, scattered and radiated by the Earth–   months: July 2018, October 2018, January 2019 and March
atmosphere system at ultraviolet, visible, near-infrared and      2019. Since the ozone natural variability is expected to de-
shortwave infrared wavelengths in the nadir-looking geom-         pend on latitude and season, we computed the structure func-
etry. With a large spectral range covered, TROPOMI data           tion for each latitude band and for each month separately.
allow vertical columns for a wide number of atmospheric           The sun-synchronous satellite measurements do not allow
gases to be measured, including ozone (O3 ), nitrogen diox-       probing of all temporal separations (the measurements are
ide (NO2 ), sulfur dioxide (SO2 ), carbon monoxide (CO),          performed in close local time); therefore in our analysis only
methane (CH4 ) and formaldehyde (HCHO), with an ex-               spatial separations are studied. In order to exclude the tem-
tremely good spatial resolution (3.5 × 5.5 km2 since August       poral dependence, we evaluated the structure functions for
2019). This allows the structure function method to be ap-        each orbit separately and then averaged over a month. In our
plied, since the ground pixel separations can be probed at        work, we evaluate two-dimensional structure function, i.e.,
very small scales.                                                the variance of ozone differences as a separation in latitude
   The data are available in near-real-time, offline and repro-   and in longitude.
cessing streams. In our studies, the Level 2 offline data prod-      The computation of structure function requires finding the
uct of the total ozone column (TOC) is used. This product re-     differences in ozone and the corresponding spatial separation
lies on the operational implementation of the GODFITv4 al-        (i.e., distance in latitude and longitude) between every pair of
gorithm, used for producing total ozone climate data records      data pixels. Theoretically it could be achieved by considering
from many nadir-viewing sensors (GOME (Global Ozone               one point and comparing it with the rest of observations, then
Monitoring Experiment), SCIAMACHY (SCanning Imaging               moving to another point and again comparing it with all other
Spectrometer for Atmospheric CHartographY), GOME-2,               observations. However, owing to the very high spatial resolu-
OMI (Ozone Monitoring Instrument), OMPS (Ozone Map-               tion of TROPOMI and thus an extremely large amount of ob-
ping and Profiler Suite)) with excellent performance (Garane      servation points even for one orbit, such an operation is very
et al., 2019; Lerot et al., 2014). Total ozone columns are de-    demanding computationally. To ensure numerical efficiency,
rived using a non-linear minimization procedure of the dif-       the algorithm is simplified while preserving the underlying
ferences between measured and modeled sun-normalized ra-          principle: instead of using all observations we consider a suf-
diances in the ozone Huggins bands (fitting window: 325–          ficiently large amount of observations. For each orbit and for
335 nm).                                                          each latitude band, we create a set of ∼ 100 reference points
   The total ozone product includes an estimate for the ran-      evenly spatially spaced in a selected latitude zone. For each
dom uncertainty associated with each observation. The latter      reference point, we computed differences from all points in
is simply obtained by the propagation through the inversion       the latitude zone in both longitudinal and latitudinal direc-
solver of the radiance and irradiance statistical errors pro-     tions. This operation allows many pairs of data correspond-
vided with the measurements (in Level 1 products). In ad-         ing to all separation distances to be collected (2–2.5 million).
dition to the instrumental noise, some pseudo-random errors          After computing the average of the squared difference in
(i.e., systematic errors varying rapidly at short spatiotempo-    ozone and spatial separation for each orbit, the monthly-
ral scales, “model errors” in the terminology of von Clar-        averaged structure functions are created. The monthly av-
mann et al., 2020) may be present in the data due to imperfect    erage is based on 400–450 structure functions from indi-
corrections for the presence of clouds in the probed scene.       vidual orbits, so in total 800–1000 million data pairs are
In order to limit this term, our main analysis will focus on      used for evaluation of monthly averaged structure functions.
the clear-sky conditions. We use the operational TROPOMI          The smallest bin for evaluation of the structure function

https://doi.org/10.5194/amt-14-2993-2021                                            Atmos. Meas. Tech., 14, 2993–3002, 2021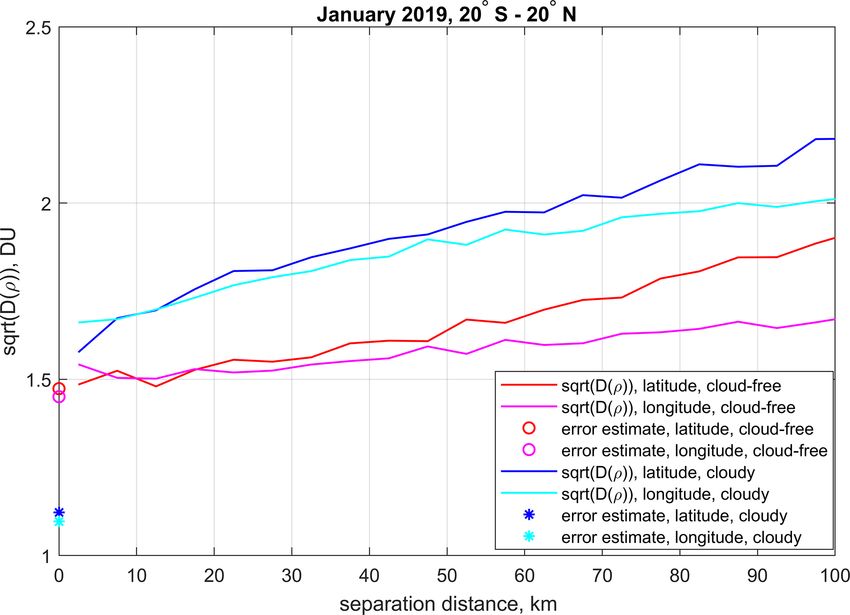
2996 V. F. Sofieva et al.: A method for random uncertainties validation
Figure 2. (a) TROPOMI clear-sky ozone measurements in one orbit (1 September 2018, 06:37 UTC). (b) Uncertainties. (c) Time since the
first measurement in this orbit.
Figure 3. Illustration
√ of structure function in July 2018 and other associated parameters, for latitude 30–60◦ N. (a) The structure function
expressed as D(ρ) (DU). (b) Mean uncertainty (DU) corresponding to the separations (pairs of points). (c) Mean ozone column (DU)
corresponding to the separations.
is 5 km × 5 km, and the corresponding sub-sample contains expressed in DU. An analogous figure showing the structure
over 14 000 pairs. function in relative units (%) is presented in Fig. A1 in the
Figure 3a shows the example of the structure function Appendix. As mentioned above, the structure functions in
evaluated for July 2018 in the latitude band 30–60◦ N. As absolute and in relative units look very similar.
expected, the root mean square (rms) of the ozone differ- The obtained morphology of ozone variability is quite ex-
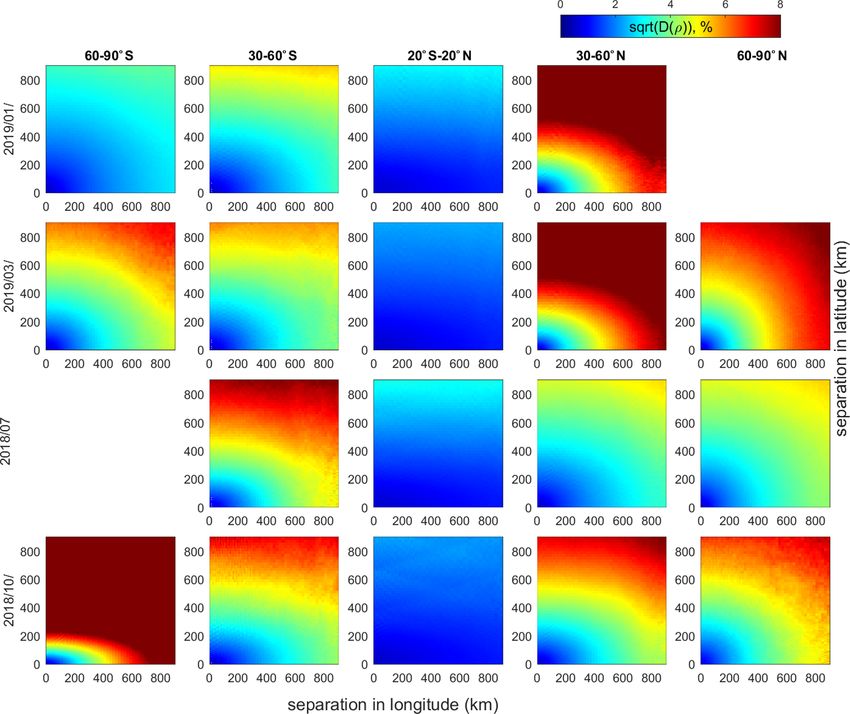
ences grows with increasing separation distance. The struc- pected: it is overall much smaller in the tropics than at middle
ture function is anisotropic: it is larger in the latitudinal di- and high latitudes, where it has a pronounced seasonal cycle.
rection. In the selected latitude band (this is also the case At mid-latitudes in winter and spring, the ozone variability is
for other months and latitude bands), the mean error estimate very strong, even for small separations. Except at high north-
corresponding to different separation distances is nearly con- ern latitudes in winter and spring, the structure functions are
stant (∼ 1.5 DU, Fig. 3b). Analogously, the mean ozone value anisotropic with a stronger variability in the latitudinal direc-
in the pairs corresponding to different separation distances is tion.
also nearly constant (Fig. 3c), as expected. This implies that Figure 5 shows the structure functions for selected latitude
the structure function looks similar in both absolute (DU) and zones (the same as presented in Fig. 4), but with the focus on
relative (%) representations (see also below). small separations, for January 2019 and July 2018. In Fig. 5,
the colored circles near the origin indicate the mean (for the
corresponding latitude zone and month) ex ante uncertainty
5 Results and discussion estimates in the pairs with small separation distances. We ob-
serve that in the regions of small (20◦ S–20◦ N) or moder-
The structure functions evaluated in different latitude√bands ate variability (30–60◦ S and 30–60◦ N in local summer), the
and seasons are shown in Fig. 4. Color represents D(ρ)
Atmos. Meas. Tech., 14, 2993–3002, 2021 https://doi.org/10.5194/amt-14-2993-2021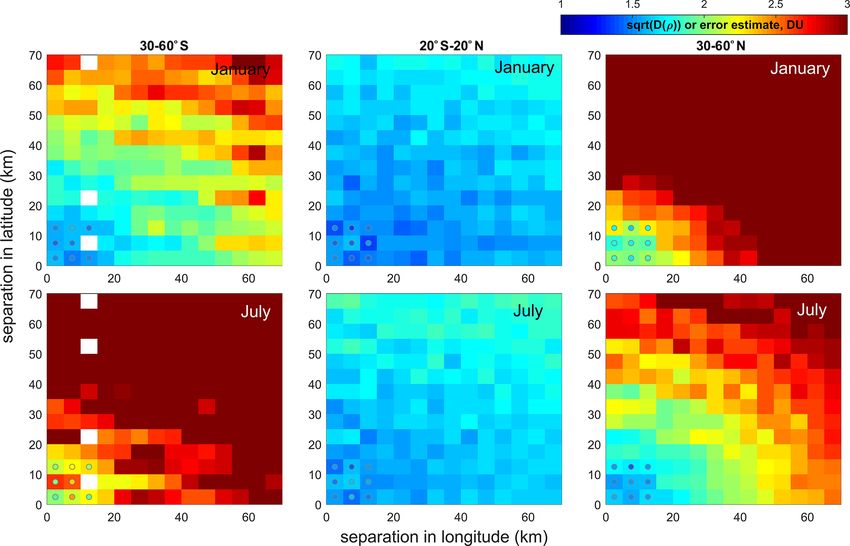
V. F. Sofieva et al.: A method for random uncertainties validation                                                                   2997

                                             √
Figure 4. Structure function (expressed as    D(ρ) in DU) for different latitude bands (columns) and months (rows).

Figure 5. Structure function (in DU) for different latitude bands (columns) and months (rows), with the focus on small separations. Colored
circles at the origin indicate the uncertainty estimates (ex ante) given by the inversion algorithm.

https://doi.org/10.5194/amt-14-2993-2021                                                   Atmos. Meas. Tech., 14, 2993–3002, 2021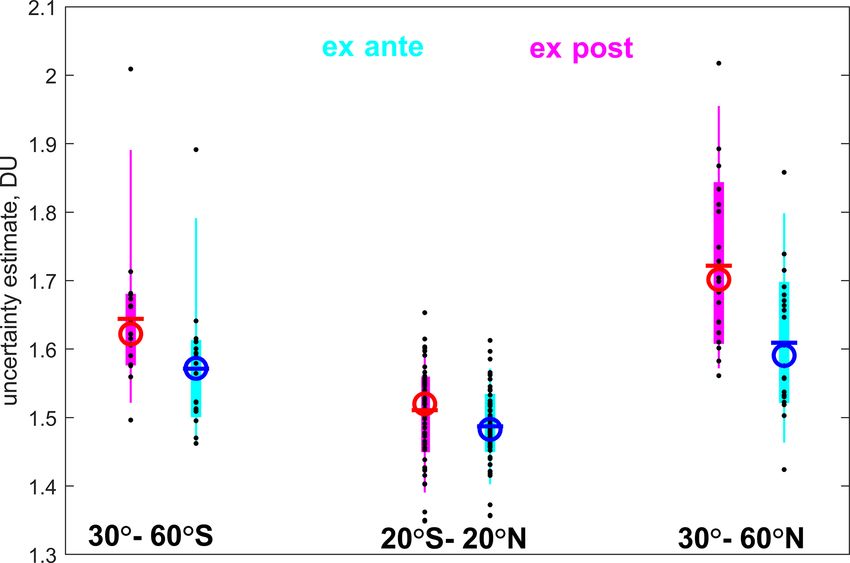
2998                                                             V. F. Sofieva et al.: A method for random uncertainties validation

Figure 6. The distributions of experimental uncertainty estimates
using the structure function method (ex post: magenta and red color)
and the theoretical values by the inversion algorithm (ex ante: cyan     Figure 7. One-dimensional structure functions in latitude and in
and blue color) in the tropics and at mid-latitudes. Black dots show     longitude separations (color lines), which are computed from a
individual values, circle is median, horizonal dash is mean, thick       two-dimensional structure function like in Fig. 4 by averaging over
vertical lines span over 16th–84th inter-percentile range, thin verti-   longitude–latitude separations from 0 to 20 km. The symbols at zero
cal lines span over 5th–95th inter-percentile range of the uncertainty   separations indicate ex ante uncertainty estimates.
estimates.

                                                                         tions, the pseudo-random errors due to the presence of clouds
structure function values at the zero limit are nearly identical         are not characterized by the inversion algorithm at the mo-
to the theoretical random error estimates in the data. This in-          ment; therefore it is expected that the structure function is
dicates that the random uncertainty estimates provided by the            higher at zero separations than ex ante uncertainty estimates.
inversion algorithm are close to reality. In the regions of large        This is clearly observed in Fig. 7: in cloud-free conditions,
ozone variation (mid-latitudes in local winter), the structure           the nugget of the structure function nearly coincides with the
function grows so rapidly that it has the values comparable              ex ante uncertainty estimates, while in cloudy conditions it
with theoretical ex ante uncertainties only for very small sep-          is substantially higher, thus indicating the presence of addi-
aration distances.                                                       tional pseudo-random uncertainties.
   The distribution and statistical parameters of experimen-                It is quite evident that the structure function method can
tal uncertainty estimates using the structure function method            be applied to any dataset in which data with different separa-
(ex post) and the theoretical uncertainty estimates provided             tion distances can be found. The approach might especially
by the inversion algorithm (ex ante) in the tropics and at               be useful for other remote sensing measurements in nadir-
mid-latitudes are shown in Fig. 6. The individual values of              looking geometry, which have fine horizontal resolution. The
the structure function and ex ante uncertainties (black dots             datasets should not be necessarily remote sensing measure-
in Fig. 6) are selected for small separations: 20 × 20 km                ments. The structure function can also be applied, for exam-
latitude-longitude separation distance in tropics (all sea-              ple, to modeled data by a chemistry-transport model, in order
sons), 15 km × 15 km in summer–autumn at mid-latitudes                   to estimate numerical noise in the model.
and 5 km × 5 km in winter–spring at mid-latitudes. The sta-
tistical parameters of the distributions – the mean and median
values in percentiles – are also shown in Fig. 6. In the trop-           6   Summary
ics, ex post and ex ante uncertainty estimates are in very good
agreement; they are ∼ 1.5 DU. At mid-latitudes, the distribu-            The analyses performed in our paper have shown that the
tion of ex post uncertainty estimates is slightly shifted to-            structure function method – i.e., the evaluation of rms dif-
ward larger values compared to the distribution of ex ante               ferences as a function of increasing spatial separation – is a
uncertainties, but the difference in the mean values is small,           powerful tool, which allows quantification of random noise
less than ∼ 0.1 DU, and the 16th–84th inter-percentile ranges            in the data. The limit at zero mismatch provides the exper-
overlap.                                                                 imental estimate of the random uncertainty variance. In our
   The structure function method is also a powerful tool for             paper, we applied the structure function method to validate
detecting non-accounted pseudo-random errors. To demon-                  the TROPOMI clear-sky total ozone random uncertainty es-
strate this, we compare in Fig. 7 the structure functions                timates by the inversion algorithm. We found that the lat-
in the tropics for TROPOMI ozone data in clear-sky and                   ter are very close to the experimental ones provided by the
cloudy conditions (cloud fraction > 0.2). In cloudy condi-               structure function method, in the regions of small total ozone

Atmos. Meas. Tech., 14, 2993–3002, 2021                                                    https://doi.org/10.5194/amt-14-2993-2021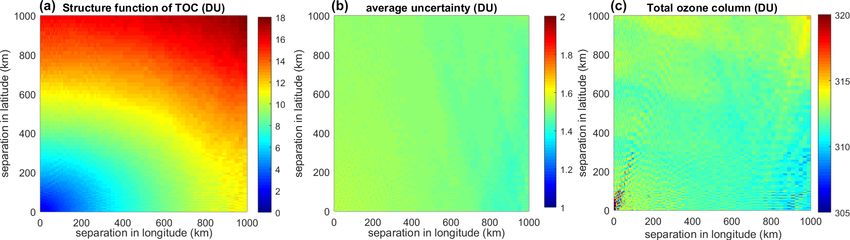
V. F. Sofieva et al.: A method for random uncertainties validation                                                           2999

natural variability. This indicates adequacy of the TROPOMI              The structure function method is also a powerful tool for
random error estimation.                                              detecting non-accounted pseudo-random errors. In the paper,
   At the same time, the structure function method provides           we have demonstrated this by comparing the structure func-
the detailed information about the natural variability of the         tions and theoretical uncertainty estimates for TROPOMI
measured parameter. For TROPOMI total ozone, we have                  ozone measurements in clear-sky and cloudy conditions.
analyzed the structure functions in different seasons and                The structure function method discussed in the paper can
latitude zones. We found the expected results: the overall            be equally applied to other remote sensing measurements or
variability is the smallest in the equatorial region, and the         atmospheric model data.
largest variability is at middle and high latitudes in winter
and spring. At these locations and during these seasons, the
rms of ozone differences grows rapidly with the separation
between measurements achieving ∼ 5 % at distances of 300–
500 km. Our analysis has shown that the structure function is
anisotropic (variability is larger in the latitudinal direction) at
separations of a few hundred kilometers nearly everywhere,
except at northern polar regions. For lower separation dis-
tances (up to 20–40 km), the structure function generally re-
mains isotropic.

https://doi.org/10.5194/amt-14-2993-2021                                               Atmos. Meas. Tech., 14, 2993–3002, 2021
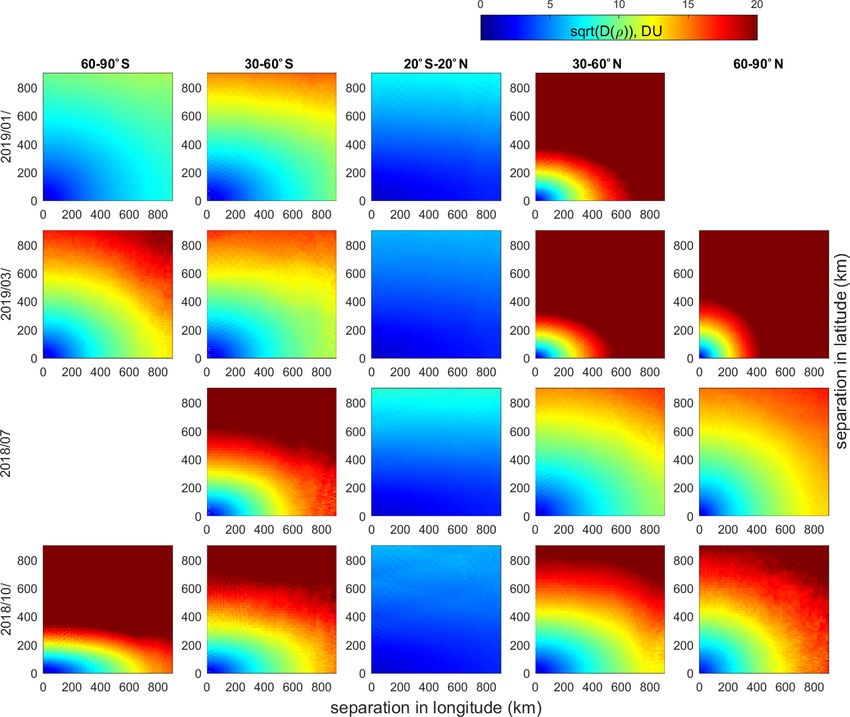
3000                                                          V. F. Sofieva et al.: A method for random uncertainties validation

Appendix A

Figure A1. Structure function (in %) for different latitude bands (columns) and months (rows).

Atmos. Meas. Tech., 14, 2993–3002, 2021                                                   https://doi.org/10.5194/amt-14-2993-2021
V. F. Sofieva et al.: A method for random uncertainties validation                                                                       3001

Data availability. The Level 2 total ozone column datasets                   sistency with other satellite missions, Atmos. Meas. Tech., 12,
are available at https://doi.org/10.5270/S5P-fqouvyz (Copernicus             5263–5287, https://doi.org/10.5194/amt-12-5263-2019, 2019.
Sentinel-5P, 2018).                                                       Gurvich, A. S. and Brekhovskikh, V.: A study of turbulence and in-
                                                                             ner waves in the stratosphere based on the observations of stellar
                                                                             scintillations from space: A model of scintillation spectra, Wave.
Author contributions. VFS and HSL have performed the analyses                Random Media, 11, 163–181, 2001.
and wrote the major part of the text. CL, FR and DGL are the de-          Kolmogorov, A. N.: Curves in Hilbert space invariant with respect
velopers of the TROPOMI total ozone inversion algorithm. All the             to a oneparameter group of motions, Dokl. Akad. Nauk SSSR,
authors (VFS, HSL, CL, FR, DGL and JT) contributed to writing                26, 6–9, 1940.
the paper.                                                                Laeng, A., Hubert, D., Verhoelst, T., von Clarmann, T., Dinelli,
                                                                             B. M., Dudhia, A., Raspollini, P., Stiller, G., Grabowski,
                                                                             U., Keppens, A., Kiefer, M., Sofieva, V. F., Froidevaux, L.,
Competing interests. The authors declare that they have no conflict          Walker, K. A., Lambert, J.-C., and Zehner, C.: The ozone cli-
of interest.                                                                 mate change initiative: Comparison of four Level-2 proces-
                                                                             sors for the Michelson Interferometer for Passive Atmospheric
                                                                             Sounding (MIPAS), Remote Sens. Environ., 162, 316–343,
                                                                             https://doi.org/10.1016/j.rse.2014.12.013, 2015.
Special issue statement. This article is part of the special issue “To-
                                                                          Lerot, C., Van Roozendael, M., Spurr, R., Loyola, D., Coldewey-
wards Unified Error Reporting (TUNER)”. It is not associated with
                                                                             Egbers, M., Kochenova, S., van Gent, J., Koukouli, M.,
a conference.
                                                                             Balis, D., Lambert, J.-C., Granville, J., and Zehner, C.:
                                                                             Homogenized total ozone data records from the European
                                                                             sensors GOME/ERS-2, SCIAMACHY/Envisat, and GOME-
Acknowledgements. The authors thank EU/ESA/DLR for provid-                   2/MetOp-A, J. Geophys. Res.-Atmos., 119, 1639–1662,
ing the TROPOMI Sentinel-5P Level 2 products used in this paper.             https://doi.org/10.1002/2013JD020831, 2014.
The work of Viktoria F. Sofieva, Hei Shing Lee and Johanna Tam-           Loyola, D. G., Gimeno García, S., Lutz, R., Argyrouli, A., Rom-
minen was supported by the ESA-funded project SUNLIT and the                 ahn, F., Spurr, R. J. D., Pedergnana, M., Doicu, A., Molina Gar-
Academy of Finland, Centre of Excellence of Inverse Modelling                cía, V., and Schüssler, O.: The operational cloud retrieval algo-
and Imaging. The work of Fabian Romahn and Diego G. Loyola                   rithms from TROPOMI on board Sentinel-5 Precursor, Atmos.
for the development of TROPOMI retrieval algorithms and proces-              Meas. Tech., 11, 409–427, https://doi.org/10.5194/amt-11-409-
sors has been supported by DLR (S5P KTR 2472046). Viktoria F.                2018, 2018.
Sofieva thanks the TUNER team for the useful discussions.                 Matheron, G.: Principles of geostatistics, Econ. Geol., 58, 1246–
                                                                             1266, https://doi.org/10.2113/gsecongeo.58.8.1246, 1963.
                                                                          Monin, A. S. and Yaglom, A. M.: Statistical Fluid Mechanics, Vol-
Financial support. This research has been supported by the ESA-              ume 2, MIT Press, Cambridge, Massachusetts, USA, 1975.
funded project SUNLIT; the Academy of Finland, Centre of Ex-              Rodgers, C. D.: Inverse Methods for Atmospheric sounding: Theory
cellence of Inverse Modelling and Imaging (decision 336798); and             and Practice, World Scientific, Singapore, 2000.
DLR (grant no. S5P KTR 2472046).                                          Sofieva, V. F., Dalaudier, F., Kivi, R., and Kyrö, E.: On the
                                                                             variability of temperature profiles in the stratosphere: Im-
                                                                             plications for validation, Geophys. Res. Lett., 35, L23808,
Review statement. This paper was edited by Doug Degenstein and               https://doi.org/10.1029/2008GL035539, 2008.
reviewed by two anonymous referees.                                       Sofieva, V. F., Tamminen, J., Kyrölä, E., Laeng, A., von Clar-
                                                                             mann, T., Dalaudier, F., Hauchecorne, A., Bertaux, J.-L., Barrot,
                                                                             G., Blanot, L., Fussen, D., and Vanhellemont, F.: Validation of
                                                                             GOMOS ozone precision estimates in the stratosphere, Atmos.
References                                                                   Meas. Tech., 7, 2147–2158, https://doi.org/10.5194/amt-7-2147-
                                                                             2014, 2014.
Copernicus Sentinel-5P (processed by ESA): TROPOMI Level 2                Staten, P. W. and Reichler, T.: Apparent precision of GPS ra-
   Ozone Total Column products, Version 01, European Space                   dio occultation temperatures, Geophys. Res. Lett., 36, L24806,
   Agency, https://doi.org/10.5270/S5P-fqouvyz, 2018.                        https://doi.org/10.1029/2009GL041046, 2009.
Cressie, N. C. A.: Statistics for Spatial Data, Wiley Series in Prob-     Tatarskii, V. I.: Wave Propagation in a Turbulent Medium, edited
   ability and Statistics, Wiley, New York, USA, 1993.                       by: Silverman, R. A., McGraw-Hill, New York, USA, 1961.
Frisch, U.: Turbulence: The Legacy of A. N. Kolmogorov, Cam-              Tatarskii, V. I.: The Effects of the Turbulent Atmosphere on
   bridge University Press, Cambridge, UK, 1995.                             Wave Propagation, Israel Program for Scientific Translations,
Garane, K., Koukouli, M.-E., Verhoelst, T., Lerot, C., Heue, K.-P.,          Jerusalem, Israel, 1971.
   Fioletov, V., Balis, D., Bais, A., Bazureau, A., Dehn, A., Goutail,    Veefkind, J. P., Aben, I., McMullan, K., Förster, H., de Vries,
   F., Granville, J., Griffin, D., Hubert, D., Keppens, A., Lambert,         J., Otter, G., Claas, J., Eskes, H. J., de Haan, J. F., Kleipool,
   J.-C., Loyola, D., McLinden, C., Pazmino, A., Pommereau, J.-P.,           Q., van Weele, M., Hasekamp, O., Hoogeveen, R., Landgraf,
   Redondas, A., Romahn, F., Valks, P., Van Roozendael, M., Xu,              J., Snel, R., Tol, P., Ingmann, P., Voors, R., Kruizinga, B.,
   J., Zehner, C., Zerefos, C., and Zimmer, W.: TROPOMI/S5P to-              Vink, R., Visser, H., and Levelt, P. F.: TROPOMI on the ESA
   tal ozone column data: global ground-based validation and con-

https://doi.org/10.5194/amt-14-2993-2021                                                     Atmos. Meas. Tech., 14, 2993–3002, 2021
3002 V. F. Sofieva et al.: A method for random uncertainties validation Sentinel-5 Precursor: A GMES mission for global observations Wackernagel, H.: Multivariate Geostatistics, Springer, Berlin, Hei- of the atmospheric composition for climate, air quality and delberg, Germany, 2003. ozone layer applications, Remote Sens. Environ., 120, 70–83, Yaglom, A. M.: Correlation theory of stationary and related random https://doi.org/10.1016/j.rse.2011.09.027, 2012. functions, Springer Verlag, New York, USA, 1987. von Clarmann, T., Degenstein, D. A., Livesey, N. J., Bender, S., Braverman, A., Butz, A., Compernolle, S., Damadeo, R., Dueck, S., Eriksson, P., Funke, B., Johnson, M. C., Kasai, Y., Kep- pens, A., Kleinert, A., Kramarova, N. A., Laeng, A., Lange- rock, B., Payne, V. H., Rozanov, A., Sato, T. O., Schneider, M., Sheese, P., Sofieva, V., Stiller, G. P., von Savigny, C., and Za- wada, D.: Overview: Estimating and reporting uncertainties in remotely sensed atmospheric composition and temperature, At- mos. Meas. Tech., 13, 4393–4436, https://doi.org/10.5194/amt- 13-4393-2020, 2020. Atmos. Meas. Tech., 14, 2993–3002, 2021 https://doi.org/10.5194/amt-14-2993-2021
You can also read