A synaptomic analysis reveals dopamine hub synapses in the mouse striatum
←
→
Page content transcription
If your browser does not render page correctly, please read the page content below
ARTICLE
                  https://doi.org/10.1038/s41467-022-30776-9                OPEN

                  A synaptomic analysis reveals dopamine hub
                  synapses in the mouse striatum
                  Vincent Paget-Blanc 1,7, Marlene E. Pfeffer 1,7, Marie Pronot 1,7, Paul Lapios1, Maria-Florencia Angelo 1,
                  Roman Walle2, Fabrice P. Cordelières 3, Florian Levet1,3, Stéphane Claverol 4, Sabrina Lacomme 3,
                  Mélina Petrel 3, Christelle Martin1, Vincent Pitard5, Véronique De Smedt Peyrusse2, Thomas Biederer 6,
                  David Perrais 1, Pierre Trifilieff 2 & Etienne Herzog 1 ✉
1234567890():,;

                  Dopamine transmission is involved in reward processing and motor control, and its impair-
                  ment plays a central role in numerous neurological disorders. Despite its strong pathophy-
                  siological relevance, the molecular and structural organization of the dopaminergic synapse
                  remains to be established. Here, we used targeted labelling and fluorescence activated
                  sorting to purify striatal dopaminergic synaptosomes. We provide the proteome of dopa-
                  minergic synapses with 57 proteins specifically enriched. Beyond canonical markers of
                  dopamine neurotransmission such as dopamine biosynthetic enzymes and cognate receptors,
                  we validated 6 proteins not previously described as enriched. Moreover, our data reveal the
                  adhesion of dopaminergic synapses to glutamatergic, GABAergic or cholinergic synapses in
                  structures we named “dopamine hub synapses”. At glutamatergic synapses, pre- and post-
                  synaptic markers are significantly increased upon association with dopamine synapses.
                  Dopamine hub synapses may thus support local dopaminergic signalling, complementing
                  volume transmission thought to be the major mechanism by which monoamines modulate
                  network activity.

                  1 Univ. Bordeaux, CNRS, Interdisciplinary Institute for Neuroscience, IINS, UMR 5297, F-33000 Bordeaux, France. 2 Univ. Bordeaux, INRAE, Bordeaux INP,

                  NutriNeuro, UMR 1286, F-33000 Bordeaux, France. 3 Univ. Bordeaux, CNRS, INSERM, Bordeaux Imaging Center, BIC, UAR 3420, US 4, F-33000
                  Bordeaux, France. 4 Univ. Bordeaux, Plateforme Proteome, 33000 Bordeaux, France. 5 UB’FACSility CNRS UMS 3427, INSERM US 005, Univ. Bordeaux,
                  F-33000 Bordeaux, France. 6 Department of Neurology, Yale School of Medicine, New Haven, CT 06511, USA. 7These authors contributed equally: Vincent
                  Paget-Blanc, Marlene E. Pfeffer, Marie Pronot. ✉email: etienne.herzog@u-bordeaux.fr

                  NATURE COMMUNICATIONS | (2022)13:3102 | https://doi.org/10.1038/s41467-022-30776-9 | www.nature.com/naturecommunications                            1
ARTICLE                                                                 NATURE COMMUNICATIONS | https://doi.org/10.1038/s41467-022-30776-9

S
       ince the 1950s with the first ultrastructural characterization         miniaturized to 1.5 ml tubes as previously published24,25 to gen-
       of the synapse in the central nervous system1 a wide variety          erate samples labelled with EGFP (Fig. 1a). To validate our
       of synapse types has been described based on morphological            labelling and fractionation approach, we performed a complete
criteria2. The archetypal synapse type is the so-called asymmetric           subcellular fractionation of the dissected striata and measured the
excitatory synapse on dendritic spines1, which represent the vast            amount of two soluble reporter proteins, tyrosine hydroxylase
majority of synapses (~80%). Its ultrastructure is easily identifi-           (Th), that catalyses the limiting step for dopamine synthesis26,
able in the tissue by the presence of a postsynaptic density and a           and the fluorescent reporter EGFP. They were probed using a
dense cluster of synaptic vesicles, and it has been extensively              semi-automatic capillary immunoblot system producing electro-
studied in vitro using primary neuronal cultures3. Alternatively,            phoregrams (Fig. 1b) or membrane-like band patterns (Fig. 1c).
symmetric synapses are predominantly inhibitory or modulatory.               Quality controls of the fractionation show the enrichment of
They do not display postsynaptic densities and are more difficult             synaptophysin (Syp) in synaptosomes (SYN) and crude synaptic
to identify in situ4,5. Moreover, many types of synaptic organi-             vesicle (LP2) fractions, while the plasma membrane glutamate
zations are not abundant enough and/or accessible with in vitro              transporter GLAST (Slc1a3/GLAST) is enriched in synaptic
models. These limitations hinder our understanding of neuronal               plasma membranes (SPM). We confirm the high concentration of
network functioning.                                                         Th and EGFP signals in synaptosomes (SYN) and derived soluble
   While glutamate and GABA (Gamma-Amino Butyric Acid)                       fractions (LS1 and LS2) while they are weak in nuclear P1 and
neurotransmissions drive point to point information locally,                 cytosolic S2 fractions, relative to homogenate (H) (H: Th = 1 ±
modulatory neurotransmitters pace regional activity through                   0.26, EGFP = 1 ± 0.53; P1: Th = 0.36 ± 0.07, EGFP = 0.23 ± 0.09;
volume transmission in the neuropil6,7. Dopamine transmission                S2: Th = 0.77 ± 0.1, EGFP = 0.49 ± 0.23; P2: Th = 1.2 ± 0.27,
is a major neuro-modulatory system involved in several functions             EGFP = 1.12 ± 0.52; SYN: Th = 1.5 ± 0.31, EGFP = 1.48 ± 0.71;
such as movement initiation, reward prediction error and                     LS1: Th = 2.2 ± 0.19, EGFP = 1.8 ± 0.5; SPM: Th = 0.26 ± 0.02,
incentive processes, notably by its projections onto spiny pro-              EGFP = 0.07 ± 0.02; LS2: Th = 1.58 ± 0.32, EGFP = 1.29 ± 0.22;
jection neurons (SPNs) of the striatum8. Dopamine signalling is              LP2: Th = 0.82 ± 0.4, EGFP = 0.03 ± 0.01; N = 3 complete frac-
presumed to modulate glutamate transmission onto SPNs                        tionations; Fig. 1c, d). Based on these reporters, we can conclude
through the release of dopamine mainly from varicosities devoid              that most of the cytosolic content of dopaminergic axons is
of synaptic differentiation. Previous investigations assessing the           present in the synaptosome fraction (SYN) and available for
presence of dopaminergic synapses found that only a minority of              discrimination by the fluorescence-activated synaptosome sorting
axon terminals form synapses onto SPN spines, dendrites, or                  (FASS)21,27 procedure (Fig. 1a). Of note, a small fraction of Th
presynapses4,5,9. Recent work also challenges the model of                   seems associated with light membranes of the crude synaptic
volume dopamine transmission by providing evidence for local                 vesicle fraction, an observation reminiscent of the one made with
point-to-point signalling. In particular, optophysiology approa-             GABA synthesizing enzymes28.
ches revealed rapid and local transmission at dopaminergic                      FASS21,27 applied to this sample allowed recovering up to 35
projections to the striatum10–12, which is in accordance with the            million fluorescent synaptosomes according to cytometer counts
existence of the machinery allowing fast dopamine release at                 (Fig. 1a). The collection of an equal number of singlet particles
striatal varicosities13. Moreover, the distribution of varicosities in       regardless of their EGFP fluorescence status served as a control
the striatal neuropil appears biased toward proximity with the               for all comparisons (SYN). Bulk FASS samples were used to
surrounding glutamatergic synapses5, and dopamine receptors                  perform immunoblot and mass spectrometry assays. In addition,
interact physically and functionally with glutamate and GABA                 we established the immobilization of particles on glass coverslips
receptors14–17, suggesting a tight coupling between dopamine,                to analyze them through quantitative immunofluorescence,
glutamate and/or GABA signalling.                                            super-resolution STED microscopy and electron microscopy
   In the present work, we unravel the cellular and molecular                (Fig. 1a). Our gating strategy was adapted from the previous
synaptome of a single projection pathway18. This critically                  work27 to avoid sorting aggregated particles, i.e. particles with
complements current connectomic approaches using optophy-                    high forward scatter (FSC) and side scatter (SSC) values and sort
siology and tracing methods, which are limited in terms of                   specifically singlets, particles with FSC values around 0
molecular analysis of specific synapses at play in a given circuit19.         (Supplementary Fig. 1a–c). Among singlets, EGFP+ events are
To that end, we established a workflow combining fluorescence                  specifically detected by setting a fluorescence threshold from the
tracing of the dopaminergic pathway, fluorescence-activated                   autofluorescence of synaptosomes from non-injected mice
synaptosome sorting20,21 and an array of semi-quantitative ana-              (Supplementary Fig. 1b). Synaptosomes from DAT-Cre-EGFP
lysis methods ranging from conventional immunofluorescence                    mice (SYN) contained on average 3.86 ± 0.53% EGFP+ synapto-
characterization to mass spectrometry-based proteomics. With                 somes (N = 9 sorts; Fig. 1e, f). Upon reanalysis of the DA-FASS
this approach, we provide a proteome and validate 6 new proteins             sample in the cell sorter, EGFP+ events represented around 50%
(Cpne7, Apba1/Mint-1, Cadps2, Cadm2/SynCAM 2, Stx4, Mgll)                    of the total (48.9 ± 2.3%, N = 8 sorts; Fig. 1f) and EGFP−
enriched at dopaminergic synapses from the mouse striatum.                   synaptosomes were concomitantly depleted (SYN: EGFP−
Moreover, we show a physical coupling between dopaminergic                   Singlets = 66.1 ± 4%, N = 9 sorts; DA-FASS: EGFP− Singlets =
and other synapses in a tight multipartite complex that we name               30.9 ± 2.8%, SYN-DA-FASS: Šídák’s multiple comparison
“dopamine hub synapses”.                                                     ****p < 0.0001 N = 8 sorts; Fig. 1f). Based on these values, we
                                                                             can expect an enrichment of a specific component of dopami-
                                                                             nergic synaptosomes of 48.9/3.9 = 12.5-fold in DA-FASS relative
Results                                                                      to SYN samples. With the use of mNeonGreen as a fluorescence
Fluorescence-activated synaptosome sorting (FASS) of dopa-                   reporter we increased the yield up to 35 million mNG+
minergic synaptosomes reveals multipartite synaptic hub                      synaptosomes, which we compared to an equal number of singlet
structures. We labelled the dopaminergic projection onto the                 particles, regardless of their green fluorescence status (SYN;
striatum through stereotaxic injection of an adeno-associated                Supplementary Fig. 1e–g).
viral vector carrying Cre-dependent EGFP22 in the midbrain of                   We further validated these sorts using capillary
Dopamine Transporter promoter (DAT)-Cre transgenic mice23                    electrophoresis-based immunoblots. As expected, Th and the
(Fig. 1a). We applied a classical synaptosome fractionation                  dopamine transporter (Slc6a3/DAT) display a strong enrichment

2                NATURE COMMUNICATIONS | (2022)13:3102 | https://doi.org/10.1038/s41467-022-30776-9 | www.nature.com/naturecommunications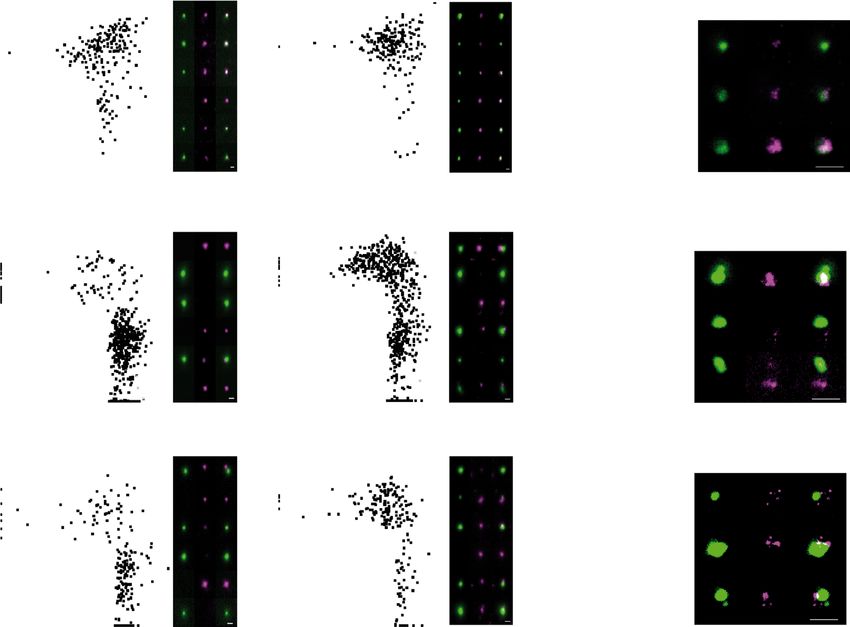
NATURE COMMUNICATIONS | https://doi.org/10.1038/s41467-022-30776-9                                                                    ARTICLE

after DA-FASS. In contrast, GLAST is strongly depleted while the                synaptic elements (Fig. 1l). In another example, we found two
glutamate receptor (Gria1/GluA1) or the synaptic active zone                    distinct presynapses, one electron-dense terminal with a synaptic
protein Munc18 (Stxbp1) are reduced (Fig. 1g). We then                          vesicle cluster adhering to a presynaptic element with few vesicles
performed qualitative ultrastructural analysis on DA-FASS                       and to another compartment that could be dendritic (Fig. 1j).
samples using transmitted electron microscopy (TEM) (Fig. 1h–l).                Finally, a postsynaptic element displayed adhesion to three different
We identified synaptosome profiles with resealed presynaptic                      “boutons”, one of them displaying a clearer background and fewer
elements (Fig. 1h) and in some cases a clear adhesion with a                    vesicles (Fig. 1k). Contrarily to aggregates, these multipartite
postsynaptic membrane (Fig. 1i). Surprisingly, we also identified                synapses were preserved even though our procedure exposed them
profiles displaying several presynapses organized around possible                to shearing forces twice, first during tissue homogenization and
postsynaptic membranes (Fig. 1j–l). Most of the synaptosomes                    second, in flight through the nozzle of the cell sorter21,27,29 (see the
were cut at an angle that prevented the clear identification of all              workflow in Fig. 1a; Supplemental Figs. 1 and 5). Beyond displaying

NATURE COMMUNICATIONS | (2022)13:3102 | https://doi.org/10.1038/s41467-022-30776-9 | www.nature.com/naturecommunications                             3
ARTICLE                                                                  NATURE COMMUNICATIONS | https://doi.org/10.1038/s41467-022-30776-9

Fig. 1 Single projection fluorescence-activated synaptosome sorting (FASS) isolates dopaminergic hub synaptosomes. a Workflow of DAT-cre/AAV-
EGFP synaptosome sorting and analysis. DAT-Cre mice injected with a Cre-dependent AAV expressing EGFP or mNeonGreen (Supplementary Fig. 1) in the
Substantia Nigra pars compacta and the Ventral Tegmental Area. Fluorescence guided dissection in the Striatum (Str, red-dashed circle). Subcellular
fractionation and FASS. Collection on filters or glass coverslips for FASS sample analysis by mass spectrometry, immunoblot, electron microscopy, or
immunofluorescence. b–d Analysis of subcellular fractionation through capillary electrophoresis immunoblot. b EGFP and Th chemiluminescence peaks for
H (blue) and LS1 (green) fractions. c Chemiluminescence bands of Synaptophysin1, Slc1a3/GLAST, Th and EGFP. d Relative integrated intensity for Th
(grey) and EGFP (green) for each subcellular fraction (H to LP2), (mean ± SEM from 3 independent fractionations; Two-way ANOVA: Interaction
F8,36 = 0.273 p = 0.971, Fraction F8,36 = 7.062 ****p < 0.0001, Protein F1,36 = 2.387 p = 0.131). e Flow cytometry analysis of synaptosomes through DA-
FASS sorting. The EGFP + gate was set to have 0–0.2% of events in control SYN samples. Before sorting SYN show 2–6% of EGFP + synaptosomes while
DA-FASS contains 40–60% of EGFP + synaptosomes. f Averaged percentage of gated particles from SYN (N = 9) and DA-FASS (N = 8) biologically
independent synaptosome preparations (mean ± SEM; Two-tailed Mann–Whitney test for all singlets SYN-DA-FASS *p = 0.01 and Two-way ANOVA for
EGFP ± singlets: Interaction F1,30 = 218.3 ****p < 0.0001, Gating F1,30 = 66.42 ****p < 0.0001, Condition F1,30 = 3.302 P = 0.079 with Šídák’s multiple
comparisons test). g Immunoblot against Th, DAT, Munc18, GluA1 and GLAST through DA-FASS (N = 1). h–l Electron micrographs of sorted
synaptosomes (N = 2). h, i Typical synaptosomes displaying a bouton (b), synaptic vesicles (SV) and an opened postsynaptic membrane (arrowheads in i).
j Example of a multipartite synaptosome displaying a SV-rich bouton (b1) contacting a postsynaptic membrane (arrowheads) and a second bouton
(arrows) less populated with SVs (b2). k Multipartite synaptosome displaying 3 distinct presynaptic profiles (b1, b2, and b3) contacting a postsynaptic
membrane (arrowheads). l Multipartite synaptosome cut through a plane that is not optimal. Boutons (b), Mitochondria (m). Scale bar, 200 nm; for
uncropped immunoblots see supplementary material or original data files in source data.

axo-axonic or axo-spinous synapses, our fractionation isolates                +/D1R− = 28.1 ± 1.4%, N = 3 sorts, n = 22 fields of view;
multipartite bound synaptic elements that we name “dopamine                   Fig. 2e–g upper quadrants). D1R immunolabelling appeared as
hub synapses”.                                                                patches of staining apposed to EGFP+ particles (Fig. 2h). D2R
                                                                              labels were found on more than 78% (53/(53 + 15) × 100) of
                                                                              EGFP+ synaptosomes and co-enriched with EGFP (DA-FASS:
DA-FASS synaptosomes display pre- and postsynaptic features                   EGFP+/D2R+ = 53.2 ± 2.3%, EGFP+/D2R− = 14.6 ± 1.4%, N = 3
of dopaminergic synapses. To further characterize the dopami-                 sorts, n = 30 fields of view; Fig. 2i–k upper quadrants). EGFP
nergic hub synapses, we compared SYN synaptosomes with DA-                    −/D2R+ events were depleted more than two-fold over DA-FASS
FASS synaptosomes immobilized on coverslips and immunolabelled                (SYN: EGFP−/D2R+ = 72.2 ± 3%, N = 3 sorts, n = 32 fields of
with dopaminergic markers. Individual synaptosomes were quanti-               view; DA-FASS: EGFP−/D2R+ = 32.3 ± 2.4%, N = 3 sorts, n = 30
fied according to EGFP and dopaminergic markers intensity.                     fields of view; SYN-DA-FASS Šídák’s multiple comparison
Quadrant gates were defined to split positives and negatives for each          ****p < 0.0001; Fig. 2i–k lower right quadrants). With STED
label (Fig. 1a). The top 2 quadrants are EGFP+ synaptosomes and               microscopy we detected D2R either co-localized with EGFP
percentages of particles are displayed in each quadrant. Th+/EGFP+            (putative autoreceptors), or distributed in patches apposed to
synaptosomes population rose from 57% of the total population                 EGFP (putative heteroreceptors, Fig. 2l) as described with
before sort to 83% after sort (SYN: EGFP+/Th+ = 57.4 ± 2.8%,                  immunogold electron microscopy30, even though the exact
N = 2 sorts, n = 13 fields of view; DA-FASS: EGFP+/Th+ =                       nature of each patch cannot be readily established. Altogether,
83.1 ± 1.1%, N = 3 sorts, n = 21 fields of view; SYN-DA-FASS                   our data support the view that dopaminergic synaptosomes bear a
Šídák’s multiple comparison ****p < 0.0001; Fig. 2a, b). Stimulated           postsynaptic element containing cognate receptors. Consistent
Emission Depletion (STED) imaging, which has a resolution of                  with the fact that roughly half of SPNs express D1R and the other
30 nm, below synaptosome size of about 500 nm (Fig. 1h–l) revealed            half D2R31, 51% of EGFP+ synaptosomes are associated with
that Th signals were highly co-localized with EGFP (Fig. 2d).                 D1R expressing SPNs and the rest most likely with D2R, but our
Similarly, we found a strong co-localization of EGFP+ synaptosomes            observation is confounded by the presence of D2R autoreceptors
with DAT (Dopamine Transporter) signal (SYN: EGFP+/DAT+ =                     at both types of synaptosomes.
14.5%; DA-FASS: EGFP+/DAT+ = 47%; N = 1 sort; Supplementary
Fig. 2a, b). As expected from the immunoblot analysis (Fig. 1g),
the marker Slc1a3/GLAST that labels astrocytic membranes                      Label-free semi-quantitative proteomics reveals 57 proteins
was not significantly associated with the EGFP+ synaptosomes                   highly enriched at DA-FASS synaptosomes. To identify the
(SYN: EGFP+/GLAST+ = 1%; DA-FASS: EGFP+/GLAST+ = 6%;                          molecular nature of dopaminergic synaptosomes, we generated a
N = 1 sort; Supplementary Fig. 2c, d). These data further confirm              set of six DA-FASS samples and processed them for label-free
that EGFP+ synaptosomes bear genuine dopaminergic synaptic                    quantification of proteins through mass spectrometry (MS). We
markers and are strongly enriched through DA-FASS.                            accumulated 35 million mNeonGreen+ synaptosomes from three
   We then explored the co-segregation of dopamine receptors                  independent DA-FASS experiments. All SYN singlets represent-
type 1 and -2 (D1R, D2R) together with EGFP+ synaptosomes.                    ing the conventional synaptosome preparation were used as
D1R co-enriched almost 10-fold (29/3) with DA-FASS (SYN:                      control samples (3 in total). A total of 3824 proteins were iden-
EGFP+/D1R+ = 3.2 ± 0.7%, N = 2 sorts, n = 12 fields of view;                   tified with one peptide or more, throughout the six samples.
DA-FASS: EGFP+/D1R+ = 28.6 ± 2%, N = 3 sorts, n = 22 fields                    Among these, 2653 proteins were identified robustly and quan-
of view; SYN-DA-FASS Šídák’s multiple comparison                              tified with at least 2 distinct peptides. We considered a significant
****p < 0.0001; Fig. 2e–g), while D1R+/EGFP− events were                      difference between samples for proteins displaying a ratio greater
depleted      two-fold      (SYN:      EGFP−/D1R+ = 86.8 ± 1.4%,              than 1.5 in DA-FASS samples compared to SYN, with an adjusted
N = 2 sorts, n = 12 fields of view; DA-FASS: EGFP−/D1R+ =                      p-value smaller than 0.05. Based on these criteria, 63 proteins are
43.2 ± 2%, N = 3 sorts, n = 22 fields of view; SYN-DA-FASS                     significantly depleted upon sorting while 57 others appear sig-
Šídák’s multiple comparison ****p < 0.0001; Fig. 2e–g bottom                  nificantly enriched (Fig. 3g, Supplementary Table 3). The deple-
right quadrants). Fifty one percent of EGFP+ synaptosomes                     ted proteins did not have a clear gene ontology signature and
(29/(29 + 28) × 100) were labelled for D1R (DA-FASS: EGFP

4                 NATURE COMMUNICATIONS | (2022)13:3102 | https://doi.org/10.1038/s41467-022-30776-9 | www.nature.com/naturecommunications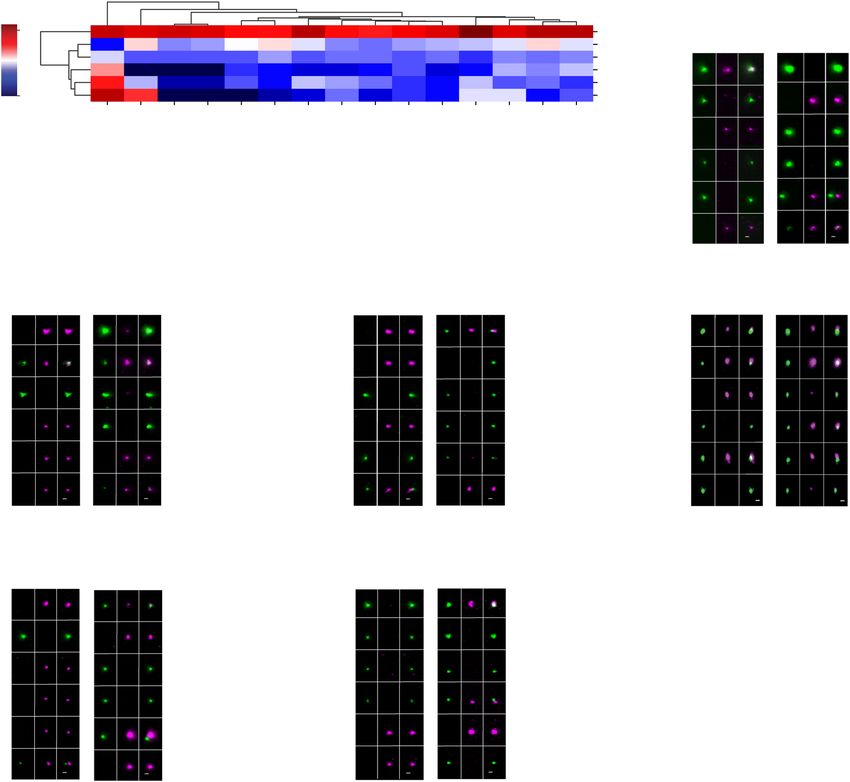
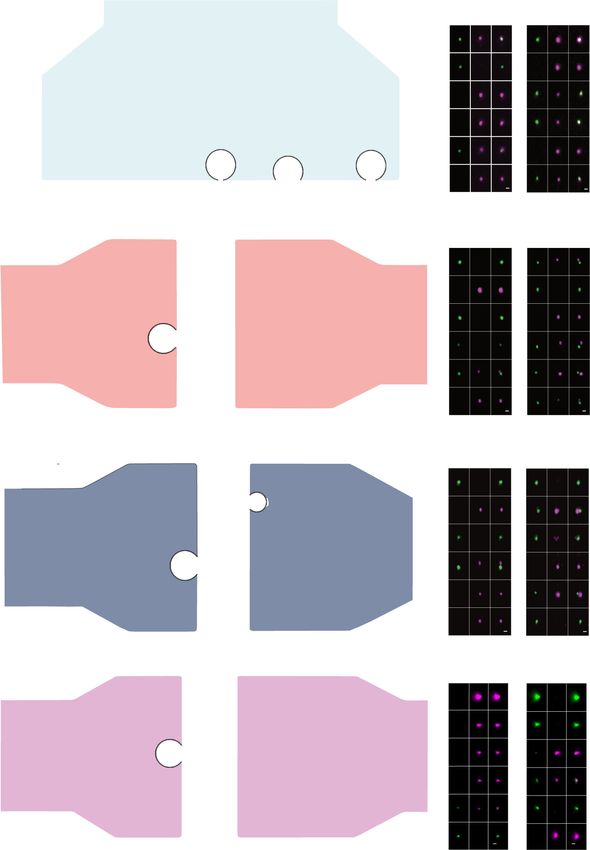
NATURE COMMUNICATIONS | https://doi.org/10.1038/s41467-022-30776-9                                                                       ARTICLE

Fig. 2 Immunofluorescence analysis of DA-FASS synaptosomes reveal the enrichment for pre- and postsynaptic dopaminergic markers.
a, b Epifluorescence images of SYN and DA-FASS synaptosomes immobilized on coverslips and immunolabelled with anti-Th and anti-EGFP. Dot plot
population analysis of fluorescence intensities in both channels. c Analysis of staining as in a and b showing particle proportions per frame. d STED images
of EGFP (green) and Th (magenta) labelled synaptosomes. e, f Same as a, b for EGFP and D1 dopamine receptors. g Proportion of differently stained
particles per frame. h STED microscopy detects D1 receptor clusters (magenta) apposed to the EGFP+ synaptosomes (green). i, j Same as a-b for anti-
EGFP and anti-D2 dopamine receptors. k Proportion of differently stained particles per frame. l STED images display D2R (magenta) patches apposed to
EGFP (green). All data are mean ± SEM and pulled from N = 2 to N = 3 independent sorts and n = 4 to n = 11 field of view per independent sort. Each
independent sort pooled at least 3 animals. Statistical significance was analyzed using Two-way ANOVA; c EGFP/Th: Interaction F2,96 = 65.04
****p < 0.0001, Condition F1,96 = 0.034 p = 0.855, Immunolabelling F2,96 = 510.3 ****p < 0.0001; g EGFP/D1R Interaction F2,96 = 208 ****p < 0.0001,
Condition F1,96 = 0.007 p = 0.931, Immunolabelling F2,96 = 437.9 ****p < 0.0001; k EGFP/D2R: Interaction F2,180 = 149.4 ****p < 0.0001, Condition
F1,180 = 0.671 p = 0.414, Immunolabelling F2,180 = 163.5 ****p < 0.0001 with Šídák’s multiple comparisons test. For all panels, scale bar = 1 μm. See extra
immunofluorescence analysis in Supplementary Fig. 2.

were not studied further. We thus focused on the enriched                       SynGO covering all localizations and functions reported in the
proteins.                                                                       second level of SynGO terms. This gene set is associated with
   We first compared the 2653 proteins dataset to the broad                      synapse organization (184 genes over 306 genes in the category), a
survey of mouse brain proteins produced by Sharma and                           process in the presynapse (183/269), process in the postsynapse
colleagues32. Ninety percent of our dataset is common to the                    (131/218), synaptic signaling (106/193), metabolism (25/94) and
global mouse brain proteome. Among 158 proteins significantly                    transport (23/36) (Fig. 3e).
enriched in the bulk dissection of the striatum, 89 are represented                Beyond 57 proteins highly enriched during DA-FASS proce-
in the synaptosome samples which is consistent with the                         dure, we identified a strong enrichment of the reporter protein
selectivity of our subcellular fractionation (Fig. 3b, c, Supple-               mNeonGreen (12 unique peptides, 5.12-fold increase, adjusted p-
mentary Table 4). 403 proteins are common with those previously                 value = 1.6 × 10⁻¹⁶; Fig. 3f, g, Supplementary Table 3). mNeon-
identified to be specific to a given cell type. A heatmap analysis of             Green enrichment thus represents the target enrichment value for
these shows the main neuronal origin of our synaptosome                         the most specific dopaminergic proteins. In line with this, the
samples (Fig. 3d, Supplementary Table 4, Supplementary Fig. 3).                 major canonical proteins involved in dopamine metabolism (Th;
We then compared the obtained proteome with the curated                         Ddc: DOPA decarboxylase; Slc18a2/VMAT2: Vesicular Mono-
database of known synaptic gene ontologies (SynGO)33. Among                     amine Transporter type 2) show similar enrichment values.
2653 genes from this proteome, 684 genes are documented in                      Slc6a3/DAT displays a slightly lower enrichment that may be

NATURE COMMUNICATIONS | (2022)13:3102 | https://doi.org/10.1038/s41467-022-30776-9 | www.nature.com/naturecommunications                                 5
ARTICLE                                                                                                                                                  NATURE COMMUNICATIONS | https://doi.org/10.1038/s41467-022-30776-9

             a                                   3x DA-FASS
                                                                          sample               Silver                                                                                      Proteome                                       Label Free relative                                         g Enriched   Depleted
                                                                         recovery             Staining                                        nLC - MS/MS           Acacb                 Discoverer®                                       Quantification                                                         Acaa2
                                                                                   SYN                                                                           Aldh1a1#                                                                                                                                          Acadsb
                                                 SYN                                                                                        2653                 Aldh1a7#                                                                                                                                          Acta1
                                                                                                                                                                                                                                                                                                                   Acta2
                                             6.5% mNG+                                                       3824 proteins        proteins quantified Ankrd34b    Apba1#*                                                                                                                                          Actc1
             count                                                                  250  500     750 1000      Identified                                                                                                                                                                                          Actg2
                                                                                             m/z
                                                                                                                                63 proteins depleted Bmerb1                                                                                                                                                        Afg3l1
                                              DA-FASS                              DA-FASS                                                                              Ca4
                                             50% mNG+                                                                           57 proteins enriched Cadps2#*                                                                                                                                                      Aimp1
                                                                                                                                                                                                                                                                                                                   Aldh8a1
                                                                                                                                                                   Capza1
                                            6x 35 millions       6x 140ng                                                 at least 2 unique peptides AND >150%       Cd200                                                                                                                                         Anxa3
                                                                                    250  500     750
                                            sorted events      total proteins                m/z                                 or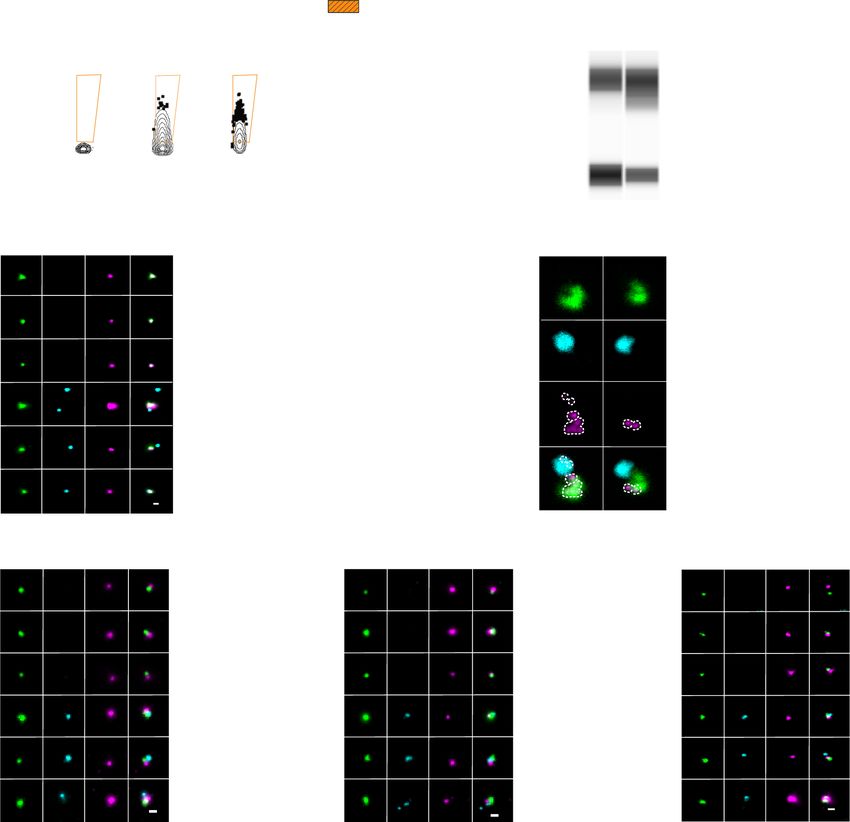
NATURE COMMUNICATIONS | https://doi.org/10.1038/s41467-022-30776-9                                                                       ARTICLE

Fig. 3 Comparative proteomic analysis of SYN and DA-FASS purified synaptosomes. a Workflow of DA-FASS semi-quantitative proteomic analysis.
Total protein content was quantified by silver staining, normalized to 140 ng for each replicate (N = 3) and cleaned onto SDS-PAGE gel before tryptic
digestion. Proteins were analyzed by high-resolution tandem MS. Of 2653 quantified proteins, 63 were depleted in DA-FASS while 57 were enriched
(Supplementary Table 3). b–d Venn diagrams representing the comparison of DA-FASS proteome with the mouse brain proteome32 b as a whole, c as
enriched in the striatum and d as cell type specific. d Heatmap showing cell type specific protein abundance (from32) among overlapping proteins.
e Overlap analysis of the DA-FASS proteome with the second level terms of the SynGO database (mostly glutamatergic and GABAergic synapse related
genes)33. f Volcano plot of DA-FASS protein quantification. Values of fold changes versus corrected p-value are plotted for each protein (on logarithmic
scales). Thresholds are set at ±1.5-fold change and p < 0.05. Proteins are colored by subclass of canonical (green) enriched (red), depleted (cyan) and
retained (grey) in the DA-FASS sample. Proteins previously described as playing a role in dopamine signaling (#). Targets selected for further experimental
validations (*). Statistical significance was tested using background based two-tailed pairwise t-test adjusted using Benjamini-Hochberg correction for the
false discovery rate. g Complete list of depleted and enriched DA-FASS proteins. h Heatmap of mRNA abundance of the enriched DA-FASS proteins in
striatal neurons (STR) or afferent cells to the striatum (SN Substantia Nigra, Thalamus, FC Frontal Cortex, PC Posterior Cortex) (DropViz;35). Hierarchical
clustering display 4 major clusters relating to the selectivity of mRNA expression (for a more detailed heatmap see Supplementary Fig. 3). i Scheme of the
molecular organization of a dopaminergic synapse (Adapted from ref. 36). Enriched proteins from our DA-FASS sample are in red, retained in grey, and
absent in white. Gene names for each protein class can be found in Supplementary Table 5 with absent ones greyed out.

their association with dopaminergic synapses (Fig. 3f, g marked                 synapses45,46. While SynCAM 2 mRNA is highly expressed in all
with a *). We monitored their segregation after DA-FASS using                   populations of neurons constituting the striatal neuropil, it is
immunofluorescence. Copine7 is a C2 domain-containing, cal-                      striking that SynCAM 2 expression is the highest in the brain in a
cium-dependent, phospholipid-binding protein (Cpne7; 1.72-fold                  subcluster of Th+ cells of the midbrain (Fig. 4a, Supplementary
enrichment measured in MS/MS, adjusted p-value *p = 0.01; see                   Fig. 3)35. Hence, SynCAM 2 represents an interesting candidate to
Fig. 3f and Supplementary Table 3), which displays a strong                     promote synaptic adhesion at dopamine hub synapses. SynCAM 2
expression in dopaminergic cells of the midbrain, but also a                    is mostly co-localized but also closely apposed with DAT signals in
significant expression in cholinergic interneurons (CINs) of the                 29% of all labeled synaptosomes, a rate strongly increased to 72%
striatum (here labelled Interneuron Chat) and in putative cortico-              after sorting (SYN: DAT+/SynCAM 2+ = 28.7 ± 1.6%; DA-FASS:
striatal cells37,38 (Fig. 4a and Supplementary Fig. 3). We find                  DAT+/SynCAM 2+ = 71.8 ± 5.7%, N = 3 and N = 2 sorts, n = 12
Copine7 either co-localized or apposed to Th+ synaptosomes in                   and 10 fields of view respectively; SYN-DA-FASS Šídák’s multiple
8% of labelled synaptosomes, a percentage that is maintained                    comparison ****p < 0.0001) (Fig. 4e). Interestingly, SynCAM 2 is
through DA-FASS (SYN: Th+/Cpne7+ = 8 ± 0.9%; DA-FASS: Th                        associated with dopamine synaptosomes at a level comparable to
+/Cpne7+ = 8.5 ± 0.4%, N = 3 sorts, n = 31 fields of view each;                  Th (see Fig. 2) but it is not a selective marker as it is expressed at
SYN-DA-FASS Šídák’s multiple comparison p = 0.995) (Fig. 4b).                   many other synapses. Stx4 (Syntaxin-4; 3.36-fold enrichment
Mint-1/Apba1 (Mint-1 for Munc18-1 interacting protein 1, also                   measured in MS/MS, adjusted p-value ***p = 0.0009; see Fig. 3f
known as Amyloid Beta Precursor Protein Binding Family A                        and Supplementary Table 3) is a SNARE protein (soluble N-
Member 1; 1.57-fold enrichment measured in MS/MS, adjusted p-                   ethylmaleimide-sensitive factor attachment protein receptor)
value *p = 0.044; see Fig. 3f and Supplementary Fig. 3) is a                    shown to mediate exocytosis at dendritic spines47,48. mRNA
neuronal adapter protein that interacts with the Alzheimer’s                    expression of Stx4 is moderate throughout afferent and efferent
disease amyloid precursor protein (APP) and plays a role at the                 cells of the striatal neuropil (Figs. 4a and S3). Stx4 signals are
synaptic active zone for neurotransmitter release39,40. Mint-1/                 mostly apposed to Th signals in 7% of all labeled synaptosomes, a
Apba1 was also shown to be involved in amphetamine-induced                      rate increased to 33% after sorting (SYN: Th+/Stx4+ = 7.2 ± 1.2%;
dopamine release41. Mint-1/Apba1 mRNA displays a strong                         DA-FASS: Th+/Stx4+ = 33.3 ± 3.1%, N = 3 sorts, n = 31 and 30
expression in Th cells of the midbrain and a milder expression in               fields of view respectively; SYN-DA-FASS Šídák’s multiple com-
CIN and potential cortical and thalamic afferent neurons (Fig. 4a               parison ****p < 0.0001) (Fig. 4f). Finally, Mgll (Monoglyceride
and Supplementary Fig. 3). We find Mint-1/Apba1 either co-                       lipase; 1.93-fold enrichment measured in MS/MS, adjusted p-value
localized or apposed with Th+ particles in 4% of all labelled                   ***p = 0.0004; see Fig. 3f and Supplementary Table 3) catalyzes
synaptosomes, a percentage that is increased to 8% upon DA-                     the conversion of monoacylglycerides to free fatty acids (+ gly-
FASS process (SYN: Th+/Mint-1+ = 3.6 ± 0.5%; DA-FASS: Th                        cerol) and is involved in the catabolism of the endocannabinoid
+/Mint-1+ = 8.4 ± 0.7%, N = 3 sorts, n = 30 and 33 fields of view,               2-AG (2-arachidonoylglycerol)49. Mgll mRNA is detected at mild
respectively; SYN-DA-FASS Šídák’s multiple comparison                           to high levels in most cell types afferent or efferent to the striatum,
p = 0.205) (Fig. 4c). Cadps2 (Calcium-Dependent Activator                       but the lowest expressers are the dopaminergic cells of the mid-
Protein For Secretion 2; 1.62-fold enrichment measured in MS/                   brain (Fig. 4a and Supplementary Fig. 3). Indeed, we find Mgll
MS, adjusted p-value *p = 0.023; see Fig. 3f and Supplementary                  apposed to Th signals in 3% of all labelled synaptosome a per-
Table 3) has been shown to play an important role in neuro-                     centage that increases to 10% upon sorting (SYN: Th+/Mgll+ =
transmitter secretion and monoamine loading in vesicles42,43.                   3.22 ± 0.5%; DA-FASS: Th+/Mgll+ = 10.3 ± 1%, N = 3 sorts,
mRNA expression of Cadps2 is high in Th+ cells and significant                   n = 33 fields of view; SYN-DA-FASS Šídák’s multiple comparison
in putative cortico-striatal cells (Fig. 4a and Supplementary                   **p = 0.002) (Fig. 4g).
Fig. 3)44. Indeed, we find Cadps2 being both co-localized or                        Altogether, we validated six new proteins from our screen for
apposed with Th signals in 13% of all labeled synaptosomes, a                   their selective association with dopaminergic synaptosomes.
rate increased to 21% after sorting (SYN: Th+/Cadps2+ = 13 ±                    Interestingly, a comparison between MS/MS label-free quantifica-
 1.7%; DA-FASS: Th+/Cadps2+ = 20.5 ± 1.5%, N = 3 sorts,                         tion and immunodetection enrichment ratios reveals a linear
n = 30 and 34 fields of view respectively; SYN-DA-FASS Šídák’s                   correlation between the results (Fig. 4h).
multiple comparison *p = 0.043) (Fig. 4d). SynCAM 2/Cadm2
(Synaptic cell adhesion molecule 2 also known as Cell adhesion                  Proteins retained during DA-FASS delineate the association of
molecule 2; 1.28-fold not significant enrichment ratio) is thought               dopaminergic varicosities in dopamine hub synapses. To fur-
to mediate heterophilic trans-synaptic adhesion at excitatory                   ther characterize the partners in dopaminergic synaptic hubs, we

NATURE COMMUNICATIONS | (2022)13:3102 | https://doi.org/10.1038/s41467-022-30776-9 | www.nature.com/naturecommunications                                 7
ARTICLE                                                                   NATURE COMMUNICATIONS | https://doi.org/10.1038/s41467-022-30776-9

Fig. 4 Validation of a selected set of DA-FASS enriched proteins with immunofluorescence. a Heatmap showing cell type specific mRNA abundance of
the 6 DA-FASS proteins selected for further experimental validation (detailed from Fig. 3h). b–g Epifluorescence images of a representative sample of
synaptosome populations labelled with b–d, f, g anti-Th (green) or e DAT and b anti-Cpne7, c Mint-1/Apba1, d Cadps2, e SynCAM 2/Cadm2, f Stx4,
g Mgll (magenta) and analysis of staining showing particle proportions per frame. All data are mean ± SEM and pulled from N = 2 to N = 3 independent
sorts and n = 5 to n = 11 field of view per independent sort. Each independent sort pooled at least 3 animals. Statistical significance was analyzed using
Two-way ANOVA, b Th/Cpne7: Interaction F2,180 = 131.9 ****p < 0.0001, Condition F1,180 = 0.0004 p = 0.984, Immunolabelling F2,180 = 570.4
****p < 0.0001; c Th/Mint-1: Interaction F2,183 = 163.7 ****p < 0.0001, Condition F1,183 = 0.0009 p = 0.975, Immunolabelling F2,183 = 316.5 ****p < 0.0001;
d Th/Cadps2: Interaction F2,187 = 110.5 ****p < 0.0001, Condition F1,187 = 0.004 p = 0.951, Immunolabelling F2,187 = 88.12 ****p < 0.0001; e DAT/
SynCAM 2: Interaction F2,60 = 84.92 ****p < 0.0001, Condition F1,60 = 4.371e-005 p = 0.995, Immunolabelling F2,60 = 73.75 ****p < 0.0001 f Th/Stx4:
Interaction F2,177 = 69.25 ****p < 0.0001, Condition F1,177 = 0.004 p = 0.95, Immunolabelling F2,177 = 49.15 ****p < 0.0001; g Th/Mgll: Interaction
F2,192 = 98.57 ****p < 0.0001, Condition F1,192 = 4.217e-005 p = 0.995, Immunolabelling F2,192 = 1242 ****p < 0.0001 with Šídák’s multiple comparisons
test. For all panels, scale bar = 1 μm. h Correlation between protein immunodetection and label-free mass spectrometry-based enrichment ratios (Two-
tailed Pearson’s correlation coefficient *p = 0.021, r2 = 0.62). Correlated data are pulled from independent experiments. Dot sizes are scaled to the
proportion of dopaminergic synaptosomes expressing each marker.

compared our screen with neurotransmission pathways reported in                (SYN: EGFP−/Synapsin+ = 83.2 ± 1.1%; DA-FASS: EGFP−/Synap-
KEGG (Fig. 3i). The pathway of SV and neurotransmitter cycling                 sin+ = 33.8 ± 2.4%, N = 2 and N = 3 sorts, n = 9 and 10 field of
shares a very high coverage with our proteome (50 protein families             view, respectively; SYN-DA-FASS Šídák’s multiple comparison
present out of 71 listed in the pathway; Fig. 5a grey boxed text,              ****p < 0.0001). (Fig. 5b).
Supplementary Tables 3 and 5). To complete this observation, we                   We then explored the proteome related to excitatory synapses.
probed for the phospho-proteins Synapsin 1&2 that are found at all             Our coverage is reliable because most categories of proteins are
presynapses50 (abundance ratio 1.03 for both isoforms in our                   kept after DA-FASS (78 out of 128 listed proteins Fig. 5c grey
screen). EGFP+/Synapsin+ synaptosomes representation rises from                boxed text, Supplementary Tables 3 and 5). We immunolabelled
7 to 45% upon DA-FASS (SYN: EGFP+/Synapsin+ = 6.6 ± 1.2%;                      DA-FASS synaptosomes for the 2 vesicular glutamate transpor-
DA-FASS: EGFP+/Synapsin+ = 44.9 ± 3.3%, N = 2 and N = 3 sorts,                 ters (VGLUT). VGLUT1 is expressed by excitatory cortico-
n = 9 and 10 fields of view respectively; SYN-DA-FASS Šídák’s                   striatal inputs while thalamo-striatal inputs express VGLUT2;
multiple comparison ****p < 0.0001; Fig. 5b) while EGFP                        both input impinge on spines of the spiny projection neurons
−/Synapsin+ synaptosomes are reduced from 83 to 34% after sort                 (SPNs)5,51. VGLUT1 varicosities are opposed to EGFP

8                  NATURE COMMUNICATIONS | (2022)13:3102 | https://doi.org/10.1038/s41467-022-30776-9 | www.nature.com/naturecommunications
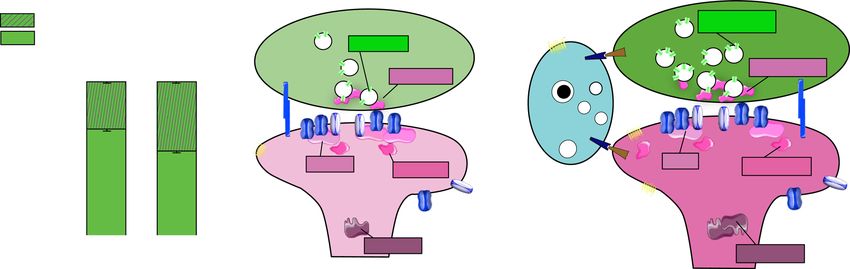
NATURE COMMUNICATIONS | https://doi.org/10.1038/s41467-022-30776-9                                                                      ARTICLE

Fig. 5 Proteomics and immunofluorescence of DA-FASS sample reveals dopamine synapse association with other synaptic partners. a Scheme of the
molecular organization of the synaptic vesicle cycle, c glutamatergic, e GABAergic and g cholinergic synapses (Adapted from the database KEGG). Proteins
enriched in DA-FASS samples are in red, depleted in cyan, retained in grey, and absent in white. Gene names for each protein can be found in
Supplementary table 4 (ST4). b, d, f, h Epifluorescence images of a representative sample of synaptosome populations before and after sorting labelled
with anti-EGFP or anti-Th (green) and b anti-Synapsin, d VGLUT1, f VIAAT and h VAChT (magenta). Quantification of stainings showing particle
proportions per frame. All data are mean ± SEM and pulled from N = 2 to N = 3 independent sorts and n = 4 to n = 11 field of view per independent sort.
Each independent sort pooled at least 3 animals. b EGFP/Synapsin: Interaction F2,51 = 237,8 ****p < 0.0001, Condition F1,51 = 0.01 p = 0.92,
Immunolabelling F2,51 = 237.5 ****p < 0.0001. d EGFP/VGLUT1 Interaction F2,63 = 91.49 ****p < 0.0001, Condition F1,63 = 0.002 p = 0.97, Immunolabelling
F2,63 = 92.06 ****p < 0.0001. f EGFP/VIAAT: Interaction F2,78 = 54.90 ****p < 0.0001, Condition F1,78 = 0.04 p = 0.844, Immunolabelling F2,78 = 55.34
****p < 0.0001. h Th/VAChT Interaction F2,144 = 180.3 ****p < 0.0001, Condition F1,144 = 0.016 p = 0.9, Immunolabelling F2,144 = 412.2 ****p < 0.0001 with
Šídák’s multiple comparisons test. For all panels, scale bar = 1 μm. See VGLUT2 immunofluorescence analysis in Supplementary Fig. 4.

NATURE COMMUNICATIONS | (2022)13:3102 | https://doi.org/10.1038/s41467-022-30776-9 | www.nature.com/naturecommunications                                9
ARTICLE                                                                 NATURE COMMUNICATIONS | https://doi.org/10.1038/s41467-022-30776-9

varicosities at hub synaptosomes (see ROI gallery; Fig. 5d).                 FASS, Th−/VAChT+ synaptosomes are depleted nearly two-fold
Through DA-FASS, EGFP−/VGLUT1+ synaptosomes are                              (SYN: Th−/VAChT+ = 62.5 ± 2.1%, DA-FASS: Th−/VAChT
depleted more than two-fold (SYN: EGFP−/VGLUT1+ = 76.2 ±                     + = 28 ± 1.3%, N = 3 and N = 2 sorts, n = 30 and n = 20 fields
 1.6%; DA-FASS: EGFP−/VGLUT1+ = 30.9 ± 4.6%, N = 3 sorts,                    of view, respectively, SYN-DA-FASS Šídák’s multiple comparison
n = 12 and 11 fields of view respectively; SYN-DA-FASS Šídák’s                ****p < 0.0001; Fig. 5h).
multiple comparison ****p < 0.0001; Fig. 5d). Yet, 30% of                       Hence, our proteomic and immunofluorescence data support a
dopaminergic EGFP+ synaptosomes (21/(21 + 49)) are associated                very frequent association of dopamine presynapses with all the
with a VGLUT1 presynapse (DA-FASS: EGFP+/VGLUT1+ =                           major synaptic partners operating in striatal neuropil. This
 20.8 ± 2.7%, N = 3 sorts, n = 11 fields of view; Fig. 5d) and                finding further validates our earlier electron microscopy observa-
enriched three-fold through DA-FASS (from 6 to 21%; SYN:                     tions (Fig. 1j–l). To validate the accuracy and specificity of our
EGFP+/VGLUT1+ = 5.9 ± 1.4%, N = 3 sorts, n = 12 fields of                     results, we performed several controls. A random associations test
view; SYN-DA-FASS Šídák’s multiple comparison **p = 0.002;                   was applied to our images in order to establish the probability for
Fig. 5d). VGLUT2 signals follow the same trend even though                   separate particles to sediment at the same sites by chance (see
VGLUT2 is less associated with EGFP+ synaptosomes than                       methods). Indeed, for all our datasets, random associations occur
VGLUT1 (SYN: EGFP+/VGLUT2+ = 1.8 ± 1.1%, DA-FASS:                            on less than 0.5% of all events while we observe at least 10% for
EGFP+/VGLUT2+ = 11.2 ± 1.4%, N = 2 and N = 3 sorts, n = 6                    synaptic hub-related associations in sorted samples (see Table 1).
and n = 14 fields of view, respectively; Supplementary Fig. 4). As            As a final control for the specificity of hub-synaptosome
a negative control, we assessed whether VGLUT1 and                           adhesion, we performed an additional VGLUT1-FASS experi-
VGLUT2 synaptosomes may co-purify through FASS by                            ment in which we selectively sorted aggregates and large events to
performing FASS sorting and labelling of VGLUT1venus striatal                analyze them with electron microscopy (Supplementary Fig. 5h–j).
synaptosomes (Supplementary Fig. 5a–g). As expected, VGLUT2-                 Upon reanalysis, sorted aggregates display a strong increase in the
synaptosomes are mostly segregated from VGLUT1venus synapto-                 representation of small and large aggregates (Supplementary
somes, and VGLUT2+/VGLUT1Venus+ particles are not co-                        Fig. 5h, i). Singlets are still strongly represented in the reanalyzed
enriched through VGLUT1-FASS sorting (9% in SYN sample vs                    sample as it is common to break down aggregates into singlets
6% in VGLUT1-FASS synaptosomes; Supplementary Fig. 5f–g                      through the shearing forces applied in the nozzle of the sorter
upper right quadrants). The absence of association is consistent             (Supplementary Fig. 5h, i). Electron micrographs display profiles
with the fact that these 2 markers were shown to contact distinct            of large particles (3–6 µm in diameter) that are difficult to relate
spines on SPNs5,52,53.                                                       to identifiable features of the tissue and very different from the
   Our proteome also displays an abundant representation of                  DA-FASS synaptosomes displayed in Fig. 1 (Supplementary
markers of inhibitory synapses kept through DA-FASS enrichment               Fig. 5j).
(69 out of 106 listed proteins, Fig. 5e gray boxed text,                        Altogether, we identified the association of dopaminergic with
Supplementary Tables 3 and 5). Of note, two proteins of                      glutamatergic and GABAergic synapses in synaptic hub structures
GABAergic synapses are depleted after DA-FASS (Gabra3 and                    that may mediate the modulatory influence of dopamine over
Prip; Fig. 5e blue boxed text, Supplementary Tables 3 and 5). We             excitatory and inhibitory synaptic signalling. Cholinergic inputs
therefore probed DA-FASS synaptosomes for the vesicular                      from CINs may also take part in this association.
inhibitory amino-acid transporter (VIAAT), which labels GABAer-
gic terminals arising from all inhibitory neurons of the striatum54.
EGFP+/VIAAT+ hub synaptosomes display almost 5-fold enrich-                  Spatial organization of dopaminergic synaptic hubs. We ana-
ment through DA-FASS (SYN: EGFP+/VIAAT+ = 4.1 ± 0.9%,                        lyzed the relative position of each marker to dopaminergic var-
DA-FASS: EGFP+/VIAAT+ = 18.8 ± 3.2%, N = 2 sorts, n = 9 and                  icosities (immunolabelled for EGFP, Th or DAT) by measuring the
n = 19 fields of view respectively, SYN-DA-FASS Šídák’s multiple              centre to centre distance with the other markers used above on the
comparison *p = 0.016; Fig. 5f), while the EGFP−/VIAAT+                      whole population of synaptosomes imaged by wide-field micro-
population is depleted more than 2-fold (SYN: EGFP−/VIAAT+ =                 scopy. Th is co-localized with EGFP and seen at an average distance
 68.2 ± 3.2 %, DA-FASS: EGFP−/VIAAT+ = 25.9 ± 1.9%, N = 2                    of 0.174 µm (0.174 ± 0.003 µm, n = 1175) close to the resolution of
sorts, n = 9 and n = 19 fields of view, respectively, SYN-DA-FASS             the epifluorescence setup (0.250 µm), while the most distant marker,
Šídák’s multiple comparison ****p < 0.0001; Fig. 5f). Hence,                 D1R, is apposed on average at 0.513 µm (0.513 ± 0.022 µm, n = 246)
GABAergic synaptosomes are associated with 26% of the                        from the EGFP+ centre (see Fig. 6a). Next to the dopaminergic
dopaminergic synaptosomes (19/(19 + 55) × 100; Fig. 5f).                     varicosity (285–300 nm), we find SynCAM 2 (0.285 ± 0.006 µm,
   Finally, striatal neuropils harbour a dense cholinergic innerva-          n = 949) and D2R (0.2982 ± 0.015 µm, n = 181). Slightly more dis-
tion by local CINs that function in tight interrelation with                 tant (318–408 nm), we find the presynaptic cholinergic transporter
dopaminergic signals55,56. In accordance, our proteome also                  VAChT (0.318 ± 0.017 µm, n = 151), the Glutamatergic transporter
displays a significant fraction of cholinergic markers that are kept
throughout DA-FASS (50 out 112 listed proteins; Fig. 5g grey
boxed text, Supplementary Tables 3 and 5). The beta2 nicotinic
receptor subunit (Chrnb2) is even significantly enriched (2.98-fold             Table 1 Observed versus simulated random associations of
enrichment measured in MS/MS, adjusted p-value *p = 0.048;                     immunolabeled markers.
Fig. 5g red boxed text, Supplementary Tables 3 and 5). Indeed, it
was shown to mediate cholinergic signalling onto dopaminergic                  Immunolabelling         Observed                 Simulated random
varicosities57. To confirm a physical binding of dopaminergic                                           associations (%)         associations (%)
varicosities with cholinergic ones, we probed for the Vesicular                EGFP+ VGLUT1+           20.8                     0.5
Acetyl Choline Transporter (VAChT). VAChT signals is occa-                     EGFP+ VGLUT2+            11.2                    0.5
sionally seen apposed to Th positive dots with a 6-fold increase               EGFP+ VIAAT+            18.8                     0.5
through DA-FASS enrichment (SYN: Th+/VAChT+ = 1.7 ± 0.4%,                      VGLUT1Venus+             5.5                     0.4
                                                                               VGLUT2+
DA-FASS: Th+/VAChT+ = 10.2 ± 0.7%, N = 3 and N = 2 sorts,
                                                                               VGLUT1Venus+ Th+        31.5                     0.5
n = 30 and n = 20 fields of view respectively, SYN-DA-FASS                      Th+ VAChT+              10.2                     0.5
Šídák’s multiple comparison **p = 0.001; Fig. 5h). Through DA-

10               NATURE COMMUNICATIONS | (2022)13:3102 | https://doi.org/10.1038/s41467-022-30776-9 | www.nature.com/naturecommunications
NATURE COMMUNICATIONS | https://doi.org/10.1038/s41467-022-30776-9 ARTICLE
a b c d
Distance to EGFP
center to center distance in µm 2.0 DAT SynCAM2 merged Th VAChT merged EGFP VGLUT1 merged
****pARTICLE NATURE COMMUNICATIONS | https://doi.org/10.1038/s41467-022-30776-9 of dopamine varicosities13. Here, we confirm that most VGLUT1- Bassoon = 1.38.105 ± 0.02.105 N = 3 sorts and n = 3609 particles; venus+ synaptosomes display Bassoon signal (VGLUT1Venus+/Bas- Th+/VGLUT1venus+: Bassoon = 2.06.105 ± 0.07.105 N = 3 sorts soon+ = 93.4 ± 0.4%, n = 4456, N = 4 sorts; Supplementary and n = 1206 particles; Th−/VGLUT1venus+-Th+/VGLUT1venus+ Fig. 6a), however, only 20% of Th+/ VGLUT1venus− elements ****p < 0.0001 Mann–Whitney test; Fig. 7d and Supplementary contained a Bassoon cluster (VGLUT1−/Th+ = 19.6 ± 3.7, n = 45, Fig. 6a). As Bassoon increase may be due to its presence within Th N = 3 sorts; Supplementary Fig. 6a). By measuring Bassoon signal varicosities, we quantified STED images to discriminate the origin intensity at VGLUT1 synapses in epifluorescence images, we find a of Bassoon signal in dopamine hub synapses. In hubs, we observe 1.5-fold higher bassoon signal in Th+/ VGLUT1venus+ compared to 60% of Th+ varicosities devoid of a Bassoon cluster (Hub_Th_V- Th−/ VGLUT1venus+ synaptosomes (Th−/VGLUT1venus+: GLUT1: Th+/Bassoon+ = 39.7 ± 4.1%, n = 84 synaptosomes, 12 NATURE COMMUNICATIONS | (2022)13:3102 | https://doi.org/10.1038/s41467-022-30776-9 | www.nature.com/naturecommunications
NATURE COMMUNICATIONS | https://doi.org/10.1038/s41467-022-30776-9 ARTICLE
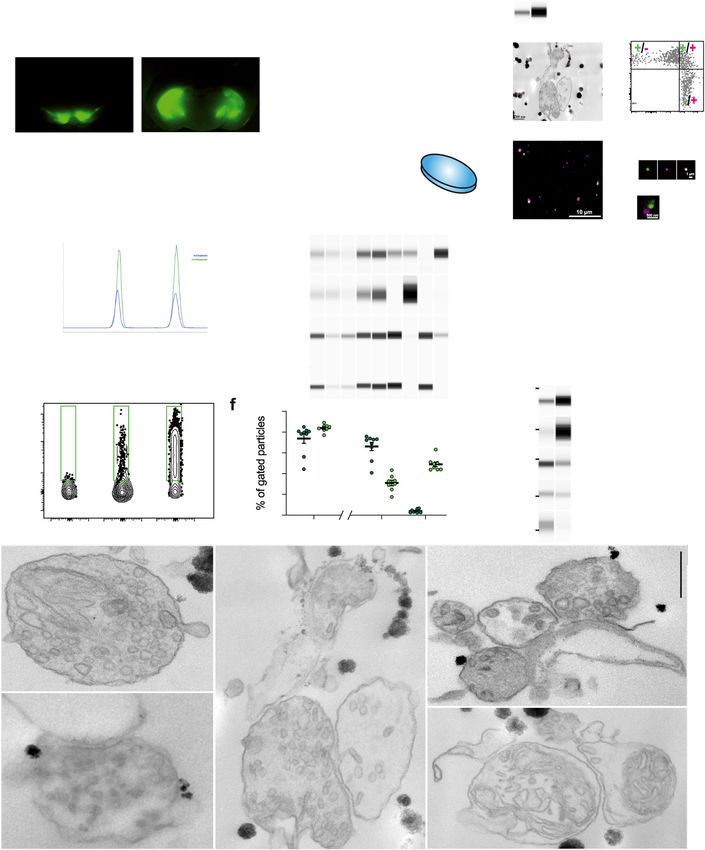
Fig. 7 Molecular remodeling at cortico-striatal dopamine hub synapse. a striatal VGLUT1-FASS. SYN show 14% of VGLUT1Venus+ synaptosome enriched
to 60.7% in VGLUT1-FASS. b Immunofluorescence population analysis of SYN and VGLUT1-FASS (mean ± SEM from N = 2 sorts (3 animals each) with
n = 9 to n = 10 fields of view per sort; Two-way ANOVA, VGLUT1Venus/Th: Interaction F2,111 = 47.14 ****p < 0.0001, Condition F1,111 = 0.003 p = 0.96,
Immunolabelling F2,111 = 15.54 ****p < 0.0001). Note that 41% of VGLUT1venus+ synaptosomes are dopamine hub synapses (41 = 32 / (32 + 45); examples
in d–h). c Immunoblot against VGLUT1Venus and Th. Averaged Th (grey) and VGLUT1Venus (orange) peak AUC (mean ± SEM from n = 3; Two-way
ANOVA, Th/ VGLUT1Venus: Interaction F1,8 = 4.757 p = 0.061, Protein F1,8 = 1.468 p = 0.26, Condition F1,8 = 2.656 p = 0.142); for uncropped
immunoblots see supplementary material or original data files in source data. d, f, g, h VGLUT1-FASS immunolabelled for VGLUT1Venus (green), Th (cyan),
and d Bassoon, f Homer1c, g PSD-95 and h synaptopodin (magenta). Comparison of Th+/VGLUT1venus+ hub synapse versus Th-/VGLUT1venus+ synapse
staining intensity (data represented as min/max, mean (red cross) and median (center line), N = 3; Two-tailed Mann–Whitney test) d VGLUT1Venus:
****p < 0.0001; Bassoon: ****p < 0.0001; f Homer1c: ****p < 0.0001; g PSD-95: ****p < 0.0001; h Synaptopodin: **p = 0.002; and Kolmogorov–Smirnov test
for CDF d VGLUT1Venus: ****p < 0.0001; Bassoon: ****p < 0.0001; f Homer1c: ****p < 0.0001; g PSD-95: ***p = 0.0004; h Synaptopodin: *p = 0.027.
e STED images of VGLUT1Venus/Th/Bassoon synaptosomes. Detection and quantification of Bassoon in Th varicosities of hubs (Mean ± SEM N = 3;
Mann–Whitney test, Bassoon: ****p < 0.0001). i Detection of Synaptopodin+ staining at dopamine hub synapses (Mean ± SEM N = 3; Two-way ANOVA,
VGLUT1Venus/Synaptopodin: Interaction F1,320 = 95.48 ****p < 0.0001, Condition F1,320 = 0.169 p = 0.682, Immunolabelling F1,320 = 326 ****p < 0.0001).
j Synaptomic model of VGLUT1 striatal synapses. 41% are VGLUT1 dopamine hub synapses. Dopamine hub synapses are remodeled as shown by an
increased intensity of VGLUT1, Bassoon, Homer1, Synaptopodin and a decrease of PSD-95 compared to regular VGLUT1 synapses. Scale bar = 1 μm.
Th+/Bassoon− = 60.3 ± 4.055, n = 82 synaptosomes; N = 3 sorts; through FASS purification in the striatum while we had
Fig. 7e). In the minority of Th+/Bassoon+ synapses, the Bassoon previously shown a strong depletion in forebrain samples27,64.
signal intensity represents only a quarter of that measured for In fact, Synpo is among the markers seen specifically enriched in
Bassoon within VGLUT1Venus+ synaptosomes (Hub_Th_VGLUT1; the striatum in mass spectrometry compared to other brain
In Th: Bassoon = 0.65.105 ± 0.07.105, n = 84 synaptosomes, In regions32. In our LC-MS/MS screen, Synpo is unchanged after
VGLUT1Venus: Bassoon = 2.55.105 ± 0.25.105, n = 82 synaptosomes, FASS (abundance ratio of 1 with 17 unique peptides, adjusted p-
N = 3 sorts; Th-VGLUT1Venus ****p < 0.0001 Mann–Whitney; value p = 1; Supplementary Table 3), a trend we confirm with
Fig. 7e). Hence, we conclude that most of the increase of Bassoon immunofluorescence probing Synpo on DA-FASS samples
signal at dopamine hub synapses is occurring within the VGLUT1 (Supplementary Fig. 6b). In the triple staining experiment with
terminals under the influence of dopaminergic innervation. RIM1 is VGLUT1-FASS, Synpo signals are apposed to VGLUT1 positive
another active zone scaffold protein which is essential for dopamine dots more frequently when Th+ varicosities are present
release13. We monitored the presence of RIM1 at Th+ varicosities of (VGLUT1-FASS: VGLUT1Venus+/Synpo+/Th+ = 43.2 ± 1.6%,
synaptic hubs. Indeed, we confirm the presence of RIM1 in 70% of n = 81 particles; VGLUT1Venus+/Synpo+/Th− = 30.2 ± 0.9%,
Th+ varicosities (Th+/RIM1+ 69.7 ± 4.3, Th+/RIM1− 30.3 ± 4.3 n = 81 particles, N = 3 sorts; VGLUT1Venus+/Synaptopodin+/
n = 73, N = 3 sorts; Supplementary Fig. 6c) with a lower intensity Th+-VGLUT1Venus+/Synaptopodin+/Th− Šídák’s multiple com-
than in neighbouring VGLUT1 boutons (Hub_Th_VGLUT1; In Th: parison ****p < 0.0001; Fig. 7i).
RIM1 = 0.32 ± 0.03.105, n = 73, In VGLUT1: RIM1 = 2.55.105 Finally, we propose a model that summarizes our findings
± 0.25.105, n = 74, N = 3 independent sorts; RIM1 in Th-RIM1 in regarding dopamine hub synapses involving VGLUT1 (Fig. 7j).
VGLUT1 Mann–Whitney test ***p = 0.0009; Supplementary Altogether, our results show that a selective set of markers of SV
Fig. 6c). cluster, active zone, postsynaptic density and spine apparatus at
We then focused on postsynaptic proteins. Homer1c is a VGLUT1 synapses on SPNs display a significant increase upon
calcium-binding scaffold protein important for metabotropic innervation by dopaminergic varicosities. This observation
glutamate receptor signalling60. We find higher Homer1c signal strengthens the notion that dopamine hub synapses represent a
in Th+/VGLUT1Venus+ compared to Th−/VGLUT1Venus+ mechanically resilient functional structure.
synaptosomes (Th+/VGLUT1Venus+: Homer1c = 0.55.105 ±
0.01.105 n = 1877 particles; Th−/VGLUT1Venus+: Homer1c =
Discussion
0.65.105 ± 0.01.105, n = 1536 particles, N = 3 independent sorts;
To unravel specific molecular and cellular features of mod-
Th+/VGLUT1Venus+-Th−/VGLUT1Venus+ ****p < 0.0001
ulatory neurotransmission, we targeted the dopaminergic pro-
Mann–Whitney; Fig. 7f). In contrast, we find that the signal for
jection from the substantia nigra and ventral tegmental area to
PSD-95, a major postsynaptic density scaffold61, is slightly
the striatum using FASS18,27. Specificity for dopaminergic
decreased in Th+/VGLUT1Venus+ compared to Th−/VGLUT1-
synaptosomes was validated by the enrichment for presynaptic
Venus+ synaptosomes (Th−/VGLUT1Venus+: PSD-95 = dopaminergic markers as well as the adhesion of dopaminergic
0.22.105 ± 0.005.105, n = 2232 particles; Th+/VGLUT1Venus+: varicosities to postsynaptic elements containing either D1R or
PSD-95 = 0.20.105 ± 0.006.105, n = 1533 particles, N = 3 sorts; D2R. We produced a proteome with proteins significantly
Th-/VGLUT1Venus+-Th+/VGLUT1Venus+ ****p < 0.0001 enriched through DA-FASS purification and validated the
Mann–Whitney; Fig. 7g). To further characterize the postsynaptic enrichment and localization of 6 of them. We show the asso-
compartment, we labelled Synaptopodin (Synpo) a marker of the ciation of dopaminergic synapses with glutamatergic,
spine apparatus62. The spine apparatus and Synpo are found at a GABAergic and cholinergic synapses in “dopamine hub
minority of spines in the forebrain and is thought to be involved synapses” that connect tightly several synapses together.
in structural plasticity63. Synpo is increased almost two-fold at Th Finally, we observed that innervation of glutamatergic synapses
+/VGLUT1Venus+ compared to Th−/VGLUT1Venus+ synapto-
by dopaminergic varicosities correlates with a molecular
somes (Th−/VGLUT1Venus+: Synpo = 2.14.105 ± 0.06.105, n = strengthening of the whole synapse.
1528 particles; Th+/VGLUT1Venus+: Synpo = 3.83.105 ± 0.37.105
n = 725 particles, N = 3 sorts; Th−/VGLUT1Venus+-Th
+/VGLUT1Venus+ **p = 0.002 Mann–Whitney; Fig. 7h). Surpris- A proteome of dopaminergic synapses in the striatum. The
ingly, we also observe that Synpo is relatively well maintained molecular characterization of FASS dopaminergic synaptosomes
NATURE COMMUNICATIONS | (2022)13:3102 | https://doi.org/10.1038/s41467-022-30776-9 | www.nature.com/naturecommunications 13ARTICLE NATURE COMMUNICATIONS | https://doi.org/10.1038/s41467-022-30776-9 quantified 2653 proteins between unsorted synaptosomes and related to this inhibitory phenotype. Finally, a combination of DA-FASS samples. Sixty three proteins are significantly depleted synaptic adhesion molecules is certainly involved and further through DA-FASS while 57 proteins are found strongly enriched. investigations will be important to clarify the complete machinery Hence, most proteins are kept in the process. This may be responsible for dopaminergic hub synapse formation and attributed on the one hand to the relative low purity of our DA- maintenance80. FASS samples until now (more than 40% of EGFP- singlets are left after sorting according to reanalysis, Figs. 1 and 3), and on the other hand, to the existence of dopamine hub synapses with most Cellular organization of dopaminergic projections to the other neuronal partners involved in striatal networks. Yet, the striatum. The nature of dopaminergic synaptic structures is the enrichment factor for dopaminergic synaptosomes is quite high topic of a long-standing debate. Previous anatomical investiga- (between 5- and 10-fold), allowing the detection of proteins tions identified that the distribution of dopamine varicosities in selectively targeted to dopamine hub synapses. We identify sev- the neuropil is biased toward proximity to glutamatergic or eral canonical proteins of dopamine synapses as highly enriched GABAergic synapses, but only a minority were shown to make (DAT, VMAT2, Th for instance). D1Rs are not enriched, which synapses with a target structure in the striatum4,5,8. However, corresponds with the presence of D1R on both synaptic and other authors reported a frequent occurrence of symmetrical extra-synaptic compartments30,65. The D2R protein escaped MS/ synaptic contacts of dopaminergic thin axonal portions with MS detection, which is likely due to the instability of the receptor SPNs spines or dendritic shafts9,81–83. Our current dataset in SDS denaturation buffer. With the validation of six targets strongly advocates for specific and frequent adhesion of dopa- using immunofluorescence assay, we show that our screen quality minergic axonal varicosities with target structures (Figs. 1h–l is high even for proteins with a low enrichment factor-like Cpne7 and 2). Indeed, around 50% of our EGFP+ varicosities displayed (Fig. 4). Some proteins are likely to populate presynapses of the apposed D1R, while ~80% displayed D2R labelling (Fig. 2). This hub partners (Cpne7, Mint-1/Apba1, Cadps2, Cadm2/SynCAM is in accordance with SPNs being the main target of dopamine 2, Mgll) while Stx4 is more likely a postsynaptic protein based on terminals in the striatum, with roughly half of the SPNs the expression profile of the mRNA35 and in accordance with the expressing D1 receptors, while the D2 receptor is expressed by previous publications41,44,46,47,49. The immunofluorescence ana- the other half31,84 as well as by dopaminergic and other lysis of Stx4 expression confirmed a postsynaptic location distant presynapses30,85,86. to dopaminergic varicosity and most likely at glutamatergic Moreover, our data reveal that adhesion at dopaminergic spines that represent around 45% of hubs (Figs. 4–6). Cpne7, varicosity extends to synaptic hubs with glutamatergic and Mint-1/Apba1, Cadps2 and Stx4 point to specific membrane GABAergic synapses. We find that around a third of dopami- trafficking features at dopamine hub synapses37,41,43,47. nergic varicosities make hub synapses with putative cortico- The cross-analysis of our screen with single-cell RNA striatal VGLUT1 synapses, around 12% associate with putative sequencing data allowed us to spot the synaptic adhesion protein thalamo-striatal VGLUT2 synapses, and more than a quarter is SynCAM 2/Cadm2 (Fig. 3 and Supplementary Fig. 3) as a associated with putative VIAAT inhibitory synapses (Figs. 5 and potentially important player of adhesion at dopaminergic 6h). Additionally, around 14% are also contacted by cholinergic varicosities45,66,67. The immunofluorescence data confirm the inputs. Conversely, 41% of VGLUT1 striatal synaptosomes are strong expression of SynCAM 2 at dopaminergic varicosities contacted by a Th+ input (32/(32 + 45) × 100 = 41%; Fig. 7b, j). (Figs. 4e, 6a, b, g). SynCAM 2 was also reported to label axons68. VGLUT1 and VGLUT2 synaptosomes display little to no Therefore, we propose that SynCAM 2 is part of an axonal association when probed from a striatal sorting from VGLUT1- adhesion complex responsible for the formation of dopaminergic venus mice (Supplementary Fig. 5f, g). Also, little documentation synapses and hub synapses with SPNs. SynCAM 2 is thought to exists supporting a GABAergic innervation on spines of SPNs8,31. engage in heterophilic interactions with SynCAM 1 or 445,46. Hence, little overlap may exist between those hub associations, Interestingly, SynCAM 1 is involved in cocaine-induced synaptic and up to around 80% of dopaminergic varicosities may adhere to plasticity in the striatum69 and SynCAM 2 is implicated in food hub synapses rather than conventional bipartite symmetric intake and energy balance70, two phenomena directly related to synapses. According to the literature, cholinergic inputs to these the integrity of the dopaminergic system71,72. Besides, SynCAM 1 hubs may target dopaminergic varicosities55,57. Further investiga- is thought to be preferentially acting at the postsynapses to induce tions will be required to characterize this in detail. As we show presynaptic adhesion73,74. Hence, SynCAM 1 and 2 are strong that most of the cytosolic content of dopaminergic axons is candidates to mediate adhesion through heterophilic interaction engulfed in synaptosomes (Fig. 1b–d), we propose that most at dopamine synapses, in addition to their roles at other types of dopaminergic presynapses are associated with hub synapses, synapses. while a small minority is not bound to any target cell in the tissue. A previous contribution suggested that adhesion at dopami- Such a high occurrence of synaptic hubs may explain previous nergic synapses occurs through neuroligin 2 (Nlgn2)75. Even observations that striatal dopaminergic synaptosomes sediment though we detected all four neuroligins and all three neurexins in faster than other synaptosomes in a linear sucrose gradient87. At our proteomic analysis, none of them displayed a specific the ultrastructural level, synaptic hubs are composed of electron- enrichment through DA-FASS. Also, Nlgn2 mRNA is not dense terminals containing many SV profiles associated with clear enriched in SPNs35. Thus, Nlgn2 did not appear to us as a varicosities much less populated with SVs (Fig. 1f, h). This is in putative major player in dopamine hub synapses compared to accordance with previous work stating that dopaminergic SynCAM 235. Nlgn2 action is preeminent at inhibitory terminals are less populated with SVs and appear less dense to synapses76,77. To our knowledge, there is no record for the electrons5,81,83. expression of Nlgn2 on spines or terminals of excitatory synapses Further investigations will be necessary to unravel whether which would be required in the context of dopamine hub synaptic hub formation is a structural invariant common to all synapses with excitatory inputs77. One possible explanation could sub-divisions of the striatum and whether the proportion of be that Nlgn2 plays a role in the association with inhibitory dopamine hub synapses of different kinds can vary depending on synapses in the context of synaptic hubs. Also, some findings subregions and/or physiological states. The existence of hub suggest a direct inhibitory function of dopamine projection on synapses in other structures and modulatory inputs is an open SPNs through GABA signalling78,79. Nlgn2 may have a function question. 14 NATURE COMMUNICATIONS | (2022)13:3102 | https://doi.org/10.1038/s41467-022-30776-9 | www.nature.com/naturecommunications
You can also read