Opportunistic Rain Rate Estimation from Measurements of Satellite Downlink Attenuation: A Survey

Page created by Herman Myers
 
CONTINUE READING
Opportunistic Rain Rate Estimation from Measurements of Satellite Downlink Attenuation: A Survey
sensors
Review
Opportunistic Rain Rate Estimation from Measurements of
Satellite Downlink Attenuation: A Survey
Filippo Giannetti *               and Ruggero Reggiannini

                                          Dipartimento di Ingegneria dell’Informazione, University of Pisa, 56122 Pisa, Italy; ruggero.reggiannini@unipi.it
                                          * Correspondence: filippo.giannetti@unipi.it; Tel.: +39-050-2217-548

                                          Abstract: Recent years have witnessed a growing interest in techniques and systems for rainfall
                                          surveillance on regional scale, with increasingly stringent requirements in terms of the following:
                                          (i) accuracy of rainfall rate measurements, (ii) adequate density of sensors over the territory, (iii) space-
                                          time continuity and completeness of data and (iv) capability to elaborate rainfall maps in near real
                                          time. The devices deployed to monitor the precipitation fields are traditionally networks of rain
                                          gauges distributed throughout the territory, along with weather radars and satellite remote sensors
                                          operating in the optical or infrared band, none of which, however, are suitable for full compliance
                                          to all of the requirements cited above. More recently, a different approach to rain rate estimation
                                          techniques has been proposed and investigated, based on the measurement of the attenuation
                                          induced by rain on signals of pre-existing radio networks either in terrestrial links, e.g., the backhaul
                                          connections in cellular networks, or in satellite-to-earth links and, among the latter, notably those
                                          between geostationary broadcast satellites and domestic subscriber terminals in the Ku and Ka
                                          bands. Knowledge of the above rain-induced attenuation permits the retrieval of the corresponding
                                          rain intensity provided that a number of meteorological and geometric parameters are known and
                                ultimately permits estimating the rain rate locally at the receiver site. In this survey paper, we
         
                                          specifically focus on such a type of “opportunistic” systems for rain field monitoring, which appear
Citation: Giannetti, F.; Reggiannini,
                                          very promising in view of the wide diffusion over the territory of low-cost domestic terminals for
R. Opportunistic Rain Rate
                                          the reception of satellite signals, prospectively allowing for a considerable geographical capillarity
Estimation from Measurements of
Satellite Downlink Attenuation: A
                                          in the distribution of sensors, at least in more densely populated areas. The purpose of the paper
Survey. Sensors 2021, 21, 5872.           is to present a broad albeit synthetic overview of the numerous issues inherent in the above rain
https://doi.org/10.3390/s21175872         monitoring approach, along with a number of solutions and algorithms proposed in the literature
                                          in recent years, and ultimately to provide an exhaustive account of the current state of the art.
Academic Editor: Carmine Serio            Initially, the main relevant aspects of the satellite link are reviewed, including those related to satellite
                                          dynamics, frequency bands, signal formats, propagation channel and radio link geometry, all of
Received: 22 July 2021                    which have a role in rainfall rate estimation algorithms. We discuss the impact of all these factors on
Accepted: 29 August 2021                  rain estimation accuracy while also highlighting the substantial differences inherent in this approach
Published: 31 August 2021
                                          in comparison with traditional rain monitoring techniques. We also review the basic formulas relating
                                          rain rate intensity to a variation of the received signal level or of the signal-to-noise ratio. Furthermore,
Publisher’s Note: MDPI stays neutral
                                          we present a comprehensive literature survey of the main research issues for the aforementioned
with regard to jurisdictional claims in
                                          scenario and provide a brief outline of the algorithms proposed for their solution, highlighting their
published maps and institutional affil-
                                          points of strength and weakness. The paper includes an extensive list of bibliographic references
iations.
                                          from which the material presented herein was taken.

                                          Keywords: rainfall rate; rain attenuation; satellite downlink; opportunistic satellite measurements

Copyright: © 2021 by the authors.
Licensee MDPI, Basel, Switzerland.
This article is an open access article
                                          1. Introduction
distributed under the terms and
conditions of the Creative Commons             Real-time monitoring of atmospheric precipitations over a regional territory is an
Attribution (CC BY) license (https://     objective of primary importance for public administrators to be pursued in the context
creativecommons.org/licenses/by/          of prevention policies aimed at ensuring an adequate level of safety for people living or
4.0/).                                    working in the area ([1–6], just to cite a few). In the above perspective, it is of interest to

Sensors 2021, 21, 5872. https://doi.org/10.3390/s21175872                                                      https://www.mdpi.com/journal/sensors
Opportunistic Rain Rate Estimation from Measurements of Satellite Downlink Attenuation: A Survey
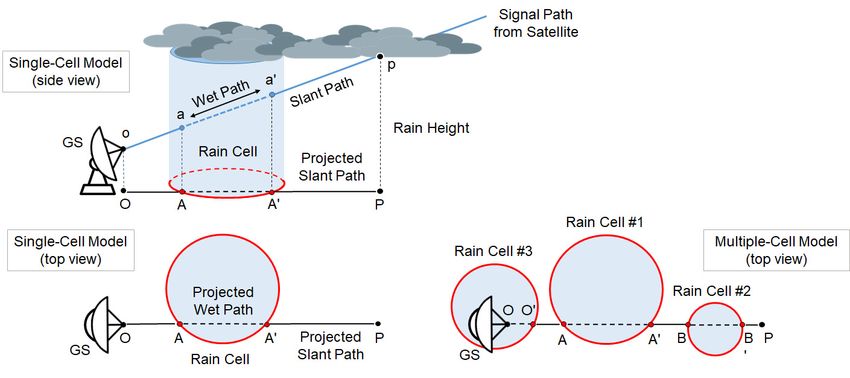
Sensors 2021, 21, 5872                                                                                             2 of 33

                         have updated rainfall maps constantly available that feature (i) good accuracy in rainfall
                         rate (RR) measurements, (ii) space-time completeness and continuity and (iii) negligible
                         delays in rain data provisioning so as to allow timely prediction of the rainfall distribution
                         for any incumbent meteorological event and, when required, early adoption of adequate
                         countermeasures to prevent or reduce the related risk.
                                The tools traditionally available for the estimation/prediction of rain maps belong to
                         three categories, namely (i) a set of rain gauges distributed throughout the territory and
                         connected to a real-time data collection network, (ii) a network of meteorological radars,
                         (iii) deployment of weather satellites (typically geostationary, such as Meteosat satellites)
                         for remote sensing of cloud formations and whether perturbations. However, each of these
                         methods taken individually is not able to fully satisfy the aforementioned requirements,
                         and their joint use for a really pervasive coverage of an entire vast region would entail
                         formidable costs for the provisioning and deployment of (notably radar) sensors and for
                         the infrastructure required for their integration and coordination [6–8].
                                More recently, additional “opportunistic” methods have been proposed for estimating
                         the RR, which exploit the existence of radio links distributed throughout the area, even
                         if installed for other purposes. Basically, these systems are of two types: (i) service or
                         ancillary terrestrial radio links, e.g., for cellular mobile networks (specifically, backhaul
                         links from the radio access nodes to infrastructure [9–11]) or those used in other fixed ter-
                         restrial networks [2,12] and (ii) radio links operating between satellites and fixed terrestrial
                         terminals distributed throughout the territory, notably for satellite-to-home TV broadcast
                         services provided to domestic subscribers (e.g., [1,3,4,6,13,14]).
                                The idea behind all these techniques is to measure the global attenuation introduced
                         by the rain on the received signal, which is an integral function of the rainfall distribution
                         along the radio path [15], and subsequently attempt to trace the value of RR producing this
                         attenuation at all points of the link by means of specific inversion algorithms.
                                In the case of terrestrial radio links, this usually results in the use of tomographic
                         techniques that allow estimating the rain field at a generic geographical site starting from
                         attenuation measurements collected from different radio links that intersect one another
                         within the vicinity of the site [16]. The resulting estimation accuracy depends on number,
                         density and variety of directions of the available radio paths.
                                On the other hand, in the case of a satellite link where the radio path segment affected
                         by the rain is very short and adjacent to the terrestrial terminal, it is often possible to
                         achieve a relatively accurate estimate of the RR in proximity to the terrestrial receiver with
                         a very simple inversion algorithm directly mapping the measured attenuation onto the RR
                         estimate. These latter techniques are of particular interest since they allow carrying out
                         as many measurements of RR over the territory as there are usable terminals. Therefore,
                         in the presence of a large population of resident subscribers, they could prospectively
                         offer a vast and capillary coverage of the region. For this reason, they have been the
                         subject of considerable attention in the last couple of decades, and although initially they
                         might have been viewed as support systems or gap fillers for preexisting rain monitor-
                         ing infrastructures, later on they have been considered as a viable low-cost stand-alone
                         measurement alternative.
                                With reference only to systems using satellites for RR estimation, which is the focus of
                         this paper, a host of solutions have been proposed and analyzed that differ from each other
                         based on the criteria used to define the numerous subsystems and parameters involved in
                         the estimation procedure. The first to be considered here is the type of opportunistic target
                         satellite, which obviously impacts the receiving antenna design and may require additional
                         hardware to track the satellite position. Currently, the most mature technology in the field
                         of opportunistic RR estimation from satellite signals relies on geostationary orbit (GEO)
                         satellites (i.e., placed on a circular orbit laying on the equatorial plane, approximately at
                         35,800 km above the Earth surface). Recently, the use of Low-Earth Orbit (LEO) satellites
                         (i.e., moving on variously-inclined circular orbits at 160–2000 km above the Earth surface,
                         typically arranged in constellations) was proposed as well [17,18]. Among the various
Opportunistic Rain Rate Estimation from Measurements of Satellite Downlink Attenuation: A Survey
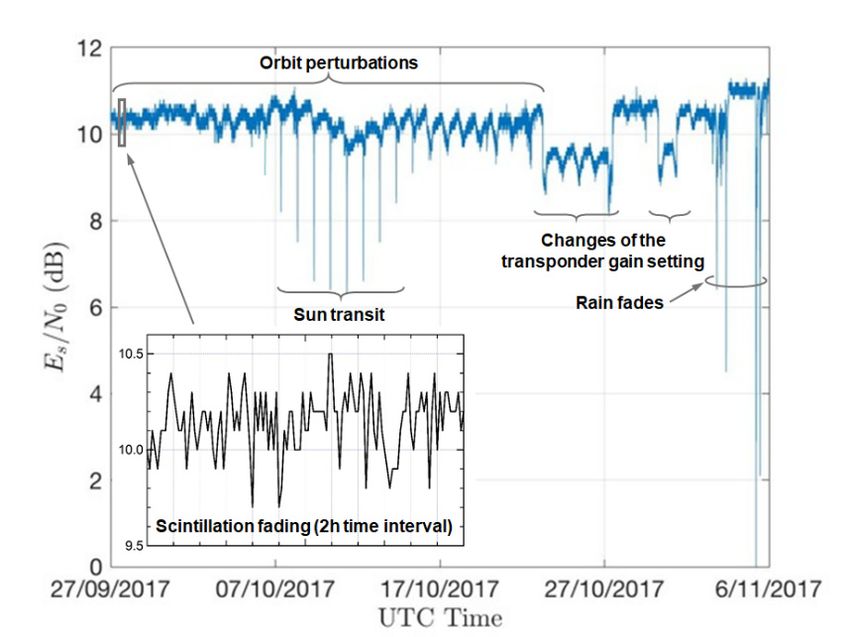
Sensors 2021, 21, 5872                                                                                               3 of 33

                         other aspects to be carefully considered in the RR estimator design, we mention (i) the
                         choice of the operating frequency, impacting the sensitivity of the receiver to rain; (ii) the
                         choice of the rain-sensitive parameter, i.e., subject to a variation in the presence of rain, to
                         be extracted from the received waveform (either the received signal power or the signal-
                         to-noise ratio); (iii) the selection and cost evaluation of the receiving hardware, either
                         available commercially off-the-shelf or requiring a dedicated implementation; (iv) the
                         development of the processing algorithm to be applied to measurements; (v) the retrieval
                         of auxiliary information relating to the radio link geometry; (vi) the retrieval of climatic
                         and meteorological data involved in the RR estimation algorithm; and (vii) methods to
                         build rain maps, etc.
                               In this paper, we attempt to sort and classify the huge amount of material available
                         in the literature on the above topics. We present, on the one side, a comprehensive
                         overview of the main inherent issues to be dealt with, and we review and discuss the
                         techniques proposed for their solution on the other side, highlighting their points of
                         strength and weakness.
                               The paper is organized as follows. Initially (Section 2), the basic concepts of satellite
                         radio communications are reviewed with particular reference to geostationary satellites,
                         by far the most commonly used for opportunistic RR measurements, and the link budget
                         equations are recalled for the frequency ranges used in the downlink. In Section 3, we
                         review the various impairment factors that can reduce the received signal level in addition
                         to the free-space loss initially (Section 3.1) in the absence of precipitations, with regard to the
                         phenomena occurring in the propagation through the ionosphere and troposphere, and also
                         considering the effect of station keeping maneuvers and pointing errors of the terrestrial
                         antenna. Next (Section 3.2), we discuss some models used to predict the attenuation
                         introduced by stratiform rain both in the melting layer and in the liquid layer, highlighting
                         how the specific attenuation affecting the signal is related to the RR. In Section 4, we review
                         the techniques used to measure the attenuation introduced by rain on the received signal
                         and the elaborations needed to estimate the RR. Specifically, two widely used techniques
                         are compared and discussed, the first based on the measurement of the satellite beacon
                         level and the other on the evaluation of the signal-to-noise ratio of a digital payload
                         signal. Furthermore, the analytical tools used to obtain the RR estimate from the measured
                         attenuation are reviewed, also discussing the impact of the precipitation model and the
                         possible non-uniformity of rain on the radio path. The substantial differences inherent in
                         this approach in comparison with traditional rain monitoring techniques are also addressed.
                         Subsequently, in Section 5 we provide an extensive survey of the techniques proposed
                         in the literature for the estimation of the RR, based on measurements of attenuation of
                         a satellite signal. The presentation is organized by sequentially addressing each of the
                         issues inherent in this application, as pointed out above, and by briefly illustrating how the
                         various authors deal with them and propose tailored solutions. Finally, Section 6 concludes
                         the paper. An extensive list of bibliographic references is included from which the material
                         presented herein was taken.

                         2. Review of Satellite Radio Links
                              In this paper, we consider the monitoring and utilization of the downlink signals
                         from telecommunication satellites to fixed terrestrial receiving stations, also termed here
                         as ground stations (GSs). The goal is the opportunistic estimation of the RR via signal
                         attenuation measurements. Since rain attenuation significantly affects microwave satellite
                         communication at frequencies above 10 GHz, we will focus our attention on satellite
                         services in the Ku band and above. These bands are assigned to direct-to-home (DTH)
                         television (TV) broadcast from GEO satellites and also to two-way broadband services,
                         either with GEO or LEO satellites. The frequency bands allocated to these services, with
                         reference to ITU Region 1, are illustrated in Table 1.
Opportunistic Rain Rate Estimation from Measurements of Satellite Downlink Attenuation: A Survey
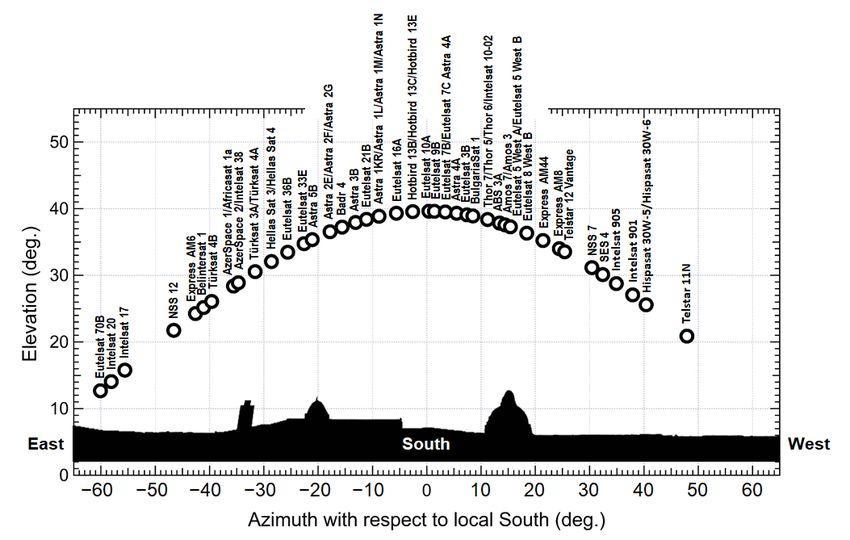
Sensors 2021, 21, 5872                                                                                                        4 of 36
Sensors 2021, 21, 5872                                                                                                           4 of 33

                         Table 1. Frequency bands for the downlink of communication satellites above 10 GHz (ITU Region 1).

                         Band1. Frequency
                         Table  Frequency   (GHz)
                                          bands                      Service
                                                for the downlink of communication             Direction
                                                                                  satellites above 10 GHz (ITURef.
                                                                                                               Region 1).
                                                              Space-to-Earth, Fixed-Satellite:
                           Ku
                            Band       10.70–12.75
                                       Frequency (GHz)                      Service                    downlink
                                                                                                          Direction       [19]Ref.
                                                               Broadcasting-satellite service
                                                                 Space-to-Earth,
                                                              Space-to-Earth,    Fixed-Satellite:
                                                                              Fixed-Satellite:
                              Ku           10.70–12.75                                                      downlink          [19]
                           Ka          17.30–20.20                Broadcasting-satellite service       downlink           [20]
                                                                Broadband   satellite
                                                                 Space-to-Earth,      service
                                                                                 Fixed-Satellite:
                              Ka           17.30–20.20        Space-to-Earth, Fixed-Satellite:              downlink          [20]
                                                                   Broadband satellite  service
                           Ka          21.40–22.00                                                     downlink           [21]
                                                                 Space-to-Earth, Fixed-Satellite:
                                                               Broadcasting-satellite   service
                              Ka           21.40–22.00                                                      downlink          [21]
                                                                  Broadcasting-satellite
                                                              Space-to-Earth,            service
                                                                              Fixed-Satellite:
                          Q/V          37.50–43.50               Space-to-Earth, Fixed-Satellite:      downlink           [22]
                             Q/V           37.50–43.50          Broadband   satellite service
                                                                   Broadband satellite service
                                                                                                            downlink          [22]

                         2.1. A Simple Geometrical Model of the Satellite Link through the Troposphere
                          2.1. A Simple Geometrical Model of the Satellite Link through the Troposphere
                               The downlink from a satellite to a GS in the presence of rain is shown in schematic
                                The downlink from a satellite to a GS in the presence of rain is shown in schematic
                         form in Figure 1, where we assume stratiform precipitation. For now, we also assume a
                          form in Figure 1, where we assume stratiform precipitation. For now, we also assume a clear
                         clear separation between two layers (tropospheric models with more layers will be
                          separation between two layers (tropospheric models with more layers will be addressed
                         addressed later). The upper layer, named “ice particles layer” (IPL), is mostly made of ice
                          later). The upper layer, named “ice particles layer” (IPL), is mostly made of ice in the form
                         in the form of frozen dry particles, which exhibit very low scattering cross sections. This
                          of frozen dry particles, which exhibit very low scattering cross sections. This region is,
                         region is, therefore, associated with very small specific attenuations [23], and in the
                          therefore, associated with very small specific attenuations [23], and in the following its
                         following its contribution to the attenuation of the satellite signal will be neglected. The
                          contribution to the attenuation of the satellite signal will be neglected. The lower layer,
                         lower layer, named “liquid layer” (LL), is instead characterized by the presence of the
                          named “liquid layer” (LL), is instead characterized by the presence of the liquid-phase
                         liquid-phase
                          precipitationprecipitation
                                         originated byoriginated   by that
                                                        ice particles  ice particles   that are
                                                                             are completely      completely
                                                                                              melted           melted into
                                                                                                        into raindrops  and
                         raindrops   and  introduces significant excess   attenuation   on  the satellite signal.
                          introduces significant excess attenuation on the satellite signal. In such a simplified In such a
                                                                                                                      model,
                         simplified   model,  the boundary   between   the   two  layers, where   the  rain originates,
                          the boundary between the two layers, where the rain originates, has height h R and is         has
                         height
                          assumed hR coincident
                                      and is assumed  coincident
                                                with the         with
                                                         height of      0 ◦ Cheight
                                                                   the the          of thedenoted
                                                                              isotherm,            as h0 . denoted as h0 .
                                                                                           0 °C isotherm,

                         Figure
                          Figure1.1.Satellite downlink
                                      Satellite        geometry
                                                downlink        in the
                                                          geometry  in presence of stratiform
                                                                       the presence            rain and
                                                                                      of stratiform     two-layer
                                                                                                     rain         tropospheric
                                                                                                          and two-layer  tropo-
                         model.
                          spheric model.

                                TheGS
                               The    GSisis located
                                              located at
                                                      at an  altitude hhS above
                                                         an altitude                 mean sea level (MSL) and sees the satellite at
                                                                           S above mean sea level (MSL) and sees the satellite
                          an elevation angle θ above the horizon. The final part of the slanted electromagnetic path
                         at an elevation angle θ above the horizon. The final part of the slanted electromagnetic
                          crosses the LL along a segment of length LS , named the “wet segment”. For a given setting
                         path  crosses
                          of the         the LL along
                                  link parameters,     thea rain
                                                            segment      of length
                                                                   introduces         LS , named the
                                                                                 an attenuation        “wet
                                                                                                   in an     segment”.
                                                                                                         extent           For a given
                                                                                                                 that depends    on LS
                         setting
                          and onof    the
                                    the    link parameters,
                                        distribution            the rain
                                                       of the rain    fieldintroduces    an attenuation
                                                                             along the wet    segment. Ifin ansatellite
                                                                                                          the   extent that
                                                                                                                        is ofdepends
                                                                                                                              the GEO
                         on   LS itand
                          type,     is observed    by the terrestrial
                                        on the distribution       of thereceiver
                                                                          rain fieldunder
                                                                                      along fixed
                                                                                              the azimuth/elevation
                                                                                                  wet segment. If the (AzEl)    angles,
                                                                                                                        satellite is of
                          and  the   wet  path   segment    also   has  a fixed   direction   with respect to a
                         the GEO type, it is observed by the terrestrial receiver under fixed azimuth/elevation terrestrial  reference.
                          Therefore,
                         (AzEl)         the and
                                   angles,     measurement
                                                   the wet path of the   rain attenuation
                                                                      segment      also has aexperienced     by the
                                                                                                fixed direction      received
                                                                                                                  with   respectsignal
                                                                                                                                  to a
                          provides    an  integral  metric   of  the  rain  field along   the  wet segment.  Under
                         terrestrial reference. Therefore, the measurement of the rain attenuation experienced       the  assumptionby
                          that the rain field is approximately constant along the wet segment (as supposed in many
                         the received signal provides an integral metric of the rain field along the wet segment.
                          of the works available in the literature on the subject), the local value of the rain rate (RR) at
                         Under the assumption that the rain field is approximately constant along the wet segment
                          the receiver location can be obtained from the measurement of the attenuation, regardless
Opportunistic Rain Rate Estimation from Measurements of Satellite Downlink Attenuation: A Survey
Sensors 2021, 21, 5872                                                                                                                  5 of 36

Sensors 2021, 21, 5872                                                                                                                   5 of 33
                                  (as supposed in many of the works available in the literature on the subject), the local
                                  value of the rain rate (RR) at the receiver location can be obtained from the measurement
                                  of the attenuation, regardless of the satellite position, provided that the length of the wet
                                  of the satellite position, provided that the length of the wet segments and the mapping
                                  segments and the mapping laws between specific attenuation and RR are known (see
                                  laws between specific attenuation and RR are known (see Section 3.2 for details). If the
                                  Section 3.2 for details). If the assumption about the constant value of the rain field on the
                                  assumption about the constant value of the rain field on the wet segment does not hold,
                                  wet segment does not hold, measuring the attenuation affecting the downlink signal from
                                  measuring the attenuation affecting the downlink signal from a GEO satellite no longer
                                  a GEO satellite no longer allows achieving a fully reliable estimate for the point-scale
                                  allows achieving a fully reliable estimate for the point-scale value of RR. In this case, an
                                  value  of RR.
                                  alternative     In this case,
                                               approach            an alternative
                                                             commonly       pursuedapproach       commonly
                                                                                       in the literature          pursued
                                                                                                           consists          in the literature
                                                                                                                       in measuring      (either
                                  consists  in measuring
                                  simultaneously              (either simultaneously
                                                      or sequentially)     the attenuation or sequentially)
                                                                                              undergone bythe        attenuation
                                                                                                                  different  signalsundergone
                                                                                                                                       arriving
                                  by
                                  fromdifferent  signals arriving
                                        several satellites            from
                                                             that are in      several
                                                                         visibility     satellites
                                                                                     relative       that
                                                                                               to the     are in visibility
                                                                                                       geostationary     arc atrelative
                                                                                                                                differenttoAzEl
                                                                                                                                             the
                                  geostationary     arc  at   different   AzEl    angles.   In  this   manner,      the
                                  angles. In this manner, the corresponding wet segments intersect the rain field along acorresponding       wet
                                  segments
                                  wide        intersect
                                        variety           the rain
                                                 of directions,   andfield   along a wide
                                                                       tomographic            variety
                                                                                        techniques       of directions,
                                                                                                      could,                and tomographic
                                                                                                               thus, be proficiently    applied
                                  techniques
                                  for estimating the rain field. Table 2 enumerates all of the GEO satellitesfield.
                                                could,   thus,   be  proficiently    applied    for  estimating      the  rain   for DTHTableTV2
                                  enumerates
                                  broadcastingallinofthe
                                                       theKu GEO   satellites
                                                                band  that havefor DTH    TVone
                                                                                    at least  broadcasting
                                                                                                   beam coveringin the the
                                                                                                                        Ku band
                                                                                                                            city ofthat have
                                                                                                                                     Pisa,    at
                                                                                                                                           Italy
                                  (10.4147 E, 43.7117 N), while Figure 2 shows their positions on the orbital arc. For2
                                  least one ◦ beam    covering
                                                           ◦      the city   of Pisa,  Italy (10.4147°    E,  43.7117°    N),  while  Figure
                                  shows   their positions
                                  each satellite,   Table 2 on    the orbital
                                                               specifies         arc. For
                                                                          the orbital      each satellite,
                                                                                         longitude,    alongTable
                                                                                                                with 2thespecifies  the orbital
                                                                                                                           AzEl coordinates
                                  longitude,   along   with    the  AzEl    coordinates    and   the  EIRP    (effective
                                  and the EIRP (effective isotropic radiated power) for a GS located in Pisa. This example isotropic  radiated
                                  power)   for a GS   located   in Pisa. This   example    demonstrates      that  many
                                  demonstrates that many GEO satellites are potentially available for rain monitoring from GEO   satellites  are
                                                                                                                                               a
                                  potentially  available
                                  single receive   site. for rain monitoring from a single receive site.

                                                                                                  ◦ E, 43.7117◦ N).
                         Figure 2. Geostationary satellite arc
                         Figure 2.                         arc in
                                                               in the
                                                                  the sky
                                                                      sky of
                                                                          of Pisa,
                                                                             Pisa, Italy
                                                                                   Italy (10.4147
                                                                                         (10.4147°  E, 43.7117°
Sensors 2021, 21, 5872                                                                                                                                                                      6 of 33

                                         Table 2. List of geostationary satellites for DTH TV broadcasting in the Ku band Table 10 (4147◦ E, 43.7117◦ N).

                                             Azimuth w.r.t. Local        Elevation above
  Geostationary Satellite    Long (◦ )                                                                 Beam              EIRP (dBW)                            Reference
                                                 South (◦ )                Horizon (◦ )
         Eutelsat 70B          70.5                −60.0853                   12.6724                   Wide                  44          LyngSat. Available online: https://www.lyngsat.com
                                                                                                                                                     (accessed on 28 August 2021).
          Intelsat 20          68.5                −58.0853                   14.0569            Europe and Africa           44.8         LyngSat. Available online: https://www.lyngsat.com
                                                                                                                                                     (accessed on 28 August 2021).
          Intelsat 17          66.0                −55.5853                   15.7709           Europe and Mid-East          47.6          Digisat. Available online: https://www.digisat.org
                                                                                                                                                      (accessed on 28 August 2021).
            NSS 12             57.0                −46.5853                   21.7379               Middle East               46          LyngSat. Available online: https://www.lyngsat.com
                                                                                                                                                     (accessed on 28 August 2021).
        Express AM6            53.0                −42.5853                   24.2543                  Fixed 2                47          LyngSat. Available online: https://www.lyngsat.com
                                                                                                                                                     (accessed on 28 August 2021).
         Belintersat 1         51.5                −41.0853                   25.1708                  Europe                 51          Belintersat. Available online: https://belintersat.com
                                                                                                                                                       (accessed on 28 August 2021).
         Türksat 4B            50.0                −39.5853                   26.0710                   West                  54            SatStar. Available online: http://www.satstar.net
                                                                                                                                                      (accessed on 28 August 2021).
  AzerSpace 1/Africasat        46.0                −35.5853                   28.3825                  Europe                 46            SatStar. Available online: http://www.satstar.net
           1a                                                                                                                                         (accessed on 28 August 2021).
  AzerSpace 2/Intelsat 38      45.1                −34.6853                   28.8831                  Europe                51.6         LyngSat. Available online: https://www.lyngsat.com
                                                                                                                                                     (accessed on 28 August 2021).
  Türksat 3A/Türksat 4A        42.0                −31.5853                   30.5469                   West                  52          LyngSat. Available online: https://www.lyngsat.com
                                                                                                                                                     (accessed on 28 August 2021).
 Hellas Sat 3/Hellas Sat 4     39.0                −28.5853                   32.0591               Europe FSS                52            SatStar. Available online: http://www.satstar.net
                                                                                                                                                      (accessed on 28 August 2021).
         Eutelsat 36B          36.0                −25.5853                   33.4642                 Eurasia                 48          LyngSat. Available online: https://www.lyngsat.com
                                                                                                                                                     (accessed on 28 August 2021).
         Eutelsat 33E          33.0                −22.5853                   34.7513                   Wide                  50            SatStar. Available online: http://www.satstar.net
                                                                                                                                                      (accessed on 28 August 2021).
           Astra 5B            31.5                −21.0853                   35.3471               High power                52          LyngSat. Available online: https://www.lyngsat.com
                                                                                                                                                     (accessed on 28 August 2021).
Sensors 2021, 21, 5872                                                                                                                                               7 of 33

                                                                             Table 2. Cont.

                                        Azimuth w.r.t. Local   Elevation above
  Geostationary Satellite   Long (◦ )                                                     Beam       EIRP (dBW)                         Reference
                                            South (◦ )           Horizon (◦ )
 Astra 2E/Astra 2F/Astra      28.2           −17.7853              36.5375                Europe         50        LyngSat. Available online: https://www.lyngsat.com
           2G                                                                                                                 (accessed on 28 August 2021).
            Badr 4            26.0           −15.5853              37.2336                    BSS        47        Arabsat. Available online: https://www.arabsat.com
                                                                                                                              (accessed on 28 August 2021).
           Astra 3B           23.5           −13.0853              37.9242                Europe         51        LyngSat. Available online: https://www.lyngsat.com
                                                                                                                              (accessed on 28 August 2021).
         Eutelsat 21B         21.5           −11.0853              38.3962               Western         46        LyngSat. Available online: https://www.lyngsat.com
                                                                                                                              (accessed on 28 August 2021).
     Astra 1KR/Astra          19.2            −8.7853              38.8473                Europe         51        LyngSat. Available online: https://www.lyngsat.com
  1L/Astra 1M/Astra 1N                                                                                                        (accessed on 28 August 2021).
        Eutelsat 16A          16.0            −5.5853              39.3062               Europe B        50        LyngSat. Available online: https://www.lyngsat.com
                                                                                                                              (accessed on 28 August 2021).
   Hotbird 13B/Hotbird        13.0            −2.5853              39.5528                    Wide       53        LyngSat. Available online: https://www.lyngsat.com
    13C/Hotbird 13E                                                                                                           (accessed on 28 August 2021).
        Eutelsat 10A          10.0             0.4147              39.6185                    Wide       48        LyngSat. Available online: https://www.lyngsat.com
                                                                                                                              (accessed on 28 August 2021).
         Eutelsat 9B          9.0              1.4147              39.6000                    Wide       51        LyngSat. Available online: https://www.lyngsat.com
                                                                                                                              (accessed on 28 August 2021).
  Eutelsat 7B/Eutelsat 7C     7.0              3.4147              39.5026              Europe A         49       Eutelsat. Available online: https://www.eutelsat.com
                                                                                                                              (accessed on 28 August 2021).
           Astra 4A           4.9              5.5147              39.3140             Europe BSS        50        LyngSat. Available online: https://www.lyngsat.com
                                                                                                                              (accessed on 28 August 2021).
         Eutelsat 3B          3.0              7.4147              39.0683                Europe         49        LyngSat. Available online: https://www.lyngsat.com
                                                                                                                              (accessed on 28 August 2021).
        BulgariaSat 1         1.9              8.5147              38.8938                Europe         50        LyngSat. Available online: https://www.lyngsat.com
                                                                                                                              (accessed on 28 August 2021).
    Thor 7/Thor 5/Thor        −0.8            11.2147              38.3679                Spot 1        53.2       LyngSat. Available online: https://www.lyngsat.com
      6/Intelsat 10-02                                                                                                        (accessed on 28 August 2021).
           ABS 3A             −3.0            13.4147              37.8395                Europe         50       ABS. Available online: https://absatellite.com (accessed
                                                                                                                                   on 28 August 2021).
Sensors 2021, 21, 5872                                                                                                                                                   8 of 33

                                                                                 Table 2. Cont.

                                            Azimuth w.r.t. Local   Elevation above
  Geostationary Satellite       Long (◦ )                                                     Beam         EIRP (dBW)                        Reference
                                                South (◦ )           Horizon (◦ )
      Amos 7/Amos 3               −4.0            14.4147              37.5706            Pan European         53                  Spacecom. Available online:
                                                                                                                         https://www.amos-spacecom.com (accessed on 28
                                                                                                                                         August 2021).
  Eutelsat 5 West A (incl.        −5.0            15.4147              37.2842                Super            53       LyngSat. Available online: https://www.lyngsat.com
  1.3◦ )/Eutelsat 5 West B                                                                                                         (accessed on 28 August 2021).
      Eutelsat 8 West B           −8.0            18.4147              36.3237                Europe           54         SatStar. Available online: http://www.satstar.net
                                                                                                                                    (accessed on 28 August 2021).
       Express AM44              −11.0            21.4147              35.2191                    S1           51       LyngSat. Available online: https://www.lyngsat.com
                                                                                                                                   (accessed on 28 August 2021).
        Express AM8              −14.0            24.4147              33.9811                Fixed 1          51       LyngSat. Available online: https://www.lyngsat.com
                                                                                                                                   (accessed on 28 August 2021).
     Telstar 12 Vantage          −15.0            25.4147              33.5407         Europe and Middle       51         SatStar. Available online: http://www.satstar.net
                                                                                              East                                  (accessed on 28 August 2021).
      NSS 7 (incl. 4.9◦ )        −20.0            30.4147              31.1490         Europe and Middle       49         SatStar. Available online: http://www.satstar.net
                                                                                              East                                  (accessed on 28 August 2021).
             SES 4               −22.0            32.4147              30.1113         Europe and Middle       49       LyngSat. Available online: https://www.lyngsat.com
                                                                                              East                                 (accessed on 28 August 2021).
   Intelsat 905 (incl. 2.0◦ )    −24.5            34.9147              28.7563                Spot 1          52.6      LyngSat. Available online: https://www.lyngsat.com
                                                                                                                                   (accessed on 28 August 2021).
         Intelsat 901            −27.5            37.9147              27.0528                Spot 2           45         SatStar. Available online: http://www.satstar.net
                                                                                                                                    (accessed on 28 August 2021).
        Hispasat                 −30.0            40.4147              25.5753                Europe           54       LyngSat. Available online: https://www.lyngsat.com
  30W-5/Hispasat 30W-6                                                                                                             (accessed on 28 August 2021).
         Telstar 11N             −37.5            47.9147              20.8807                Europe           52         SatStar. Available online: http://www.satstar.net
                                                                                                                                    (accessed on 28 August 2021).
Sensors 2021, 21, 5872                                                                                          9 of 33

                         2.2. Satellite Link Budget
                              We now briefly review the link budget for the downlink of a GEO satellite. For the
                         moment, we assume that the EIRP observed at the receiver site takes on the nominal
                         value provided by the satellite operator, thus neglecting any fluctuation of the received
                         power due to residual orbit inclination with respect to the equatorial plane, as well as to
                         antenna pointing errors and to propagation impairments (these issues will be addressed
                         in Section 3). Then the available power of the useful signal (also termed “carrier”) at the
                         receiver is expressed by the following:

                                                                      EIRP
                                                            C=                   GR                                (1)
                                                                  LFS Latm Lrain

                         where LFS is the free-space loss, Latm is the atmospheric attenuation due to gaseous ab-
                         sorption (in the absence of rain), Lrain is the additional attenuation due to rain, which is
                         the target parameter to track in order to achieve rain estimation, and GR is the gain of the
                         receiving antenna of the GS. Moreover, for a digital signal with bit rate Rb , modulation
                         alphabet size M and coding rate r (i.e, mod/cod (M, r)), the average received energy
                         per bit and per symbol at RF is expressed by Eb = C/Rb and Es = C/Rs , respectively,
                         where Rs = Rb /(r log2 M ) is the symbol rate. Moreover, for both the “no rain” and “rain”
                         conditions, the available power N of the additive white Gaussian noise (AWGN) at the
                         receiver within a given bandwidth B (not specified here) can be expressed as follows.

                                                                  N = N0 B                                         (2)

                         where N0 = kB Teq is the one-sided noise power spectral density, kB being the Boltzmann
                         constant and Teq the equivalent noise temperature of the whole receiving system, given by
                         the following.
                                                              Teq = TA + TRX                                    (3)
                             In (3), TRX is the noise temperature of the receiver (assumed fixed), while TA is the
                         equivalent noise temperature of the antenna given by the following:
                                                                                       
                                                          Tc                     1
                                                TA =              + Tatm 1 −              + Tg                  (4)
                                                       Latm Lrain            Lrain Latm

                         where Tc is the noise temperature of the cosmic background microwave radiation (CBMR),
                         Tatm is the mean thermodynamic temperature of troposphere and rain (assumed to be
                         equal) and Tg is the elevation-dependent noise spillover temperature, accounting for the
                         noise originated from the surrounding environment mainly from the ground and picked-up
                         by the secondary lobes of the receiving antenna. For the sake of exemplification, Table 3
                         shows the values of the main downlink parameters of a DTH TV broadcast service in the
                         Ku band and DVB-S2 format [24], with a commercial-quality receiver [8].
                              The quality of the received signal is expressed by the so-called signal-to-noise ratio
                         (SNR), i.e., the ratio between the power C of the useful signal (see (1)) and the power of
                         the channel noise N (see (2)) collected over a given bandwidth B, with both the powers
                         evaluated at the output of the receiving antenna. This ratio is thus expressed as C/N and
                         applies to any type of “carrier” signal that is either analog or digital and either modulated
                         or unmodulated, in the latter case also termed “continuous wave” (CW). In the common
                         case of a digitally-modulated carrier, the signal quality is more conveniently expressed by
                         the ratio between the average energy per symbol Es received at RF and the noise power
                         spectral density N0 , named energy-per-symbol-to-noise density ratio (ESNDR) and denoted
                         as Es /N0 .
Sensors 2021, 21, 5872                                                                                                                 10 of 33

                                         Table 3. Parameters of a DTH TV broadcast satellite downlink [8]. LVP: linear vertical polarization.
                                         QPSK: quadrature phase shift keying. DVB-S2: digital video broadcasting via satellite, 2nd generation.
                                         FEC: forward error correction. QEF: quasi error free, refers to PER =10−7 (see [20], Table 13). PER:
                                         packet error rate.

                                          Receiving location                                              Pisa, Italy (10.4147◦ E, 43.7117◦ N)
                                          Satellite name; orbital slot; inclination                       Eutelsat 10A; 10◦ East; 0.072◦
                                          Satellite EIRP                                                  48 dBW
                                          Frequency; polarization                                         11.345 GHz; LVP
                                          Protocol; modulation; FEC rate                                  DVB-S2; QPSK; 4/5
                                          Required ESNDR for QEF performance                              4.68 dB
                                          Figure of noise of the receiver                                 0.2 dB @ 290 K
                                          Noise temperature of the receiver, TRX                          13.7 K
                                          Atmospheric attenuation, Latm                                   0.09 dB
                                          Mean thermodynamic temperature of troposphere, Tatm             275 K
                                          Noise temperature of the CBMR, Tc                               2.78 K
                                          Noise spillover temperature, Tg                                 10 K
                                          Receiving antenna diameter; gain (60% efficiency)               80 cm; 37.34 dBi
                                          Typical received ESNDR in clear-sky conditions Es /N0           10.5 dB
                                          Link margin                                                     5.82 dB
                                          θ                                                               40◦

                                         3. Satellite Downlink Impairments
Sensors 2021, 21, 5872                                                                                                              12 of 36
                                               We hereby briefly review the main factors affecting the received signal level from a GEO
                                         satellite downlink. As examples, we refer to the measurements plotted in Figure 3, relevant
                                         to a 6 week record of the ESNDR received from the satellite link described in Table 3.

                                        Figure
                                 Figure 3.         Record
                                                3. of
                                           Record     received   E s N 0 Efrom
                                                            of received   s /N0 the
                                                                                 from thesatellite
                                                                                    GEO   GEO satellite downlink
                                                                                                   downlink        described
                                                                                                            described in Tablein3Table
                                                                                                                                  over a3 over a
                                        6  week interval.
                                 6 week interval.
                                         3.1. Attenuation Factors Affecting Signal Level without Rain (in Addition to Free Space Loss)
                                 3.1. Attenuation Factors Affecting Signal Level without Rain (in Addition to Free Space Loss)
                                         3.1.1. Effect of Ionosphere and Troposphere
                                 3.1.1. Effect of Ionosphere and Troposphere
                                                In the transit through the ionosphere and troposphere, the downlink signal is subject
                                       Into
                                          the  transit through
                                             scintillation  fadingthe[25],
                                                                       ionosphere
                                                                            with rapidandamplitude
                                                                                           troposphere,     the downlink
                                                                                                       fluctuations   causedsignal  is subject irreg-
                                                                                                                               by small-scale
                                 to scintillation
                                         ularities infading    [25], with
                                                        the medium           rapid amplitude
                                                                         refractive  index. Thisfluctuations       caused for
                                                                                                     effect is significant    by frequencies
                                                                                                                                  small-scale above
                                 irregularities
                                         10 GHzinand  thegrows
                                                            mediumwithrefractive
                                                                         frequency.index.
                                                                                       In theThis   effect fluctuations
                                                                                              Ku band,      is significantarefor frequencies
                                                                                                                               within  ±0.5 dB, and
                                 above 10the period of scintillation fades varies from 1 to 10 s. Accordingly, the spectraldB,
                                             GHz   and   grows   with   frequency.    In the Ku   band,   fluctuations   are  within  ±0.5   width of
                                 and thethese
                                           period   of scintillation
                                                 fluctuations    in thefades
                                                                          Ku varies
                                                                              band isfrom    1 toorder
                                                                                         in the    10 s. Accordingly,
                                                                                                         or less than 1theHzspectral    widthfluctua-
                                                                                                                               [25]. These
                                 of thesetions
                                           fluctuations
                                                 are much  in faster
                                                              the Kuthan
                                                                      bandtheis in theevents
                                                                                 rain   order or
                                                                                               andless thanfaster
                                                                                                     even     1 Hz [25]. These fluctuations
                                                                                                                   if compared     to the long-term
                                 are much     faster
                                         effects     than the rain
                                                  mentioned      belowevents   and3.1.2).
                                                                          (Section   even faster   if compared
                                                                                            In addition           to the long-term
                                                                                                           to free-space   propagation  effects
                                                                                                                                           loss, other
                                 mentioned       below factors
                                         attenuation      (Sectionaffecting
                                                                     3.1.2). the
                                                                              In addition     to free-space
                                                                                   satellite downlink            propagation
                                                                                                           are related            loss, other
                                                                                                                        to the presence     of clouds
                                 attenuation factors affecting the satellite downlink are related to the presence of clouds
                                 and atmospheric absorption. The latter mainly depends on the environmental conditions
                                 (air pressure, temperature and humidity) in the vicinity of the receiving antenna, as well
                                 as on the geometry of the connection (altitude hS of the receiver above MSL and angle of
Sensors 2021, 21, 5872                                                                                           11 of 33

                         and atmospheric absorption. The latter mainly depends on the environmental conditions
                         (air pressure, temperature and humidity) in the vicinity of the receiving antenna, as well
                         as on the geometry of the connection (altitude hS of the receiver above MSL and angle
                         of elevation θ of the antenna) and on the operating frequency [26]. For the Ku band, it
                         typically assumes a value of the order of a fraction of dB, with very slow variations over
                         time, induced by the evolution of environmental conditions. Slightly larger values can be
                         found at higher frequencies. Furthermore, the presence of clouds can affect the received
                         signal level [27], reducing it by fractions of a dB, with slow variability over time. Finally,
                         large-scale changes in the medium refractive index due to temperature and humidity
                         gradients may induce downlink path bending [28]. In consequence, the received signal
                         power may experience very slow variations. This effect, however, is significant only at very
                         low antenna elevation angles (say around 10◦ or less).

                         3.1.2. Antenna Mispointing and Orbit Perturbations
                               Over time, the GEO satellite is subject to many perturbing forces that render it impos-
                         sible to maintain an orbit that is perfectly stable and can cause a drift both in longitude and
                         latitude. One of the main orbit perturbations is related to the gravitational effects of the
                         moon and the sun that cause a progression of the orbit inclination [29]. The residual orbit
                         inclination and eccentricity cause an apparent daily movement of the satellite in elevation
                         and longitude, as observed from the ground station, along an eight shaped path, with a
                         24 h period [30]. Further variations of the received signal level are caused by the slow
                         longitudinal drift of the satellite orbital position. This is due to gravitational forces caused
                         by earth longitudinal mass variations (for instance, satellites with longitudes from 0◦ to
                         60◦ East, slowly drift eastwards toward the Indian Ocean), and this sums up to the effect of
                         orbit inclination. These perturbations are periodically counteracted by the satellite operator
                         via orbit correction maneuvers, termed “station-keeping”: “East–West” and “North–South”
                         station-keeping maneuvers compensate for longitudinal and latitudinal variations, respec-
                         tively [31]. Thus, even if the GS antenna is correctly pointing towards the satellite nominal
                         position, its actual gain in the link budget undergoes continuous fluctuations caused by the
                         satellite movements, thus producing the nearly-periodic daily variations of signal strength
                         visible in Figure 3, along with a slow decay associated to the longitudinal drift. All of
                         the above are, however, long-term effects and their evolution is far slower than the signal
                         fluctuations occasionally induced by a rain shower.

                         3.1.3. Sun Blinding
                              Twice a year, the GS antenna pointing at a GEO satellite is occasionally “blinded” by
                         the apparent passage of the sun behind the satellite. This phenomenon, known as “sun
                         transit”, lasts a few minutes every day at the same time over a period of a few days. An
                         example is shown in Figure 3, recorded around the autumn equinox in Pisa, Italy. During
                         the sun transit, the antenna noise temperature increases abruptly and may result in severe
                         deterioration of the SNR. However, the day/time coordinates and persistence of any sun
                         transit can be exactly predicted, and the resulting sun-induced outage (i.e., out-of-service)
                         events can be easily recognized and counteracted in the RR estimation procedure.

                         3.1.4. Operator-Induced Power Variations
                              Occasionally, the satellite operator corrects the satellite orbital position and attitude,
                         or changes the transponder gain setting due to customer requests or other operational
                         needs. The above adjustment is normally carried out in a very short time, and sometimes it
                         involves a reduction in the received power. When any such event occurs, any algorithm
                         used to process the received data may misinterpret it as the onset of a precipitative event
                         unless proper countermeasures are taken. A couple of such events have been observed
                         during the measurements, as shown in Figure 3.
Sensors 2021, 21, 5872                                                                                                         12 of 33

                         3.2. Extra Attenuation Due to Rain
                              Figure 1 schematically shows the radio downlink between a satellite and the GS, in
                         the presence of stratiform rain, assuming a simplified two-layer tropospheric model made
                         of IPL and LL. As already pointed out, the rain in the LL affecting the final segment of
                         the electromagnetic path may introduce an additional non-negligible attenuation on the
                         received signal if the downlink frequency is close to or above 10 GHz [15] (ch. 9), while
                         the impact of IPL is negligible. While most papers adopt the simple stratification scheme
                         of Figure 1, some authors have investigated the more accurate three-layer tropospheric
                         model depicted in Figure 4. Here, the lower layer containing the GS is the usual liquid
                         layer (LL) above which there is an intermediate layer called the melting layer (ML), where
                         the ice particles falling from the clouds gradually melt [32–34]. The upper edge of the ML
                         is the freezing level (i.e., the 0 ◦ C isotherm), while its lower edge is the level of complete
                         liquefaction of ice, denoted as ML–LL interface in Figure 4 and located a few hundred
Sensors 2021, 21, 5872                                                                                            14 of 36
                         meters below the 0 ◦ C isotherm. The “wet segment” along the slanted path is now made of
                         two parts: one in the LL, of length L LL , and the other one in the ML, of length L ML .

                          Figure 4. Satellite downlink geometry in the presence of stratiform rain and three-layer tropo-
                         Figure
                          spheric4.model.
                                   Satellite downlink geometry in the presence of stratiform rain and three-layer tropospheric
                         model.
                                Taking into account the new layering model, the attenuation induced on the satellite
                          signal  by theinto
                              Taking      precipitation
                                              account the is new
                                                             to belayering
                                                                    ascribedmodel,
                                                                               to boththe
                                                                                        theattenuation
                                                                                             liquid and melting
                                                                                                          inducedlayers,
                                                                                                                    on thewhile    the
                                                                                                                             satellite
                          contribution
                         signal           of upper layers,
                                 by the precipitation      is toabove   the freezing
                                                                 be ascribed           point,
                                                                                 to both        can beand
                                                                                          the liquid    neglected.
                                                                                                             meltingAlayers,
                                                                                                                        simplifying
                                                                                                                                while
                          assumption
                         the contributionthatofisupper
                                                 often formulated
                                                        layers, above   when   dealing point,
                                                                          the freezing   with stratiform    rain models
                                                                                                 can be neglected.         is that the
                                                                                                                     A simplifying
                          parameters that
                         assumption      characterizing     the rain when
                                              is often formulated      field are   independent
                                                                              dealing              of the horizontal
                                                                                        with stratiform    rain models coordinates,
                                                                                                                          is that the
                          which   implies  in   particular  that  the RR   is uniform   on  all points  of the slanted
                         parameters characterizing the rain field are independent of the horizontal coordinates,        electromag-
                          netic path
                         which         through
                                  implies          the LL. This
                                             in particular         conjecture
                                                                that  the RR may      not always
                                                                                  is uniform     on beallsopoints
                                                                                                            accurate
                                                                                                                   of for
                                                                                                                       therain    cells
                                                                                                                              slanted
                          having   size comparable     or  smaller   than  the  length of  the  wet segment
                         electromagnetic path through the LL. This conjecture may not always be so accurate foror during    the initial
                          andcells
                         rain  finalhaving
                                     phases size
                                               of transit of a weather
                                                    comparable             perturbation
                                                                   or smaller              front over
                                                                                 than the length       thewet
                                                                                                   of the   receiver site.or during
                                                                                                               segment
                         the initial and final phases of transit of a weather perturbation front over the receiver site.
                          3.2.1. Specific Attenuation Model for the LL
                         3.2.1. In LL, the
                                Specific   signal attenuation
                                         Attenuation          is characterized
                                                      Model for  the LL         by the specific logarithmic attenuation
                          k (in dB/km), which is empirically related to the RR (mm/h) by a weak exponential
                               In LL, the signal attenuation is characterized by the specific logarithmic attenuation
                          relationship, also termed “power-law”, such as the following [35]:
                         k (in dB/km), which is empirically related to the RR (mm/h) by a weak exponential
                         relationship, also termed “power-law”,  k =such
                                                                     aRb ,asdB/km
                                                                             the following [35]:                     (5)
                                                                           b
                                                                   k = aR , dB/km                                      (5)
                          where the coefficients a and b depend mainly on carrier frequency and on other climatic,
                          geometric
                         where        and electromagnetic
                                 the coefficients           parameters
                                                  a and b depend         of the
                                                                    mainly      connection,
                                                                             on carrier      such as
                                                                                        frequency    temperature,
                                                                                                   and             inclina-
                                                                                                        on other climatic,
                          tion of the rain
                         geometric    and with  respect to theparameters
                                           electromagnetic     electromagnetic   pathconnection,
                                                                             of the   and polarization.
                                                                                                  such asWhile a varies by
                                                                                                            temperature,
                          orders of magnitude
                         inclination  of the rain with
                                                  with the frequency
                                                        respect to the in the range frompath
                                                                       electromagnetic     1 GHz
                                                                                               andtopolarization.  GHz, ab
                                                                                                     a few tens ofWhile
                         varies by orders of magnitude with the frequency in the range from 1 GHz to a few tens
                         of GHz, b varies much less and does not differ very much from unity. Model (5) is assumed
                         to be valid by all authors, even if the choice of the coefficients a and b is somewhat not
                         uniform from author to author. Several authors (e.g., [1,6]) refer to the values of a and b
Sensors 2021, 21, 5872                                                                                            13 of 33

                         varies much less and does not differ very much from unity. Model (5) is assumed to be valid
                         by all authors, even if the choice of the coefficients a and b is somewhat not uniform from
                         author to author. Several authors (e.g., [1,6]) refer to the values of a and b recommended
                         in [36], while others use values taken from the literature (as in [15,26]) or derived from ad
                         hoc experiments carried out in geographical areas of specific interest [3,37,38].

                         3.2.2. Specific Attenuation Model for the ML
                               With reference to a stratiform precipitation and to the model in Figure 4, the ML is
                         defined as that layer characterized by the coexistence of solid phase (ice) and liquid phase
                         (rain). It can be argued that the effect of the ML on signal attenuation depends both on
                         how the liquid fraction of the precipitation varies as a function of the vertical coordinate
                         and on the law the liquid fraction maps onto a specific attenuation value. Since there are
                         no consolidated results/models to describe the above phenomena, various approximate
                         approaches have been followed in the literature. One of them is to assume fictitiously that
                         the ML is made entirely of liquid phase such as the LL so that model (5) holds for the ML
                         as well but with a different choice for the parameters a and b [32–34,39]. According to
                         this scheme, the overall attenuation is calculated as that resulting from the series of two
                         attenuators (ML and LL) undergoing the same RR as the LL. A variant to this scheme is to
                         retain the simplified model in Figure 1 and fictitiously modify (increase) the LL height to
                         take into account the impact of the ML [26,36], while keeping the same values for a and b
                         valid for the LL. Further analytical ad hoc models have been developed by other authors,
                         e.g., in [8,40]. Additional details on these topics are given in Section 5.4.2.

                         4. Basic Methods for Estimating the Rainfall Rate from Rain Attenuation
                              In the following, the absence of rain, i.e., the case Lrain = 1 (0 dB), will be referred to
                         as the “clear-sky” condition, and the parameters relevant to this condition will be therefore
                         denoted by the subscript “clear”.

                         4.1. Basic Methods for Measuring Rain Attenuation
                              We now outline two basic schemes proposed in the literature for evaluating the
                         attenuation incurred by the satellite signal in the downlink. The first one is based on the
                         exploitation of the beacon signal transmitted by the satellite, while the other relies on the
                         direct elaboration of the DVB-S/S2 signal broadcast by the satellite transponder.

                         4.1.1. Beacon Power Measurement
                               Beacons are narrow-band signals transmitted by the satellites, most often in horizon-
                         tal (H) polarization, which are either unmodulated (also termed “continuous wave” or
                         CW) and mainly intended for antenna steering and power control-purposes or digitally-
                         modulated by FSK or PSK and carrying low-rate (i.e., a few kbit/s) telemetry (TM) data [41].
                         Beacons allow the operator to monitor satellite status and position, but they can also be
                         used by customers for antenna tracking. In the case of broadcast satellites, typical values
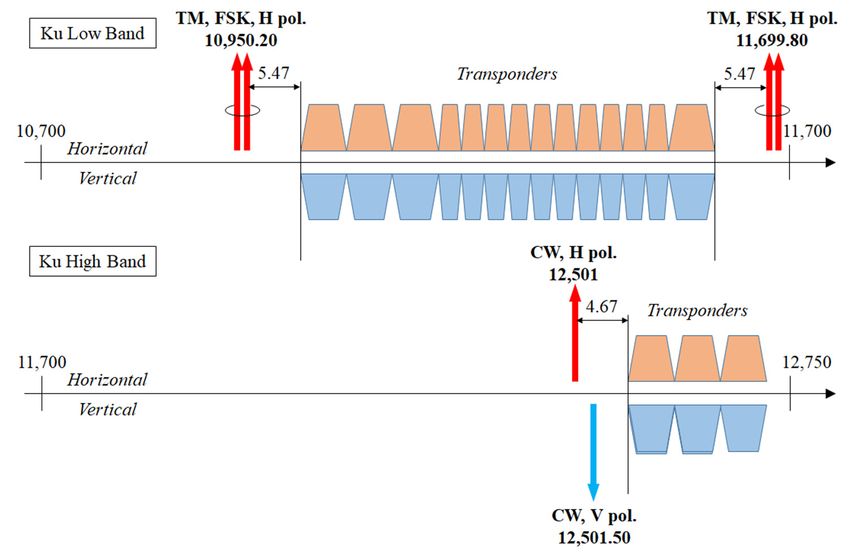
                         for the EIRP are 9 dBW for CW [42,43] and 4 dBW in case of TM [43]. Figure 5 (from [44])
                         illustrates a simplified version of the frequency plan of the Ku band geostationary satel-
                         lite Eutelsat 10A located at 10◦ E. The arrows represent the beacons that are allocated
                         at the sides of the frequency spectrum occupied by the transponders [45]: double-arrow
                         symbols indicate TM beacons with binary FSK modulation, while single arrows indicate
                         CW beacons.
                               Instead, the beacons radiated by communication satellites providing two-way broad-
                         band services in the Ka band to both fixed and mobile users with multiple-spot-coverage
                         have stronger levels (typically, 30 dBW [46]). In this case, a beacon is radiated inside
                         each beam and is used by the service customer for the initial pointing of the antenna for
                         satellite tracking (in case of mobile reception) and for enabling uplink transmissions and
                         power control.
Sensors 2021, 21, 5872                                                                                                                          14 of 33
Sensors 2021, 21, 5872                                                                                                                         16 of 36

 Sensors 2021, 21, 5872                                                                                                                         16 of 36

                           Figure 5.
                          Figure      Simplifiedfrequency
                                   5.Simplified    frequency    plan
                                                              plan   (not
                                                                   (not    to scale)
                                                                        to scale)     of the
                                                                                  of the     Ku band
                                                                                         Ku band       geostationary
                                                                                                  geostationary        satellite
                                                                                                                  satellite      Eutelsat
                                                                                                                            Eutelsat  10A,
                          located
                          10A, located      10◦ [44],
                                   at 10°atEast East showing     polarization
                                                      [44], showing            and frequency
                                                                      polarization              allocation
                                                                                     and frequency         of the
                                                                                                     allocation of beacons   [45].[45].
                                                                                                                   the beacons      All the
                                                                                                                                        All
                          frequencies   are  in MHz.    A   single arrow   indicates   a  CW  beacon,   while a
                           the frequencies are in MHz. A single arrow indicates a CW beacon, while a double-arrowdouble-arrow      symbol
                          represents
                           represents aa binary
                                         binary FSK-modulated
                                                 FSK-modulated TM   TM beacon.
                                                                        beacon.

                           Figure 5. Simplified
                                Due              frequency
                                     to their constant      plan (not
                                                         transmit     to scale)
                                                                    power,      of the Ku
                                                                             beacons      band geostationary
                                                                                        represent an excellentsatellite Eutelsat
                                                                                                                reference   for 10A,
                                                                                                                                 the
                           located at 10° East
                          measurement           [44],
                                           of the     showing polarization
                                                  fluctuations  in receivedand     frequency
                                                                              signal         allocation
                                                                                      strength caused byof the beacons [45].
                                                                                                           propagation         All the
                                                                                                                          phenom-
                           frequencies
                          ena.  Figure 6are  in MHz.
                                          depicts   theAhigh-level
                                                          single arrow   indicatesscheme
                                                                    conceptual       a CW beacon,   while a double-arrow
                                                                                            of the beacon-based               symbol
                                                                                                                    measurement
                           represents  a binary  FSK-modulated    TM  beacon.
                          system, which was adopted by many authors [6,47–51].

                          Figure 6. High-level block diagram of a beacon receiver for the estimate of the carrier attenuation.

                                After the RF front-end, a CW beacon is prefiltered by a narrowband band-pass filter
                          centered around the beacon frequency. The passband is, however, wide enough (it can be
                          in the order of magnitude of one hundred kHz) to accommodate the frequency instability
                           Figure 6. High-level block diagram of a beacon receiver for the estimate of the carrier attenuation.
                          Figure
                          of      6. High-level
                             the beacon           block diagram
                                            generator    which isoftypically
                                                                         a beacon in  receiver    for the
                                                                                          the order      ofestimate
                                                                                                            1 ppm per of the   carrier and
                                                                                                                           annum       attenuation.
                                                                                                                                              also the
                          transmitter phase noise for which its band is only a few tens of Hz. The prefilter is
                                 Afterthe
                                After    theRFRFfront-end,
                                                 front-end,aaCW    CWbeacon
                                                                          beaconisisprefiltered
                                                                                          prefilteredby    byaanarrowband
                                                                                                                 narrowbandband-passband-passfilter filter
                          followed by a down-conversion to baseband (the block “D/C” in Figure 6). Then, a vernier
                           centeredaround
                          centered     aroundthethebeacon
                                                      beaconfrequency.
                                                                frequency.The     Thepassband
                                                                                         passbandis,    is,however,
                                                                                                            however,wide wideenough
                                                                                                                                  enough(it  (itcan
                                                                                                                                                 canbe  be
                          search in frequency of the beacon signal is carried out by means of a filter bank made, for
                           inthe
                          in  theorder
                                  orderof  ofmagnitude
                                              magnitudeof   ofoneonehundred
                                                                        hundredkHz)   kHz)to    toaccommodate
                                                                                                   accommodatethe      thefrequency
                                                                                                                            frequencyinstability
                                                                                                                                           instability
                          example, with an FFT-based spectrum analyzer (the “Spectrum Analysis” block in Figure
                          of
                           ofthe
                              thebeacon
                                   beacongenerator
                                             generatorwhich
                                                          whichisistypically
                                                                        typicallyin    inthetheorder
                                                                                                  orderof of11ppm
                                                                                                                ppmper  perannum
                                                                                                                             annumand   andalso alsothethe
                          6). The analyzer resolution is a few tens of Hz, and it is not narrower in any case than the
                          transmitter
                           transmitterphasephasenoise   forfor
                                                    noise   whichwhich its band     is only
                                                                             its band        is aonly
                                                                                                  few tens
                                                                                                        a few of Hz.
                                                                                                                  tensThe    prefilter
                                                                                                                         of Hz.     Theisprefilter
                                                                                                                                            followedis
                          band
                          by     broadening induced
                              a down-conversion              by the (the
                                                       to baseband        overall
                                                                                block phase
                                                                                         “D/C”    noise   of both the
                                                                                                    in Figure              transmitter       and the
                           followed    by a down-conversion           to baseband         (the block     “D/C”6).  in Then,
                                                                                                                      Figurea6).  vernier
                                                                                                                                     Then,search
                                                                                                                                             a vernier in
                          receiver.
                          frequency  Theof analysis
                                           the beacon  bin corresponding
                                                         signal    is carried      to
                                                                                   out  the
                                                                                         by   maximum
                                                                                               means    of  alevel
                                                                                                              filter then
                                                                                                                      bank provides
                                                                                                                             made,       a
                                                                                                                                       for  measure
                                                                                                                                            example,
                           search in frequency of the beacon signal is carried out by means of a filter bank made, for
                          of thean
                          with   sum    of the beacon
                                     FFT-based            power
                                                   spectrum          C and that
                                                                 analyzer       (the  of
                                                                                       “Spectrum         N within the
                                                                                           the noise Analysis”            resolution
                                                                                                                       block     in Figureband (i.e.,
                           example,    with an FFT-based         spectrum        analyzer       (the “Spectrum Analysis”             block in6).Figure
                                                                                                                                                   The
                          the bin
                          analyzer width),    while
                                      resolution     the  farthest
                                                    is a few istens   bins
                                                                       of Hz, (at  the   edges     of  the  band)    provide      a measure      of  the
                           6). The analyzer     resolution        a few    tensand of Hz,it isandnotitnarrower      in any case
                                                                                                       is not narrower       in any  than
                                                                                                                                       casethe    band
                                                                                                                                               than    the
                          noise  N
                          broadeningonly.inducedinduced
                                                    by the overall
                           band broadening                    by thephase  overallnoise     of both
                                                                                        phase         the transmitter
                                                                                                   noise    of both theand        the receiver.
                                                                                                                             transmitter       andThe the
                                From these
                          analysis              measurements,to themade          during       both    rain   and clear-sky        conditions,      it ofis
                           receiver.binThecorresponding
                                             analysis bin corresponding maximum          level
                                                                                     to the       then
                                                                                                maximum  provides
                                                                                                               level athen
                                                                                                                         measure
                                                                                                                             provides of the   sum
                                                                                                                                           a measure
                          the  beacon
                          therefore
                           of the  sum    of the C
                                        power
                                      possible    toand  that
                                                      evaluate
                                                 beacon        ofthe
                                                           power    the   noise
                                                                      C reduction
                                                                          and that N within
                                                                                        ofinthethethe  resolution
                                                                                                    beacon
                                                                                                  noise   N within
                                                                                                               power  band
                                                                                                                       theΔresolution
                                                                                                                            C(i.e.,  the bin
                                                                                                                                , representing
                                                                                                                                           bandwidth),an
                                                                                                                                                     (i.e.,
                          while  the  farthest
                           the bin width),
                          estimate               bins
                                      of the while     (at the   edges
                                                       the farthest bins
                                               rain attenuation            of  the
                                                                         Lrain .(at  band)
                                                                                  Inthethisedgesprovide    a  measure
                                                                                                    of theit band)
                                                                                               respect,       is worth    of
                                                                                                                      provide the   noise  N
                                                                                                                                   a measure
                                                                                                                            remarking           only.
                                                                                                                                             thatofthethe
                           noise N only.
                                 From these measurements, made during both rain and clear-sky conditions, it is
                           therefore possible to evaluate the reduction in the beacon power Δ
                                                                                             C , representing an
Sensors 2021, 21, 5872                                                                                                                   15 of 33

                               From these measurements, made during both rain and clear-sky conditions, it is
                         therefore possible to evaluate the reduction in the beacon power ∆C,         ˆ representing an
                         estimate of the rain attenuation Lrain . In this respect, it is worth remarking that the presence
                         of rain (i.e., Lrain > 1) has a twofold effect: on the one side, it reduces the power of the
                         useful signal (the beacon, in this case), as in (1), while on the other side it increases the
                         noise power, as can be inferred from (2) to (4). Therefore, it is not correct to ascribe the SNR
                         degradation to the variation of C alone, although some authors seem to ignore or overlook
                         this issue.
                               Recalling (1)–(4), it is possible to derive a formula for estimating the rain attenuation
                         Lrain from measurements of the received power, both in the absence and presence of rain.
                         The total received power within the frequency bin containing the beacon carrier (for the
                         sake of simplicity, we assume hereafter that there is no power leakage on adjacent bins)
                         can be expressed as follows:
                                                                                                                                  
                                                                EIRP                      Tc                     1
                                Prain ( Lrain ) = C + N =                  GR + kB B              + Tatm 1 −              + Tg + TRX         (6)
                                                            LFS Latm Lrain             Latm Lrain            Latm Lrain

                          where B denotes here the analyzer frequency resolution (i.e., the bin width); moreover, the
                         dependence of the received power Prain on the rain attenuation Lrain has been pointed out.
                         Now, let us denote with Pclear = Prain ( Lrain = 1) the received level in the absence of rain to
                         be used as the reference for evaluating the attenuation. Then, after some manipulation, it is
                         found that Lrain is given by the ratio between the received powers in the bin containing the
                         beacon in the absence and in the presence of rain, respectively, where each value has to be
                         properly corrected by the rain-independent noise power contributions.
                                                                                            
                                                             Pclear − kB B Tatm + Tg + TRX
                                                    Lrain =                                                          (7)
                                                              Prain − kB B Tatm + Tg + TRX

                               Using (7) it is possible to obtain Lrain from the measurement of Prain and from knowl-
                         edge of the reference power Pclear (the latter obtained from either link-budget analysis or
                         previous measurements) and the temperatures Tatm , Tg and TRX (the first being around
                         275 K, the latter two taken from the specifications of the receiving antenna and equipment).
                         An alternative approach, as suggested in Figure 6, consists in jointly measuring both C + N
                         on the bin containing the beacon power and N on a different bin far enough from the
                         former containing the power peak so that only noise can be safely measured there. The
                         difference between the powers in the bin containing the peak and in the noise-only bin
                         yields the value of C. This procedure is applied twice, i.e., for both the clear-sky and the
                         rain condition, and the ratio between the values of C obtained in the two conditions will
                         again yield Lrain .
                               For the sake of clarity and in order to demonstrate the potentials of the beacon-based
                         method, let us consider the scenario described in Table 4a where a high-power beacon
                         signal from a Ka-band broadband service satellite is exploited, and the parameter values
                         are based on those used in [47]. The resulting performance, in both clear-sky and rain
                         conditions (with Lrain = 44 dB, corresponding to a rain rate in excess of 100 mm/h over
                         wet paths of 3–4 km at 20 GHz (see e.g., Figure 9.7 in Ref. [15]), is presented in Table 4b. In
                         particular, it is shown that even in this case of torrential rain, the beacon power still exceeds
                         by around 5.4 dB the background Gaussian noise power measured within the frequency
                         bin, thus allowing reliable detection and estimation of the signal peak level.
                               As pointed out earlier, these kinds of devices are mainly proposed for systems op-
                         erating in the Ka band or higher, where more powerful beacons are available [6], and
                         seldom for the Ku band. Since COTS (i.e., commercially available off-the-shelf) devices are
                         difficult (if not impossible at all) to find for beacon reception, practical implementations
                         must substantially rely on ad hoc self-made receivers. However, this additional burden
                         is likely to pay off since, thanks to the frequency stability of beacon generators and to the
                         consequent high resolution of the spectral analysis, these devices allow, as shown above,
                         measuring variations of C over dynamic ranges spanning several tens of dB [47]. Therefore,
                         they allow estimating very high values of RR (up to more than 100 mm/h).
You can also read