Analysing Computer Science Courses over Time - MDPI
←
→
Page content transcription
If your browser does not render page correctly, please read the page content below
data
Article
Analysing Computer Science Courses over Time
Renza Campagni † , Donatella Merlini †                        and Maria Cecilia Verri *,†

                                          Dipartimento di Statistica, Informatica, Applicazioni, Università di Firenze, I-50134 Firenze, Italy;
                                          renza.campagni@unifi.it (R.C.); donatella.merlini@unifi.it (D.M.)
                                          * Correspondence: mariacecilia.verri@unifi.it
                                          † These authors contributed equally to this work.

                                          Abstract: In this paper we consider courses of a Computer Science degree in an Italian university from
                                          the year 2011 up to 2020. For each course, we know the number of exams taken by students during a
                                          given calendar year and the corresponding average grade; we also know the average normalized
                                          value of the result obtained in the entrance test and the distribution of students according to the
                                          gender. By using classification and clustering techniques, we analyze different data sets obtained
                                          by pre-processing the original data with information about students and their exams, and highlight
                                          which courses show a significant deviation from the typical progression of the courses of the same
                                          teaching year, as time changes. Finally, we give heat maps showing the order in which exams were
                                          taken by graduated students. The paper shows a reproducible methodology that can be applied to
                                          any degree course with a similar organization, to identify courses that present critical issues over
                                          time. A strength of the work is to consider courses over time as variables of interest, instead of the
                                          more frequently used personal and academic data concerning students.

                                          Keywords: course analysis; clustering; classification; heat maps


Citation: Campagni, R.; Merlini, D.;      1. Introduction
Verri, M.C. Analysing Computer                  Several data mining models have been proposed in the literature to extract knowledge
Science Courses over Time. Data 2022,
                                          and identify critical issues from both data usually stored in the schools’ and universities’
7, 14. https://doi.org/
                                          databases for administrative purposes, and large amounts of information about teaching–
10.3390/data7020014
                                          learning interaction generated in e-learning or web-based educational contexts. The state of
Academic Editor: Kassim S.                the art on this topic can be found in several surveys, such as [1–4], where many applications
Mwitondi                                  and tasks can be found. This research area, known as Educational Data Mining, has seen
                                          tremendous growth in conferences and publications over the past two decades, as described
Received: 16 December 2021
                                          in depth in the recent paper [5].
Accepted: 19 January 2022
                                                Among the most studied applications described in previous surveys we find the
Published: 24 January 2022
                                          modeling of students through the analysis of their performance or behavior, for example,
Publisher’s Note: MDPI stays neutral      predicting student performance and dropout, detecting undesirable student behaviors or
with regard to jurisdictional claims in   profiling and grouping students (see, e.g., [6–9]). As illustrated in [10], e-learning systems
published maps and institutional affil-   and Massive Open Online Courses (MOOCs) produce a large amount of very valuable
iations.
                                          information for analyzing student behavior and represent a goldmine of educational data
                                          that necessitates the use of data mining techniques to process and analyze them. Another
                                          major group of applications concerns decision support systems. Applications dedicated
                                          to this category aim to improve the learning process by helping stakeholders to make
Copyright: © 2022 by the authors.
Licensee MDPI, Basel, Switzerland.
                                          decisions. Examples in this category are: providing reports and feedback, creating alerts,
This article is an open access article
                                          planning and scheduling, generating recommendations and improving learning material
distributed under the terms and           (see, e.g., [4,11–14]). A detailed taxonomy of the main applications of the Educational Data
conditions of the Creative Commons        Mining studies can be found in [2] (Figure 1). Previous applications are mainly concerned
Attribution (CC BY) license (https://     with techniques such as clustering, classification, regression, association rules mining and
creativecommons.org/licenses/by/          sequential pattern analysis. Recently, deep learning has also gained increasing attention
4.0/).                                    in the educational domain, as described in [15]. An important aspect of any work in the

Data 2022, 7, 14. https://doi.org/10.3390/data7020014                                                                https://www.mdpi.com/journal/data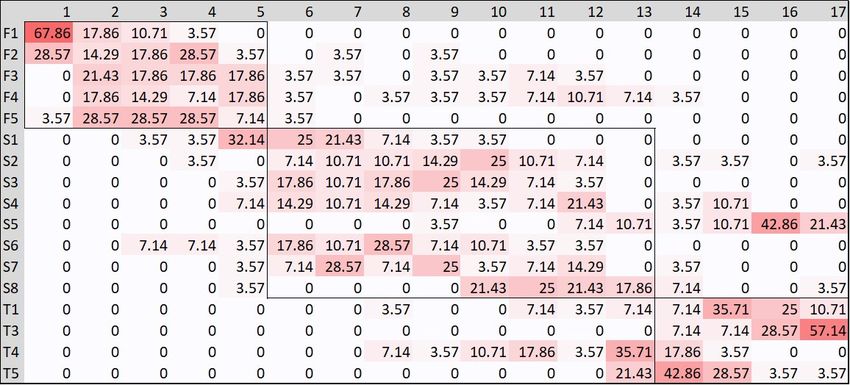
Data 2022, 7, 14                                                                                            2 of 15

                   Educational Data Mining context is the type of data on which the analysis is carried out
                   and, in particular, the phase of understanding and pre-processing of the data is crucial. Pre-
                   processing allows transforming the available raw educational data into a suitable format
                   ready to be used by a data mining algorithm for solving a specific educational problem.
                   However, this step is rarely described into details. A specific reference about this topic can
                   be found in [16].
                        Data mining techniques in the context of computer science degrees have been used
                   in several papers, mainly to study the careers of students (see, e.g., [17,18]) and to predict
                   the performance of university students [19]. The study of the order in which the exams are
                   taken by the students has been studied sporadically in the literature, for example in [6]
                   an analysis of the students’ careers is made by making a comparison with the ideal career
                   of the student who follows exactly the path of study suggested. Since in that paper the
                   target variables were the students, sequential pattern analysis was also used to identify
                   patterns in the way students take exams. Other works in the same direction are described
                   in [20], where a general methodology for assessing the impact of course sequencing on
                   student performance is presented, and in [21], where a sequence based course recommender
                   is developed. In [22], a framework that models a curriculum as a Bayesian Network is
                   presented and used to quantify the effort to restructure curricular patterns.

                   1.1. Objectives of the Paper
                         In this paper we consider courses of a Computer Science degree in an Italian university;
                   the study concerns the exams taken by students from the year 2011 up to 2020. The degree
                   course is structured into three teaching years: in the first year, I, there are five annual
                   courses; in the second year, II, there are eight courses distributed across two semesters;
                   finally, in the third year, III, there are four courses and others free choice courses. In this
                   study, the term calendar year will indicate any of the years 2011–2020, while teaching year
                   will refer to values I, II and III.
                         There are some prerequisites between the courses, and students are invited to take
                   the exams following the division into teaching years and semesters, but in many cases,
                   the exams corresponding to a given year can be taken before those of the previous ones: for
                   example, II year exams before those of the I year, and III year exams before those of the
                   II year. However, generally, when a student decides to postpone an exam rather than go
                   in order, it often means that the exam has particular characteristics or sometimes presents
                   critical issues. We wish to point out, however, that among courses of the same teaching
                   year, no prerequisites exist in our organization.
                         A problem of the degree course in Computer Science in question, but common to many
                   degree programs in the same area, is that many students drop out during or after the first
                   year because they often have a wrong view of the concept of computer science, associating
                   the term with the use of information technologies rather than the fundamental aspects of
                   the matter (see, e.g., [23]). Many students are not aware that the Computer Science branch
                   is one of the fields that is mathematically heavy, especially in the first year. These students
                   often have great difficulties with math exams or in general with those courses where the
                   theoretical aspects predominate over the applications. In these cases, the role of the teacher
                   is fundamental to be able to retain students, make them interested in the subject, and make
                   them learn it. Unfortunately, not all teachers’ efforts are successful, and the number of
                   exams taken in the first year is generally higher than that of the second because of this
                   dispersion between one year and another. Moreover, the number of students enrolled is
                   not consistent over time.
                         The study is based on the total number of exams taken for each course, without
                   keeping track of the behavior of individual students. We are not interested in comparing
                   courses based on the students who took them but based on the number of exams and the
                   grades that the students have obtained, thus considering each time groups of students that
                   may be different, even for courses of the same year of teaching.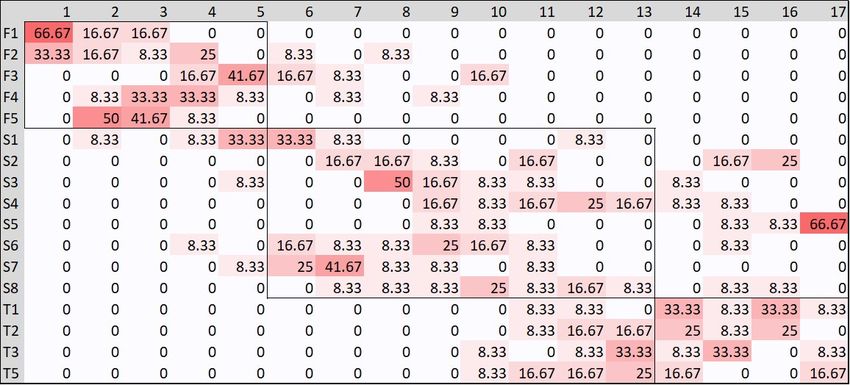
Data 2022, 7, 14                                                                                            3 of 15

                        The aim of this work is to compare the courses of the same teaching year over time,
                   based on the total number of exams that have been taken by students, the total number
                   of credits acquired and the average marks in the corresponding exams. In addition to
                   these attributes, we also considered some input characteristics of the students, such as
                   gender and the results obtained in the admission test: in particular, we think that this last
                   information can summarize the students’ initial level of preparation.
                        We do not have the claim to explain why a certain course presents some critical
                   issues during the period under examination, and instead highlight which courses show
                   a significant deviation from the typical progression of the courses of the same teaching
                   year over time. Once these criticalities have been identified, it will be the responsibility
                   of the course manager to understand the reasons. However, we believe that a problem
                   such as dropouts can also be sought in those courses that show behavior that negatively
                   differs from that of the courses of the same teaching year and that our methodology aims
                   to identify.

                   1.2. Organization of the Paper
                         In Section 2, we describe the collection and pre-processing of data and present the
                   results of a descriptive analysis on the transformed data.
                         In Section 3, we try to understand which courses have caused students the most
                   difficulties over the years. In particular, in Section 3.1 we present an analysis based on
                   supervised classification techniques by grouping together the exams corresponding to each
                   course, year by year during 2011–2020. We built a classification model for the class attribute
                   teaching year, with possible values I, II and III, and then we look for the instances that are
                   incorrectly classified to detect outlier courses. Various classification algorithms can be used
                   for this purpose but in the paper we point out the results obtained with J48 algorithm, since
                   the model, in this case, is represented by a decision tree that is easily understandable. In
                   Section 3.2, we perform an unsupervised classification by presenting an analysis based on
                   hierarchical clustering. Once again, the goal is to verify if the three natural groups of I, II
                   and III teaching year exams are identified by the algorithm on the basis of the attributes
                   of our data set and if there are any anomalous instances. This technique can be applied
                   to the same data set used in the previous section, but to make the resulting dendrogram
                   more readable, in the work we show the result obtained by grouping the exams of each
                   course, regardless of the year in which the exam was held. For both studies, we highlight
                   the importance of the coding adopted for the courses, as described in Section 2: by using
                   a similar approach, it is possible to reproduce a similar analysis for other degree courses,
                   even those other than Computer Science.
                         Finally, since students have a certain flexibility in choosing the order in which they
                   take exams—in fact most courses either have no prerequisites or a small number of
                   prerequisites—in Section 4 we highlight with heat maps the sequence in which the exams
                   are taken by students. To this purpose, we restricted our data set, studying the exams of
                   students of the 2010–2017 cohorts who graduated within December 2020.
                         A precise description of the data mining algorithms used for the analysis can be found
                   in [24]; we used in particular their implementation in WEKA, https://www.cs.waikato.ac.nz/
                   ml/weka/ (accessed January 2022). The pre-processing phase and the data sets elaboration
                   have been carried out by using MySQL, https://www.mysql.com/ (accessed January 2022).

                   1.3. Novelty of the Paper
                        Following the taxonomy in [2] (Figure 1), which categorizes some of the applications
                   in Educational Data Mining, the present paper can be placed in the categories providing
                   reports and planning and scheduling. The purpose of the former category, which includes
                   data analysis and visualization, is to find and highlight the information related to course
                   activities that may be of use to educators and administrators and provide them with feed-
                   back. The objective of the latter category is to help stakeholders with the task of planning
                   and scheduling and can help educators and administrators with planning future courses
Data 2022, 7, 14                                                                                           4 of 15

                   or recourse allocation. To the first category belongs, for example, the paper [25], where
                   association rule mining is used to provide feedback to instructors from the multiple-choice
                   quiz data. Studies concerning planning and scheduling can be found, for example, in [26],
                   which enhances course planning by establishing the probability of enrollees completing
                   their courses based on the student’s preferences and profession, in [27], which discovers
                   explicit knowledge that can be useful for decision-making processes as well as proposing
                   analytical guidelines for higher education institutions, and in [28], which uses cluster
                   analysis, decision tree algorithm and neural networks for planning courses.
                        In this paper, we consider the courses over time as variables of interest. The novelty of
                   the work consists precisely in the fact of using as variables the compulsory courses that
                   students have to take during their university career. Generally, the target variables concern
                   personal and academic data of the students, or the tracking of their activities, and external
                   data about the context where they study and live, but comparing courses of the same
                   teaching year based on the exams taken by the students seems rather original. In none
                   of the surveys [1–5], and in the included bibliography, are studies of this type reported.
                   Furthermore, in the recent review [29], many papers where data mining contribute to
                   preventing students’ dropout in higher education are examined; in particular, Ref. [29]
                   (Figure 5) highlights the hierarchy categories and subcategories of the features considered in
                   the analyzed studies and does not report any paper in which the target variable is the course.
                   We study courses over time through classification and clustering, using the teaching year
                   as a class attribute and identifying those courses that have characteristics that differ from
                   those of the same teaching year courses, which in an ideal situation should be very similar.
                   The use of classification algorithms such as decision trees and of hierarchical clustering
                   have the advantage of returning models that are easy to understand and to interpret for
                   interested parties, helping to make decisions. Similarly, the construction of heat maps to
                   highlight patterns in the order in which students take exams is original and allows us to
                   identify which courses students tend to anticipate or postpone. This type of report is easy
                   to read for those who have to decide on the organization of the study course. Furthermore,
                   the formal approach used can be adapted to any degree course that includes a certain
                   number of compulsory courses organized in different teaching years and with a similar
                   exam mechanisms. Last but not least, we would like to highlight the accurate analysis in
                   the understanding and pre-processing phases, which is fundamental in any work in which
                   data are the leading actors. The pre-processing phase is fundamental for choosing the
                   most appropriate data mining techniques for the analysis while the understanding phase,
                   thanks to the intervention of context experts, allows to identify the main critical issues to
                   be investigated in the subsequent analysis. This is especially important when we have
                   temporal data, as is the case of our analysis.

                   2. Data Collection, Pre-Processing and Understanding
                         The data set was collected from the Computer Science degree in the School of Mathe-
                   matics, Physics and Natural Sciences of the University of Florence (Italy), and corresponds
                   to the intersection between exams of students and their personal information. In particular,
                   we considered 6361 instances of exams that students of cohorts 2010–2019 took in the
                   calendar years 2011–2020. Each instance contains data of a single exam: the student and
                   the course identifiers, the credits associated with the course, the date of the exam and
                   the corresponding grade. Moreover, we had instances about personal information of 637
                   students such as the year of enrollment, the result of the admission test, the gender and the
                   final grade in the case of graduated students. Concerning the admission test, each student,
                   before enrolling in the degree course, had to take a test to self-evaluate their background
                   in mathematics. This test consists of 25 multiple choice questions (one correct answer
                   out of four possible options) on mathematics arguments usually studied in high school:
                   arithmetic, elementary algebra, equations, inequalities, elementary logic, combinatorics,
                   functions, geometry, probability. Each correct answer counts as 1 point while a wrong or
                   no given answer counts as 0 points: the test is passed with 12 points.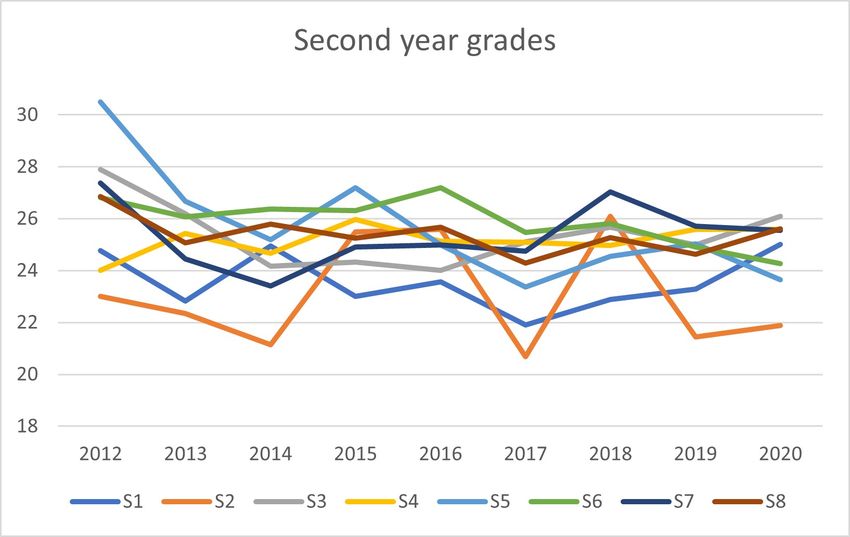
Data 2022, 7, 14                                                                                                  5 of 15

                        After a pre-processing phase to correct any missing information and remove the exams
                   not included in the analysis, we obtained a data set containing 6062 records corresponding
                   to 18 different courses. In particular, all the exams corresponding to a judgment but not a
                   grade were eliminated. In Table 1, we give the description of each course and a coding that
                   highlight the teaching year of the course: the numbering takes into account the alphabetical
                   order of the Italian names. Concerning year III, for organizational reasons, course T2
                   was replaced by course T4 in 2015 and for this reason, five courses appear in the table in
                   correspondence of the third year.

                   Table 1. A coding for First, Second and Third teaching year courses: the numbering takes into
                   account the alphabetical order of the Italian names. Course T2 was replaced by T4 in the year 2015.

                    F1                                                ALGORITHMS AND DATA STRUCTURES
                    F2                                                CALCULUS
                    F3                                                COMPUTER ARCHITECTURE
                    F4                                                DISCRETE MATHEMATICS AND LOGIC
                    F5                                                PROGRAMMING
                    S1                                                LINEAR ALGEBRA
                    S2                                                CALCULUS II
                    S3                                                DATABASES AND INFORMATION SYSTEMS
                    S4                                                PROBABILITY AND STATISTICS
                    S5                                                PHYSICS
                    S6                                                PROGRAMMING METHODOLOGIES
                    S7                                                CONCURRENT PROGRAMMING
                    S8                                                OPERATING SYSTEMS
                    T1                                                NUMERICAL ANALYSIS
                    T2                                                CODES AND SECURITY
                    T3                                                THEORETICAL COMPUTER SCIENCE
                    T4                                                INTERPRETERS AND COMPILERS
                    T5                                                COMPUTER NETWORKS

                         We wish to point out that among the 6062 exams, only 864 were taken by female
                   students, which are generally a small percentage of the total number of enrollments.
                         As already observed, the data set contains exams of students of cohorts 2010–2019 and
                   therefore in the calendar year 2011, our first year of analysis, we have exams corresponding
                   to I teaching year only; in the calendar year 2012 we have those of I and II teaching years;
                   and, finally, starting from calendar year 2013 we have exams from I, II and III teaching
                   years.
                         These considerations are confirmed by Figure 1 that illustrates the average number of
                   exams of I, II and III year, as time varies and the corresponding average grades. The figure
                   shows that in the passage from the first to the second year and from the second to the
                   third year, the average number of exams decreases and therefore highlights the problem of
                   dropouts in the degree course. The grades, on the other hand, are fairly uniform both over
                   the three years of teaching and over time.

                   Figure 1. Average number of exams and grades over time for the teaching years I, II and III.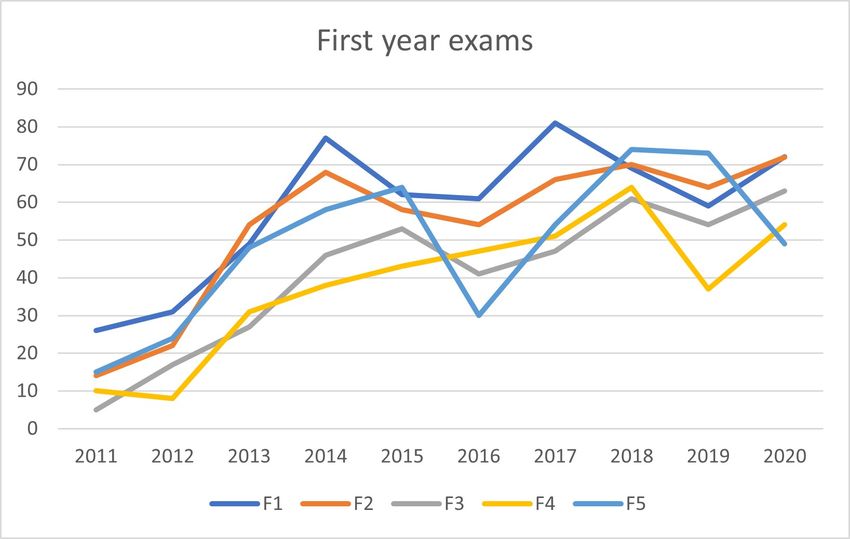
Data 2022, 7, 14                                                                                                 6 of 15

                        From the previous observations, it is clear that it is not possible to compare courses
                   from different teaching years: an accurate analysis of the exams taken over time can instead
                   allow us to compare the courses of the same teaching year, highlighting those that had more
                   problems, with delayed exams and low grades. Figures 2–4 show the total number of exams
                   for courses of the same teaching year over time and the corresponding average grades.
                   Concerning the courses of the first year, Figure 2 shows that F4 has lower values both in
                   terms of number of exams per year and as average grades, compared to the other courses
                   of the first year. The F1 and F2 courses, on the other hand, have similar and above-average
                   trends.

                   Figure 2. Total number of exams and average grades over time for the first year courses in Table 1.

                         Second year courses show, in Figure 3, greater fluctuations over time and, therefore,
                   it is more difficult to identify specific anomalous behaviors for a single course. It can be
                   noted that, especially in the firsts years under examination, the average number of exams
                   of the S5 course is lower than that of the other courses.

                   Figure 3. Total number of exams and average grades over time for the second year courses in Table 1.

                        Concerning the third year courses in Figure 4, we note in particular the increase in the
                   number of exams of T5 in the last years of investigation, which corresponds to a change of
                   teacher. With regard to the average grades, it can be observed that the same course T5 has
                   average high grades while T3 always has average low grades.

                   Figure 4. Total number of exams and average grades over time for the third year courses in Table 1.

                         Finally, we report in Figure 5, only for the first year exams, the average grades obtained
                   in the entrance test by the students who took the exams of the various courses. It is
                   interesting to note that the students who took the F4 course obtained above average grades
                   in the entrance test. Since the test is about mathematics topics, this result highlights what
                   difficulties students have with this exam.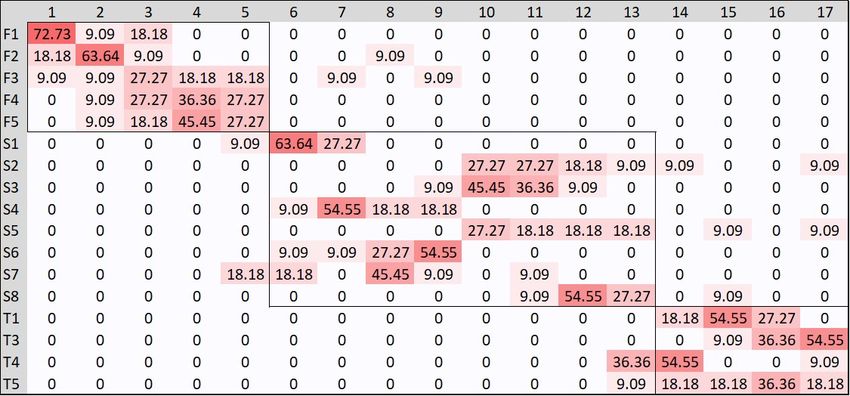
Data 2022, 7, 14                                                                                               7 of 15

                   Figure 5. Normalized graded of tests for exams of I teaching year.

                   3. Courses Analysis by Classification and Clustering
                        As we discussed in the Introduction, the goal of this section is to compare the courses
                   of the same teaching year over time by using classification and clustering techniques:
                   in an ideal situation, where students are able to take all their exams on time and do not
                   accumulate delays, the courses of the same teaching year should correspond to the same
                   number of exams. Furthermore, if students had the same difficulties in the courses of the
                   same teaching year, one might expect not to have large differences in the corresponding
                   average grades. Unfortunately, this does not happen in reality and the number of exams
                   and the grades can vary significantly from one course to another in the same teaching year.
                   In order to analyze courses, we performed several data aggregations to apply different data
                   mining algorithms and study the courses over time.

                   3.1. Descriptive Classification
                        In our first study, we processed the original data set containing the 6062 records
                   corresponding to the exams taken by students during the years 2011–2020 and performed
                   an aggregation according to teaching and calendar years; the resulting data set contains
                   154 instances and the following attributes:
                   •    des_year: the description of a course in a given year, of the type Fit , S jt and Tkt with
                        i = 1, . . . 5, j = 1, . . . 8 and k = 1, . . . 5 for courses of first, second and third year,
                        respectively, and t = 1, . . . 9, 0 denoting the year of the course;
                   •    teaching_year: I, II and III;
                   •    tot_exam: total number of exams in a calendar year for a given course;
                   •    tot_c f u: total number of credits acquired by students in a calendar year for a given
                        course;
                   •    avg_grade: average grade of the exams taken in a calendar year for a given course;
                   •    avg_test: normalized average grade of the entrance test taken by students who took
                        the exam in given calendar year.
                         In this first study, we also took into account the normalized average grade that students
                   obtained in the entrance test because we think this value can be a good indicator of their
                   initial preparation. We then used this data set as a training set for building a classification
                   model with teaching_year as the class attribute.
                         We tried several classification algorithms that are available in the WEKA system, apply-
                   ing them both to the original data set and to the data set in which some of the attributes
                   have been discretized. The best transformation in terms of accuracy for our analysis was
                   the one in which the avg_grade and tot_c f u attributes were discretized in 3 and 5 ranges,
                   respectively, by using WEKA filters, as reported in Table 2. The pre-processing phase is
                   fundamental in any data mining analysis and in particular the discretization of continuous
                   variables is very important. The intervals chosen are the result of various tests carried out
                   with WEKA in which we tried to take into account the distribution of the values. Obviously
                   we are not saying that this is always the choice to make, and with different data other
                   discretizations could be more effective.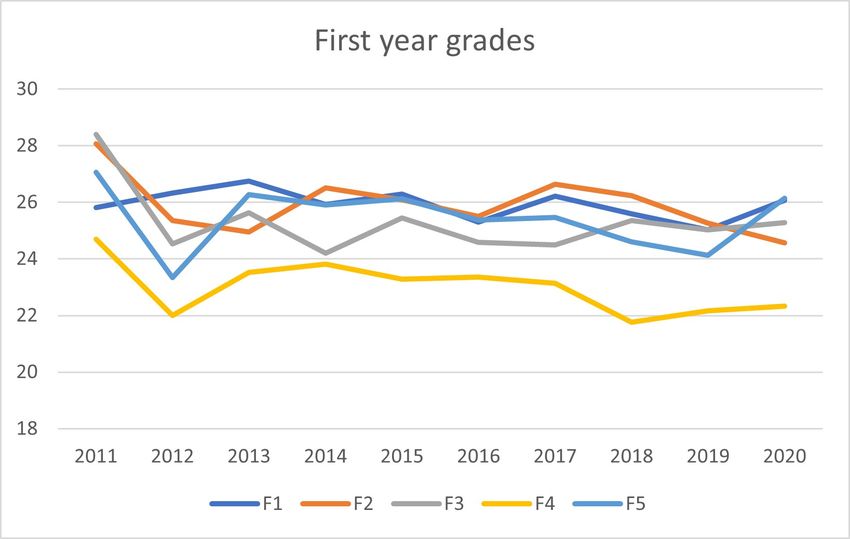
Data 2022, 7, 14                                                                                                        8 of 15

                   Table 2. Discretization ranges for avg_grade and tot_c f u attributes obtained with WEKA filters.

                                       avg_grade                                            tot_c f u
                    L                         [20.54–23.86]             xs                        [12–204]
                    M                         (23.86–27.18]             s                         (204–396]
                    H                         (27.18–31]                m                         (396–588]
                                                                        l                         (588–780]
                                                                        xl                        (780–972]

                         We compared the various algorithms by using evaluation on the training set since
                   we are interested to understand how the model fits our data set and which records are
                   wrongly classified; in particular, we compared the algorithms J48, NaiveBayes, and IBk
                   with k = 2 and 3. In Table 3 we give the results achieved by each of these algorithms,
                   according to some of the most common evaluation metrics, such as the percentage of
                   correctly classified records, precision, recall, Fmeasure and area under the ROC. In Table 4
                   we give the evaluation metrics with the hold-out technique (with 66% for training and 33%
                   for testing).

                   Table 3. Results achieved by various classification algorithms with evaluation on the training set.

                                                J48             NaiveBayes               IB2                      IB3
                        % Correct              74.03                59.09               81.16                  75.97
                        Precision               0.73                 0.59                0.84                   0.76
                         Recall                 0.74                 0.59                0.81                   0.76
                        FMeasure                0.72                 0.58                0.78                   0.75
                        ROC area                0.89                 0.74                0.95                   0.92

                   Table 4. Results achieved by various classification algorithms with hold-out evaluation.

                                                J48             NaiveBayes               IB2                      IB3
                        % Correct              53.85                51.92               55.77                  55.77
                        Precision               0.56                 0.53                0.54                   0.58
                         Recall                 0.54                 0.52                0.56                   0.56
                        FMeasure                0.54                 0.52                0.54                   0.56
                        ROC area                0.68                 0.65                0.76                   0.79

                         Since J48 performs quite well compared to the other algorithms and the model is
                   represented by an easy-to-interpret decision tree, we decided to investigate this model
                   in more depth. For the purposes of our work, we need to know the training error on the
                   entire data set and to understand which records are wrongly classified. The decision tree is
                   illustrated in Figure 6 and classifies correctly ≈74% of the 154 instances; the corresponding
                   confusion matrix can be found in Table 5.

                   Table 5. Confusion matrix corresponding to the decision tree in Figure 6.

                        Actual/Predicted                   I                      II                          III
                               I                        37                         7                          6
                               II                          4                      66                          2
                              III                          7                      14                          11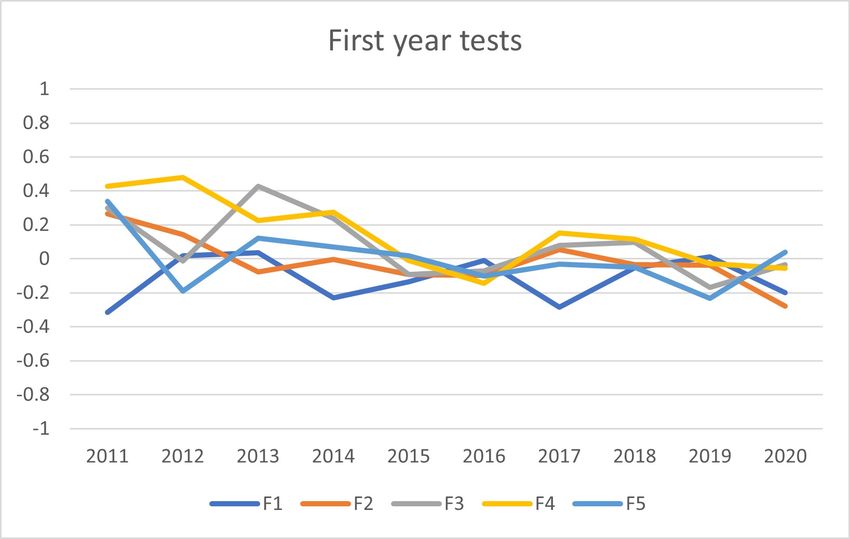
Data 2022, 7, 14                                                                                                             9 of 15

                   Figure 6. Classification with J48 algorithm: correctly classified instances 74%.

                         The model incorrectly classifies ≈17% of the instances. In particular, seven instances of
                   class I are classified in class II, and six instances of class I are classified in class III. Moreover,
                   four instances of the class II are classified in class I, and two instances of the class II are
                   classified in class III. Seven instances of class III are classified in class I, and, finally, fourteen
                   in class II; all these are illustrated in Table 6.

                   Table 6. Wrong classifications corresponding to Figure 6: For each course the actual and predicted
                   teaching years are given.

                    Course                                                                              Actual   Predicted
                    F41 , F51 , F32 , F42 , F45 , F36 , F48                                               I         II
                    F21 , F31 , F52 , F43 , F44 , F49                                                     I         III
                    S84 , S88 , S50 , S60                                                                 II         I
                    S32 , S23                                                                             II        III
                    T45 , T16 , T46 , T47 , T48 , T19 , T49                                              III         I
                    T13 , T23 , T33 , T14 , T24 , T34 , T56 , T57 , T58 , T59 , T10 , T30 , T40 , T50    III        II

                        From Table 6, we see that the courses F3 , F4 , T1 , T4 and T5 are the worst classified over
                   the years. The result relative to F3 and F4 is not surprising since they are courses having
                   a small number of exams and low grades, as illustrated in Figure 2. It is interesting to
                   note also that the students who took those exams are characterized by test results over
                   the average value, as indicated in Figure 5. This fact shows evidence that these exams
                   constitute an obstacle for students and are taken by a small number of them and with
                   low grades, despite having a fairly good initial level preparation. Vice versa, concerning
                   exams T4 and T5 we note that they are taken by many students and with good grades,
                   characteristics more similar to II teaching years. The T1 course is classified several times as
                   a course of a previous year and in almost all cases it has associated a rather high number of
                   exams, comparable to courses of the I and II years, probably due to the particular method
                   of carrying out the corresponding exam.
                        Looking at the decision tree carefully, we see that there are two splits in the tree
                   involving the average grade on the entry test, which give rise to some training errors. We,
                   therefore, decided to investigate the corresponding records in more detail. The three badly
                   classified records with avg_test ≤ 0.31 correspond to the courses F21 , F31 and S32 , char-
                   acterized by a small number of credits, a quite high average grade and with an avg_test
                   value which is very close to split value 0.31; the badly classified record with avg_test
                   > 0.31 is T33 . In the set of the three badly classified records that correspond to the split
                   avg_test≤ 0.01 we find F36 , T10 and T40 , all with a test grade lower than the average value.
                   Finally, in the leaf corresponding to avg_test> 0.01 we find T19 , T46 and T49 . In general, we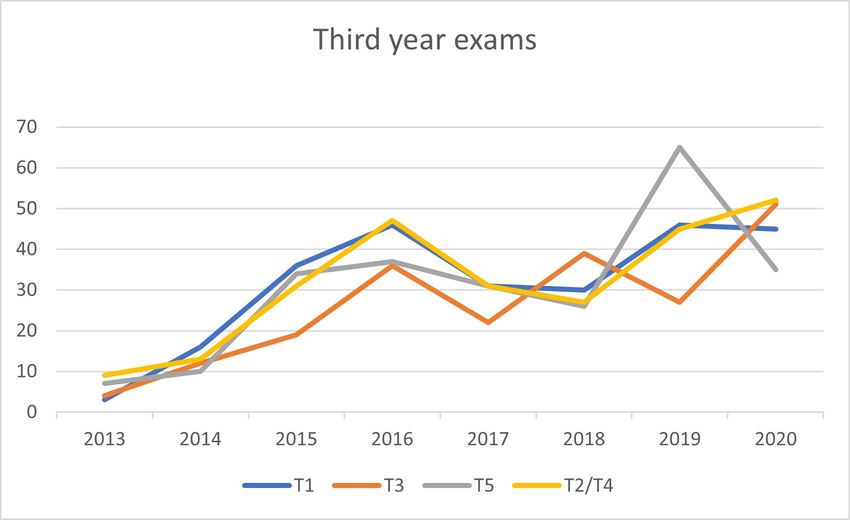
Data 2022, 7, 14                                                                                            10 of 15

                   believe that the value of the entrance test can give us indications regarding the productivity
                   of the I year, so the previous errors identified on the splits that use the value of the test
                   do not give us relevant information since they almost exclusively involve III year exams
                   that are classified as exams of previous years. The only I year courses involved in these
                   leaves are Calculus, F2 , with an above-average test grade, and the Computer Architecture
                   course, F3 , which appears with both above and below-average test grades. As far as F2 is
                   concerned, the same considerations already made for the F4 course can be made, i.e., in
                   the year 2011 that exam was taken by a few students who started from a rather high test
                   grade and reached a high grade. Regarding the II year courses, the classification does not
                   highlight particular problems, since only S23 and S32 are sporadically classified as III year
                   exams.
                        The number of girls who enroll in Computer Science is very low, and for this reason
                   we decided to make a separate analysis for them. In particular, we built a new classification
                   tree by examining only the 864 exams taken by girls; however, this analysis did not reveal
                   substantial differences.
                        We think that the results of the proposed classifications are interesting from a de-
                   scriptive point of view because they highlight which courses over the years have created
                   more difficulties for students: courses of I and II year erroneously classified as courses of
                   subsequent years point out critical issues; vice versa, II and III year courses erroneously
                   classified as courses of previous years indicate that students have no particular difficulty in
                   taking the corresponding exams.

                   3.2. Descriptive Hierarchical Clustering
                        In our second study, data were aggregated with respect to the course and clustered
                   with hierarchical clustering according to attributes average number of exams, average grade
                   and the number of credits assigned to a given course; the des attribute was used for labeling
                   the tree leaves while the class attribute teaching_year has been used to test the model on
                   classes to clusters evaluation mode. The data set contains 17 instances, one for each course
                   (courses T2 and T4 have been merged). Courses are studied on the basis of the average
                   number of exams taken each year, therefore taking into account the number of years of
                   activation of the course (10, 9 and 8 for I, II and III teaching years, respectively). Remember,
                   however, that the number of students over the years changes, due to the dispersion already
                   highlighted in the introduction, so the most correct comparison is always the one at the
                   level of courses of the same year. Although the number of records is small, we think
                   that from a descriptive point of view the hierarchical clustering can provide evidence of
                   interesting similarities among courses.
                        More precisely, in this second study we consider a data set with attributes:
                   •    teaching_year: I, II and III;
                   •    des: the description of a course given in Table 1;
                   •    avg_exam: average number of exams in a calendar year for a given course;
                   •    avg_grade: average grade of the exams taken in a calendar year for a given course;
                   •    c f u: number of credits assigned to a given course.
                         In Figure 7, the dendrograms corresponding to hierarchical clustering algorithms with
                   single link and group average strategies are illustrated, while Tables 7 and 8 show the
                   confusion matrices corresponding to classes to clusters evaluation mode. Looking at these
                   figures, the following comments come to mind: in both analyses, the F1 , F2 and F5 exams
                   are indicated as similar and in fact they are first year exams that are often taken together,
                   for first and with similar results. Somehow they constitute the first choices of exams that
                   are faced. The F3 exam belongs to the same group but in both dendrograms (a) and (b)
                   it is added last, as seen from the height of the corresponding branch, denoting a lower
                   similarity with the other members of the cluster. Exam F4 , on the other hand, is aggregated
                   to the second year exams S3 , S5 , S6 and S8 but added last to the group. Since the number
                   of students decreases from the first to the second year and from the second to the third
                   year, the exams that are assimilated with exams of subsequent years are usually made by
Data 2022, 7, 14 11 of 15
fewer students. Therefore, this analysis also presents evidence of some critical issues for
the F4 course when compared to the other courses of I teaching year. The remaining second
year courses, S1 , S2 , S4 and S7 , are grouped with third year courses: three of them are math
courses, somehow more advanced than, for example, F2 . According to the link strategy,
they are all classified as III (a) or II (b) years courses; however, in the dendrogram (b) the III
cluster contains only the course T5 which, therefore, shows different behavior from all the
other courses of the same teaching year.
(a) (b)
Figure 7. Single link (a) and group average (b) clustering with respect to attributes avg_exam,
avg_grade and c f u.
Table 7. Confusion matrix corresponding to the dendrogram in Figure 7a.
Actual/Predicted I II III
I 4 1 0
II 0 4 4
III 0 0 4
Table 8. Confusion matrix corresponding to the dendrogram in Figure 7b.
Actual/Predicted I II III
I 4 1 0
II 0 8 0
III 0 3 1
The same analysis has been repeated considering only the exams taken by female
students without highlighting different characteristics.
4. Heat Maps for Courses Taken by Graduated Students
This section examines the careers of students who have finished their studies and
graduated by December 2020. Students were grouped by year of enrollment, and the order
in which they took exams throughout their career was examined.
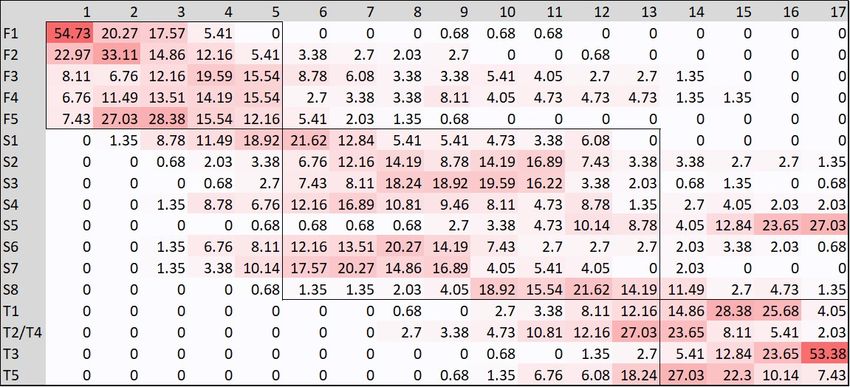
As a result, 17 exams shared by all students were taken into consideration and a
Ei,j i,j=1,..,17 matrix was constructed for each cohort, such that the Ei,j element represents
the percentage of students who took the exam i as j-th exam in their career. The matrices
were then represented as heat maps in order to highlight the percentage values. We also
built a matrix summarizing these data for all cohorts, as illustrated in Figure 8. The virtuous
path of a student who takes the exams of the first year before those of the second and the
latter before those of the third year has been highlighted with rectangles. The values outside
these rectangles represent exams taken in a different order from those planned by the course
of study. High values of the percentages outside the rectangles may indicate critical issuesData 2022, 7, 14 12 of 15
because a student delays an exam of a certain teaching year or anticipates it to the detriment
of other exams from previous years. Within each rectangle are enclosed exams of the same
year, which can be taken in any order and it is possible to see how the students decide
to distribute the exams of the same year. Concerning Figure 8, and looking at the I year
courses, we can observe that F1 , F2 and F5 are exams taken first and exactly in this order—
yet another confirmation of the fact that these courses do not seem to create difficulties
for students. With regard to the second year courses, the figure shows a propensity of
students to delay the S5 exam; since it corresponds to the Physics course, this result is also
not surprising, as these are basic topics in which students are often less interested than
the most characteristic topics of the study path. Finally, among the courses of the third
year stands T3 , Theoretical Computer Science, which is very frequently taken as the last
exam; also in this case it is a course considered difficult by the students because it is very
theoretical.
Figure 8. Heat map for graduated students of all cohorts.
By analyzing the maps of the individual cohorts, we find results that in some cases
differ from the considerations we have made in general, although highlighting the same
criticalities more or less clearly. For example, the map for cohort 2010 in Figure 9 shows
that the S5 exam was often taken as the last exam, while Figure 10 shows that most of the
students of cohort 2013 took T3 as their last exam.
Figure 9. Heat map for graduated students of cohort 2010.Data 2022, 7, 14 13 of 15
Figure 10. Heat map for graduated students of cohort 2013.
Figure 11 represents the students of the 2017 cohort who graduated within the time
allowed for the course of study and highlights rather virtuous behaviors since, outside
the rectangles, there are a few non-zero values, confirming the fact that the students who
graduated earlier took the exams following the order suggested by the degree course.
Figure 11. Heat map for graduated students of cohort 2017.
5. Conclusions
In this work, we proposed a reproducible methodology to analyze exams data of
a Computer Science degree, to identify courses that highlight exceptions, which can be
translated as critical points, in the progression of the students’ careers. For the years under
analysis, from 2011 to 2020, we aggregated the data of the exams of the first, second and
third year, in terms of the average grade, credits acquired and average mark at the entrance
test, calculated on the students who have passed the corresponding exams. We started
our study with a pre-processing and data understanding phase, by visualizing the courses
characteristics as times series. Then we conduced a descriptive analysis with data mining
algorithms to reinforce and confirm the previous results. In particular, the analysis was
initially performed with classification techniques—such as decision trees, Naive Bayes
and IBk algorithms—on the data obtained aggregating year by year and course by course;
the second analysis, carried out on the data aggregated with respect to the course, was
realized using hierarchical clustering. By a post-processing phase of classification results,
we analyzed data concerning misclassifications and identified anomalous behaviors in
some courses compared to those of the same year: this happens, for example, for the
first year courses F3 and F4 . With clustering we identified courses groups with similar
characteristics. Among these, the three courses F1 , F2 and F5 are well classified in the
same group of first year courses while F4 is more similar to courses in subsequent years.
The analysis revealed no differences based on the gender of the students who took theData 2022, 7, 14 14 of 15
exams. The last part of our study focuses on the sequence in which the exams were taken
by graduate students, highlighting the courses that students tend to postpone or take first.
The exams that are taken last correspond to courses that are more difficult and/or less
interesting for the students.
During our study we also tried to perform an associative analysis using the Apriori
algorithm. We used in particular the version of the algorithm available in WEKA that allows
to mine class association rules and applied it to a data set with the attributes avg_grade
and tot_c f u discretized as in Table 2 and in binary form, by specifying as class attribute
teaching_year once again. The rules obtained are not particularly interesting, for example
one with greatest support is
((tot_c f u = l ) or (tot_c f u = xl )) and ( avg_grade = M) → (teaching_year = I )
verified by 24 first year courses over time. We think this type of analysis is best suited when
the target variables are students instead of courses.
Beyond the specific results of our analysis, we believe that the proposed methodology
is easily reproducible and can also be applied in contexts other than Computer Science,
thanks to the simplicity of the proposed coding (see Table 1), provided that the organization
is similar to that presented in this paper. The identification of the courses that present
critical issues allow to analyze them and implement policies to improve the training process.
For example, by intercepting courses that students tend to postpone, actions could be taken
to prevent a student from becoming discouraged and dropping out.
Author Contributions: Conceptualization, D.M. and M.C.V.; methodology, D.M. and M.C.V.; data
curation, R.C. and D.M.; writing—review and editing, R.C., D.M. and M.C.V.; supervision, D.M. and
M.C.V. All authors have read and agreed to the published version of the manuscript.
Funding: This work was not supported by any funding, but is the result of ordinary research by the
authors supported by their institution.
Institutional Review Board Statement: Not applicable.
Informed Consent Statement: Not applicable.
Data Availability Statement: Data are described in the article.
Acknowledgments: The authors of this paper would like to thank the editor and the reviewers for
their helpful comments.
Conflicts of Interest: The authors declare no conflict of interest.
References
1. Baker, R.S.J.D. Educational data mining: An advance for intelligent systems in education. IEEE Intell. Syst. 2014, 29, 78–82.
[CrossRef]
2. Bakhshinategh, B.; Zaiane, O.R.; ElAtia, S.; Donald, I. Educational data mining applications and tasks: A survey of the last
10 years. Educ. Inf. Technol. 2018, 23, 537–553. [CrossRef]
3. Pena-Ayala, A. Educational data mining: A survey and a data mining-based analysis. Expert Syst. Appl. 2014, 41, 1431–1462.
[CrossRef]
4. Romero, C.; Ventura, S. Data mining in education. In WIREs Data Mining and Knowledge Discovery; John Wiley & Sons: Hoboken,
NJ, USA, 2013, 3, 12–37.
5. Romero, C.; Ventura, S. Educational data mining and learning analytics: An updated survey. In WIREs Data Mining and Knowledge
Discovery; John Wiley & Sons: Hoboken, NJ, USA, 2020; Volume 10.
6. Campagni, R.; Merlini, D.; Sprugnoli, R.; Verri, M.C. Data Mining models for student careers. Expert Syst. Appl. 2015,
42, 5508–5521. [CrossRef]
7. Kinnebrew, J.S.; Loretz, K.M.; Biswas, G. A contextualized, differential sequence mining method to derive students’ learning
behavior patterns. JEDM-J. Educ. Data Min. 2013, 5, 190–210.
8. Lykourentzou, I.; Giannoukos, I.; Nikolopoulos, V.; Mpardis, G.; Loumos, V. Dropout prediction in e-learning courses through
the combination of machine learning techniques. Comput. Educ. 2009, 53, 950–965. [CrossRef]
9. Miller, L.D.; Soh, L.K.; Samal, A.; Kupzyk, K.; Nugent, G. A comparison of educational statistics and data mining approaches to
identify characteristics that impact online learning. JEDM-J. Educ. Data Min. 2015, 7, 117–150.Data 2022, 7, 14 15 of 15
10. Romero, C.; Ventura, S.; Salcines, E. Data mining in course management systems: moodle case study and tutorial. Comput. Educ.
2008, 51, 368–384. [CrossRef]
11. Agrawal, R.; Gollapudi, S.; Kannan, A.; Kenthapadi, K. Study navigator: An algorithmically generated aid for learning from
electronic textbooks. JEDM-J. Educ. Data Min. 2014, 6, 53–75.
12. Knowles, J.E. Of needles and haystacks: Building an accurate statewide dropout early warning system in Wisconsin. JEDM-J.
Educ. Data Min. 2015, 7, 18–67.
13. Morsy, S.; Karypis, G. Will this Course Increase or Decrease Your GPA? Towards Grade-aware Course Recommendation. J. Educ.
Data Min. 2019, 11, 20–46.
14. Romero, C.; Ventura, S. Educational Data Mining: A Review of the State of the Art. IEEE Trans. Syst. Man, Cybern. Appl. Rev.
2010, 40, 601–618. [CrossRef]
15. Hernández-Blanco, A.; Herrera-Flores, B.; Tomás, D.; Navarro-Colorado, B. A Systematic Review of Deep Learning Approaches
to Educational Data Mining. Complexity 2019, 2019, 1–22. [CrossRef]
16. Romero, C.; Romero, J.R.; Ventura, S. A Survey on Pre-Processing Educational Data. Stud. Comput. Intell. 2014, 524, 29–64.
17. Campagni, R.; Merlini, D.; Verri, M.C. An Analysis of Courses Evaluation Through Clustering. In Communications in Computer
and Information Science; Springer International Publishing: Berlin/Heidelberg, Germany, 2015; Volume 510, pp. 211–224.
18. Campagni, R.; Merlini, D.; Verri, M.C. The influence of first year behaviour in the progressions of university students. In Commu-
nications in Computer and Information Science; Springer International Publishing: Berlin/Heidelberg, Germany, 2018; pp. 343–362.
19. Bhutto, E.S.; Siddiqui, I.F.; Arain, Q.A.; Anwar, M. Predicting Students’ Academic Performance Through Supervised Machine
Learning. In Proceedings of the 2020 International Conference on Information Science and Communication Technology (ICISCT),
Karachi, Pakistan, 8–9 February 2020; pp. 1–6.
20. Gutenbrunner, T.; Leeds, D.D.; Ross, S.; Riad-Zaky, M.; Weiss, G.M. Measuring the Academic Impact of Course Sequencing using
Student Grade Data. In Proceedings of the Educational Data Mining 2021, Paris, France, 29 June–2 July 2021 .
21. Wong, C. Sequence Based Course Recommender for Personalized Curriculum Planning. In Artificial Intelligence in Education;
Springer International Publishing: Berlin/Heidelberg, Germany, 2018; pp. 531–534.
22. Heileman, G.L.; Abdallah, C.T.; Slim, A.; Sirhan, N. Restructuring Curricular Patterns Using Bayesian Networks. Educ. Data Min.
2021, 2021, 1–4.
23. Beaubouef, T.; Mason, J. Why the high attrition rate for computer science students: some thoughts and observations. ACM
SIGCSE Bull. 2005, 37, 103–106. [CrossRef]
24. Tan, P.N.; Steinbach, M.; Kumar, V. Introduction to Data Mining; Addison-Wesley: Boston, MA, USA , 2006.
25. Romero, C.; Zafra, A.; Luna, J.M.; Ventura, S. Association rule mining using genetic programming to provide feedback to
instructors from multiple-choice quiz data. Expert Syst. 2013, 30, 162–172. [CrossRef]
26. Hsia, T.C.; Shie, A.J.; Chen, L.C. Course planning of extension education to meet market demand by using data mining
techniques-an example of Chinkuo technology university in Taiwan. Expert Syst. Appl. 2008, 34, 596–602. [CrossRef]
27. Delavari, N.; Phon-Amnuaisuk, S.; Beikzadeh, M.R. Data Mining Application in Higher Learning Institutions. Inform. Educ. 2008,
7, 31–54. [CrossRef]
28. Huang, C.T.; Lin, W.T.; Wang, S.T.; Wang, W.S. Planning of educational training courses by data mining: Using China Motor
Corporation as an example. Expert Syst. Appl. 2009, 36, 7199–7209. [CrossRef]
29. de Oliveira, C.F.; Sobral, S.R.; Ferreira, M.J.; Moreira, F. How Does Learning Analytics Contribute to Prevent Students’ Dropout
in Higher Education: A Systematic Literature Review. Big Data Cogn. Comput. 2021, 5, 64. [CrossRef]You can also read