Analysis of miRNAs Profiles in Serum of Patients With Steatosis and Steatohepatitis - Frontiers
←
→
Page content transcription
If your browser does not render page correctly, please read the page content below
ORIGINAL RESEARCH
                                                                                                                                   published: 09 September 2021
                                                                                                                                   doi: 10.3389/fcell.2021.736677

                                            Analysis of miRNAs Profiles in Serum
                                            of Patients With Steatosis and
                                            Steatohepatitis
                                            Maria Vulf 1* , Daria Shunkina 1 , Aleksandra Komar 1 , Maria Bograya 1 , Pavel Zatolokin 1 ,
                                            Elena Kirienkova 1 , Natalia Gazatova 1 , Ivan Kozlov 2 and Larisa Litvinova 1
                                            1
                                             Center for Immunology and Cellular Biotechnology, Immanuel Kant Baltic Federal University, Kaliningrad, Russia,
                                            2
                                             Department of Organization and Management in the Sphere of Circulation of Medicines, Institute of Postgraduate
                                            Education, I.M. Sechenov Federal State Autonomous Educational University of Higher Education—First Moscow State
                                            Medical University of the Ministry of Health of the Russian Federation (Sechenov University), Moscow, Russia

                                            Non-alcoholic fatty liver disease (NAFLD) is emerging as one of the most common
                                            chronic liver diseases worldwide, affecting 25% of the world population. In recent years,
                                            there has been increasing evidence for the involvement of microRNAs in the epigenetic
                                            regulation of genes taking part in the development of steatosis and steatohepatitis—two
                                            main stages of NAFLD pathogenesis. In the present study, miRNA profiles were studied
                      Edited by:            in groups of patients with steatosis and steatohepatitis to compare the characteristics of
              Anastasia Efimenko,
                                            RNA-dependent epigenetic regulation of the stages of NAFLD development. According
Lomonosov Moscow State University,
                           Russia           to the results of miRNA screening, 23 miRNAs were differentially expressed serum in a
                       Reviewed by:         group of patients with steatohepatitis and 2 in a group of patients with steatosis. MiR-
                        Yusuf Yilmaz,       195-5p and miR-16-5p are common differentially expressed miRNAs for both steatosis
          Marmara University, Turkey
                        Yuriy L. Orlov,     and steatohepatitis. We analyzed the obtained results: the search for target genes for the
   I.M. Sechenov First Moscow State         differentially expressed miRNAs in our study and the subsequent gene set enrichment
           Medical University, Russia
                                            analysis performed on KEGG and REACTOME databases revealed which metabolic
                 *Correspondence:
                                            pathways undergo changes in RNA-dependent epigenetic regulation in steatosis and
                          Maria Vulf
                mary-jean@yandex.ru         steatohepatitis. New findings within the framework of this study are the dysregulation
                                            of neurohumoral pathways in the pathogenesis of NAFLD as an object of changes in
                    Specialty section:
         This article was submitted to
                                            RNA-dependent epigenetic regulation. The miRNAs differentially expressed in our study
    Molecular and Cellular Pathology,       were found to target 7% of genes in the classic pathogenesis of NAFLD in the group
                a section of the journal    of patients with steatosis and 50% in the group of patients with steatohepatitis. The
  Frontiers in Cell and Developmental
                                Biology     effects of these microRNAs on genes for the pathogenesis of NAFLD were analyzed in
            Received: 05 July 2021          detail. MiR-374a-5p, miR-1-3p and miR-23a-3p do not target genes directly involved
        Accepted: 10 August 2021            in the pathogenesis of NAFLD. The differentially expressed miRNAs found in this
     Published: 09 September 2021
                                            study target genes largely responsible for mitochondrial function. The role of miR-423-
                             Citation:
       Vulf M, Shunkina D, Komar A,
                                            5p, miR-143-5p and miR-200c-3 in regulating apoptotic processes in the liver and
Bograya M, Zatolokin P, Kirienkova E,       hepatocarcinogenesis is of interest for future experimental studies. These miR-374a,
Gazatova N, Kozlov I and Litvinova L        miR-143, miR-1, miR-23a, and miR-423 have potential for steatohepatitis diagnosis
  (2021) Analysis of miRNAs Profiles
 in Serum of Patients With Steatosis        and are poorly studied in the context of NAFLD. Thus, this work opens up prospects for
                 and Steatohepatitis.       further studies of microRNAs as diagnostic and therapeutic biomarkers for NAFLD.
     Front. Cell Dev. Biol. 9:736677.
     doi: 10.3389/fcell.2021.736677         Keywords: miRNA, mRNA, NAFLD, steatosis, NASH, GSEA, KEGG, REACTOME

Frontiers in Cell and Developmental Biology | www.frontiersin.org                1                                     September 2021 | Volume 9 | Article 736677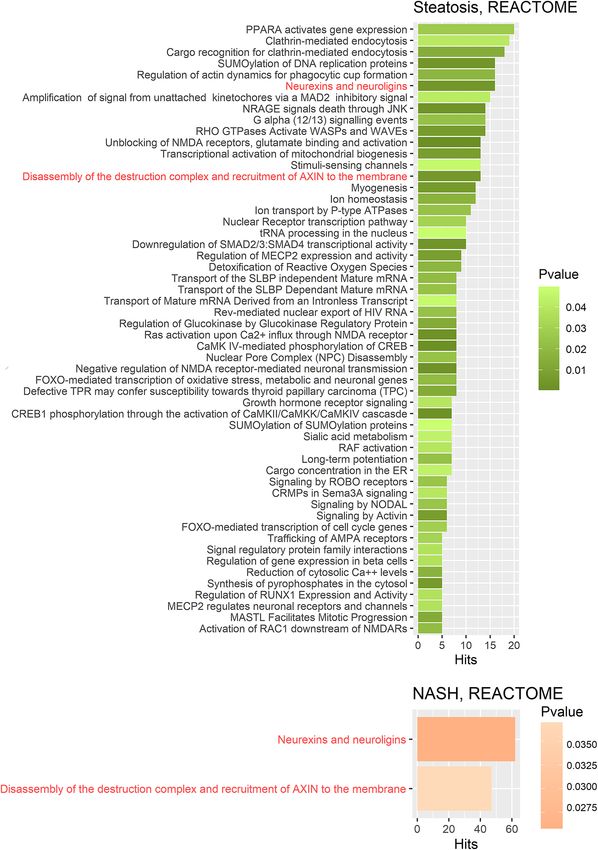
Vulf et al. Analysis miRNAs in Serum
INTRODUCTION developing complications of this pathology remains at a high
level. Therefore, it is important to study the molecular basis
Currently, non-alcoholic fatty liver disease (NAFLD) is emerging of this disease.
as one of the most common chronic liver diseases worldwide, The present study aims to compare miRNA profiles in
affecting 25% of the world population, with the highest patients with steatosis and steatohepatitis using bioinformatics
prevalence in the Middle East and South America (Younossi et al., and experimental methods and assess their effect on
2019). The prevalence of NAFLD in the population ranges from NAFLD progression.
6.3 to 33.0%, with a higher prevalence in obese individuals (up
to 62–93%). NAFLD currently occupies a leading place among
internal diseases of Russian Federation (Lazebnik et al., 2021). In MATERIALS AND METHODS
Russia, the prevalence of NAFLD among the adult population is
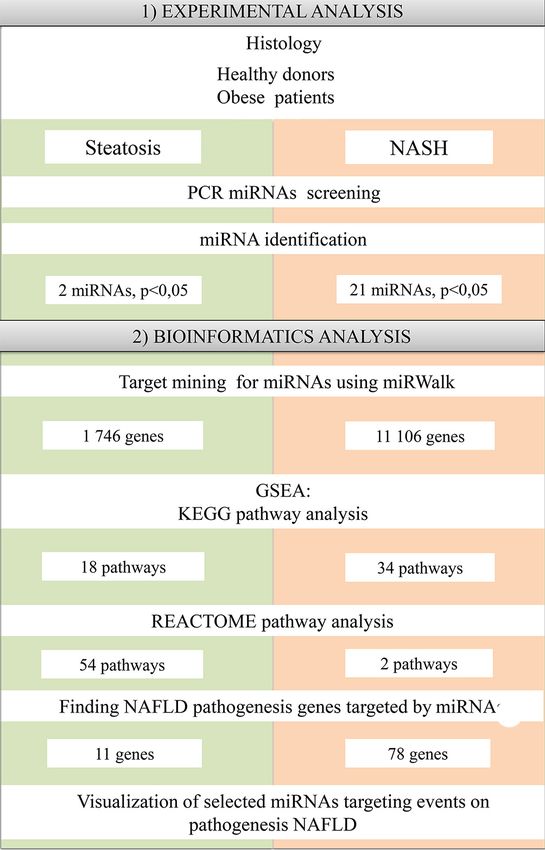
37% (Maev et al., 2019). Sixteen patients aged 18 to 65 years (37.7 ± 9.7 years;
Non-alcoholic fatty liver disease is a disease spectrum that seven men, nine women) were included in the study. eight
initially develops from hepatic steatosis and progresses to patients with morbid obesity were diagnosed with NAFLD with
non-alcoholic steatohepatitis (NASH), cirrhosis, and eventually steatosis/NASH (42.6 ± 9.9 years; five men, seven women).
hepatocellular carcinoma (HCC). NAFLD is characterized by the These samples were compared with four healthy donors
accumulation of fatty deposits in the hepatocyte parenchyma (32.5 ± 9.5 years; two men, two women) (Table 1). Exclusion
caused by increased triglyceride (TG) formation against a criteria were: age up to 18 years and over 65 years; the
background of elevated free fatty acids (FFA) and impaired presence of infectious liver disease; acute and severe chronic
regulation of de novo lipogenesis. Excessive FFA accumulation somatic and infectious concomitant diseases; long-term use of
provokes oxidative stress and increases the content of reactive lipid-lowering drugs; and patients who refused medical and
oxygen and nitrogen species. Formation of lobular inflammation laboratory controls during the study. Patients were monitored
and hepatocellular ballooning are signs of the NASH stage. in a hospital (Regional Clinical Hospital of Kaliningrad Region).
Against the background of the inflammatory response, hepatic According to the DEBQ Dutch Eating Behavior Questionnaire,
stellate cells (HSCs) are activated and transformed into patients provided information about their diet (van Strien et al.,
myofibroblasts, leading to liver fibrosis (Gazatova et al., 2019). 1986). Patients underwent standard dietary adjustments prior
Numerous factors are involved in the pathogenesis of NAFLD. to surgery as all obese patients underwent bariatric surgery
However, the complete picture of NAFLD development and while the healthy donors underwent elective surgery with general
the transition mechanisms from steatosis to NASH are not yet anesthesia. According to the Moorehead-Ardelt Quality of Life
fully understood. Questionnaire II, the obese patients had low activity levels (Myers
Non-alcoholic fatty liver disease is nowadays diagnosed by et al., 2006). A blood sample is taken in the morning on an empty
invasive methods (e.g., histological), the diagnostic accuracy of stomach before surgery. A block diagram of the study design is
minimally invasive methods is not optimal (Lackner, 2021). shown in Figure 1.
In the later stages of NAFLD, it is only possible to slow but All study participants gave informed consent to participate in
not prevent the transformation to HCC, which requires liver the study. The study was conducted in accordance with the World
transplantation. Researchers predict that HCC will be the leading Medical Association Declaration of Helsinki (2000) and the
cause of liver transplantation worldwide by 2025 (Llovet et al., Protocol to the Convention on Human Rights and Biomedicine
2021). In fact, from 2002 to 2016, the proportion of liver (1999). Local Ethics Committee of the Immanuel Kant Baltic
transplants caused by NAFLD and its complications increased Federal University, Protocol No. 4 of November 29, 2018.
from 1.2 to 8.4% of all liver transplants (Haldar et al., 2019).
Because NAFLD ultimately leads to disability and imposes a Histological Analysis
major socioeconomic burden, timely diagnosis and effective Histological analysis of liver biopsies was performed to confirm
treatment of NAFLD is particularly important. steatosis and NASH. Liver biopsies obtained intraoperatively by
One of the significant diagnostic as well as therapeutic targets incisional biopsy from the left lobe of the liver were fixed in
for NAFLD are small non-coding RNAs (ncRNAs). Thousands neutral buffered formalin. Paraffin sections of the liver with a
of them have been found in the human genome, including thickness of 4–5 µm, stained with hematoxylin and eosin, were
microRNAs (miRNAs). MiRNAs are small non-coding 21– studied by traditional histological examination using a Leica
23 nucleotide long molecules involved in post-transcriptional DM3000 microscope (Leica Microsystems, Wetzlar, Germany)
regulation of gene expression (Skuratovskaia et al., 2019). These for semi-quantitative assessment of the degree of obesity and
RNAs consist of an inactive sense strand complementary to inflammation. The examined biopsies contained at least four
the target mRNA sequence and an active antisense strand portal tracts and were informative. The diagnosis of steatosis
(Rana, 2007). was made depending on the morphological changes in the
The use of ncRNAs is a promising epigenetic approach to hepatic acinus. The diagnosis of NASH was made in presence
target the major factors influencing the development of NAFLD: of hepatic fat infiltration together with lobular inflammation
impaired lipid and carbohydrate metabolism, the development and hepatocyte ballooning. To assess steatosis, a semiquantitative
of oxidative stress, and chronic subclinical inflammation. evaluation of morphological changes in the liver was performed
Despite the wide range of drugs on the market, the risk of by examining digital images of biopsies obtained by scanning
Frontiers in Cell and Developmental Biology | www.frontiersin.org 2 September 2021 | Volume 9 | Article 736677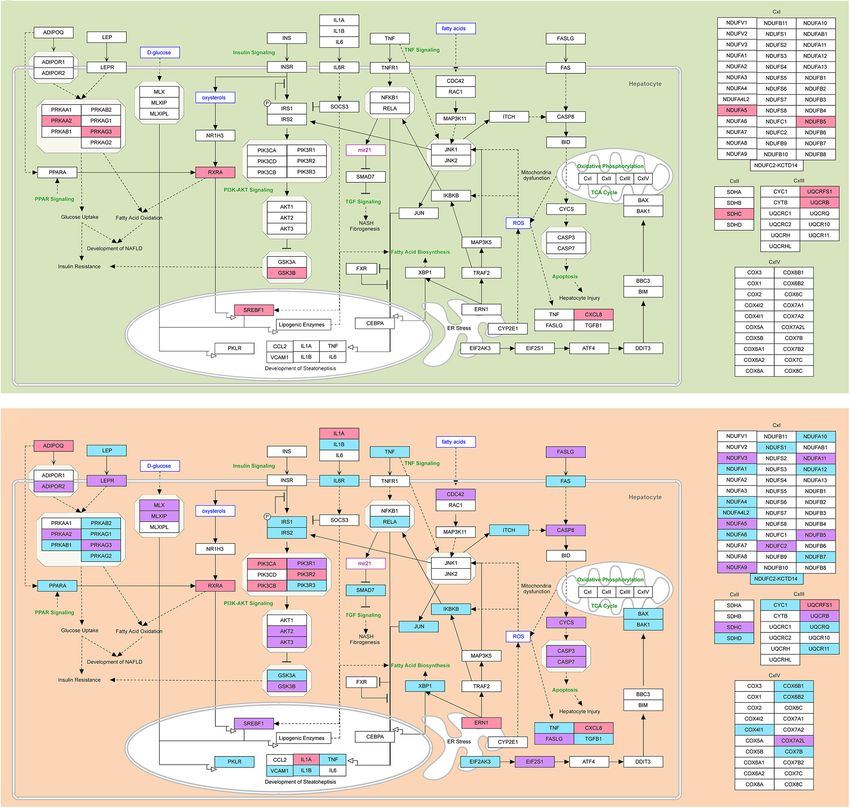
Vulf et al.                                                                                                                                 Analysis miRNAs in Serum

TABLE 1 | Characteristics of patients in the study.

                    Healthy donors,       Group of patients Group of patients
                         n=4               with steatosis,  with NASH, n = 6
                                                n=6

                             1                        2                  3

Sex (female/male)           2/2                   3/3                    4/2
Age                    32.50 ± 9.50         41.75 ± 9.91            43.50 ± 11.50
BMI, kg/m2                                  51.05 ± 10.04           42.95 ± 4.67
                       21.88 ± 0.66            p 1-2**                p 1-3***

**p < 0.001, ***p < 0.0001; significance was determined using the t-test
(mean ± SD).

histological sections with a Pannoramic 250 FLASH scanning
microscope (3DHISTECH, Hungary, Budapest) and Image-J
software (ImageJ Wiki, 2021).

MiRNA PCR Array Analysis
Serum samples were aliquoted into 500 µl each on the collection
day and stored at −80◦ C until later use. According to the
manufacturer’s protocol, total RNA, including miRNA, was
isolated from 100 µl of serum using MagMAX mirVana Total
RNA Isolation Kit (Thermo Fisher Scientific, United States). All
isolation steps were performed on a cooling plate. Total RNA
was eluted with 50 µl RNAse-free water; the initial concentration
range was 8–25 ng/µl. Samples were stored at −70◦ C until PCR.
Before PCR, the quality and fidelity of the RNA were checked.
According to the manufacturer’s protocol, Reverse transcription
was performed using the miScript II RT Kit (Qiagen, GmbH).
12 µl total RNA, nucleotide mixture and reverse transcriptase
were added to HiSpec buffer (Qiagen, GmbH) to a final volume of
                                                                                         FIGURE 1 | Schematic representation of the study design.
20 µl. The mixture was incubated for 60 min at 37◦ C, and 5 min
at 95◦ C to inactivate miScript II RT Kit reverse transcriptase.
90 µl RNAse-free water was added to each 20 µl of reverse
transcription reaction, and 100 µl diluted cDNA was used to                             Data Analysis Tool software (Qiagen, Hilden, Germany), in
make a reaction mix according to the manufacturer’s protocol.                           which the qRT-PCR modules convert the threshold cycle (Ct)
   Expression profiling analysis was performed using the                                values into the calculated results for miRNA expression and
miScript miRNA PCR kit (MIHS-106Z, Qiagen, GmbH). The                                   also via the comparative Ct method by 2−11Ct. three samples
miRNA PCR arrays were performed using a CFX96 (Bio-Rad,                                 were excluded because they did not pass the quality tests (PCR
Heracles, CA, United States) thermal cycler instrument. The PCR                         array reproducibility/RT efficiency:—1 sample from healthy
program included the following steps: an initial activation step at                     donors and 2 samples from NAFLD patients). To normalize
95◦ C for 15 min, followed by 40 cycles each of denaturation at                         the obtained data, we used the global CT mean of expressed
94◦ C for 15 s and annealing at 55◦ C for 30 s and extension at                         miRNAs (Mestdagh et al., 2009) because small nucleolar RNAs
70◦ C for 30 s.                                                                         (e.g., SNORD44, SNORD48 and RNU6-1) changed significantly
                                                                                        (Marabita et al., 2016; Neagu et al., 2020). All Cq values > 35 were
Statistical Analysis of Experimental Data                                               excluded. The most significant differentially expressed miRNAs
The normal distribution of the quantitative indicator was checked                       (>twofold change and p < 0.05) in all study groups were selected
using the Shapiro–Wilk test. If the sample fit the normal                               for subsequent bioinformatics analysis.
distribution, the hypothesis of equality of sample means was
tested using Student’s t-tests. If the data distribution did not obey
the law of normal distribution, further assessment of differences                       MiRNA Target Mining and Gene Set
between samples was calculated using the non-parametric                                 Enrichment Analysis
Mann–Whitney test for pairwise comparisons. Differences were                            MiRNA target genes were predicted using the online platform
considered significant at p < 0.05. Statistical processing of the                       miRWalk (Sticht et al., 2018) with a binding probability
obtained results was performed using GraphPad Prism 8.01.                               threshold of 100%. MiRWalk uses miRNA sequences from
PCR data were analyzed using miScript miRNA PCR Array                                   miRBase (version 21). The miRWalk structure includes the

Frontiers in Cell and Developmental Biology | www.frontiersin.org                   3                                      September 2021 | Volume 9 | Article 736677
Vulf et al. Analysis miRNAs in Serum
TargetScan (version 7.1), miRDB (version 5.0) and miRTarBase GeneGlobe Data Analysis Center software to investigate the
(version 7.0) datasets. differential miRNA expression (Figure 3A). According to this,
Functional Enrichment Analysis (GSEA) was performed in the expression of 51 miRNAs was suppressed, 27 miRNAs were
miRWalk using the KEGG (KEGG Pathway Database, 2021) activated, and 6 miRNAs did not change in group patients with
and REACTOME (Home - Reactome Pathway Database, 2021) steatosis. 49 miRNAs were suppressed in a group patients with
databases to elucidate the specific biological functions of the NASH, 32 were activated, and 3 did not change.
resulting gene sets. miRWalk provides a standard enrichment Volcano plot filtering was performed to identify miRNAs with
analysis based on hypergeometric tests (chi-square selection statistically significant differences in expression in the groups
algorithm). The resulting GSEA data were analyzed and with steatosis and NASH compared with healthy donors. The
visualized using R code (version 4.0.2) developed by us in expression levels of miR-195-5p, miR-16-5p were suppressed
RStudio: Paths were sorted by p-values (p ≤ 0.05 was considered (p < 0.05) in the group of patients with steatosis (Figure 3B
significantly enriched). and Supplementary Table 2). The expression levels of miR-23a-
3p, miR-224-5p, miR-26b-5p, miR-15b-5p, miR-26a-5p, miR-
Comparison of Search Results for Target 374a-5p, miR-200c-3p, miR-1-3p, let-7a-5p, miR-21-5p, let-
Genes With NAFLD Pathogenesis 7c-5p, miR-143-3p, miR-423-5p, miR-155-5p were increased
Target genes obtained with the miRWalk platform were (p < 0.05), the expression levels of miR- 195-5p, miR-130b-3p,
compared with a set of genes involved in the pathogenesis miR-16-5p, miR-19a-3p, miR-19b-3p, miR-27a-3p, miR-93-5p
of NAFLD. NAFLD pathogenesis genes (158 genes) were were suppressed (p < 0.05) in the group of patients with NASH
exported from the open portal Wiki Pathways [Non-alcoholic (Figure 3C and Supplementary Table 3).
fatty liver disease (Homo sapiens)—WikiPathways, 2021]. Data Depending on the stage of NAFLD, common and unique
comparisons were performed for the groups: Steatosis, NASH. miRNAs were found (Figure 3D). For example, 2 miRNAs (miR-
The NAFLD pathogenesis genes targeted by the miRNAs 195-5p and miR-16-5p) were found in all studied groups. 21
differentially expressed in our experiment were determined. We miRNAs were unique to the patients with NASH: miR-222-3p,
analyzed and visualized the obtained data using R code (version miR-26b-5p, miR-26a-5p, miR-374-5p, miR-23a-3p, let-7a-5p,
4.0.2) developed by us in RStudio. miR-155-5p, miR-200c-3p, miR-423-5p, miR-21-5p, miR-224-5p,
let-7c-5p, miR-15b-5p, miR-210-3p, miR-296-5p, mir- 19a-3p,
mir-19b-3p, miR-27a-3p, miR-93-5p, and miR-130b-3p.
RESULTS
MiRNA Target Mining and Gene Set
Liver Biopsy Studies Enrichment Assay
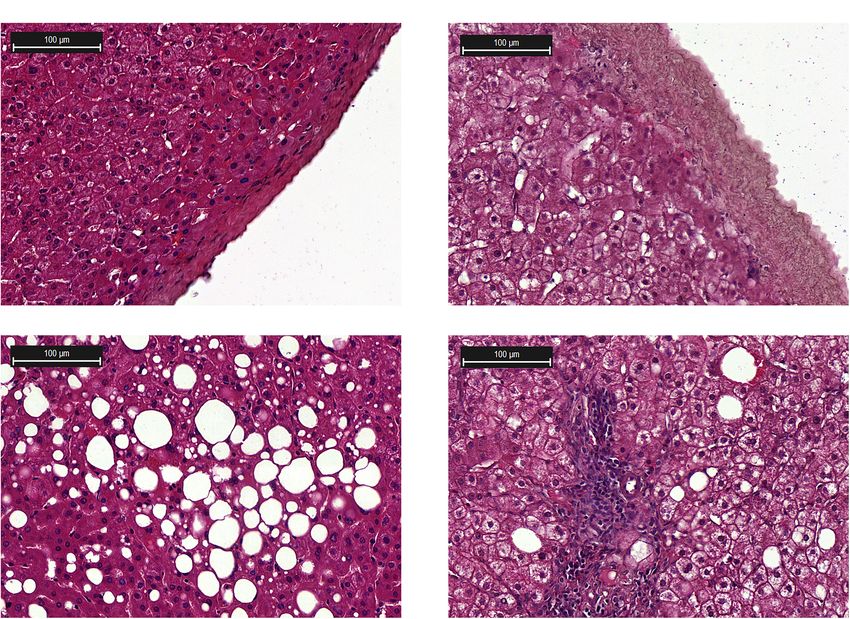
Histological analysis of liver biopsies showed no signs of To identify the metabolic processes affected by the discovered
inflammation in healthy donors. The lobular organization miRNA deregulation, Gene Set Enrichment Assay (GSEA)
in biopsies from healthy donors was not altered, and the was performed using databases and MiRWalk algorithms for
histoarchitectonics of the hepatic acinus was not changed. The two groups: patients with steatosis and NASH. Target genes
central veins, portal vein, and hepatic tracts were prominent for differentially expressed miRNAs in referred groups were
and composed of hepatocytes without signs of polymorphism; predicted using the MiRWalk platform. Comparison of GSEA
only weak manifestations of intracellular cholestasis were on same gene sets showed that DAVID recognizes fewer genes
noted (Figure 2A). from similar databases than MiRWalk; therefore, GSEA was
Morphological changes in liver biopsy at the stages of steatosis performed in MiRWalk. In the group of patients with steatosis,
and NASH are shown in Figures 2C,D, respectively. The presence 1 746 putative targets were found for 2 miRNAs. In the group of
of the small, medium and large lipid droplets was characteristic of patients with NASH, 11 106 putative target genes were found for
steatosis. According to the results of histological examination of 21 miRNAs. The predicted genes were annotated using the KEGG
liver biopsies in the patients with NASH, there was an increase and REACTOME databases (Figures 4, 5).
in the area of fatty deposits and the number of lymphocytes KEGG pathway enrichment analysis showed that target genes
(Figure 2D). In the group of patients with NASH, enlarged liver in the miRNA-mRNA regulatory network were enriched in 7
capsule (Figure 2B) and hepatocyte dystrophy were revealed. All common pathways in the group of patients with steatosis and
patients with NAFLD had an increased area of lipid droplets. NASH: Hippo signaling pathway (KEGG: 04390), Axon guidance
The highest levels of lipid infiltration were found in the group (KEGG: 04360), Wnt signaling pathway (KEGG: 04310), Breast
of patients with steatosis (Supplementary Figure 1). cancer (KEGG: 05224), AMPK signaling pathway (KEGG:
04152), Dopaminergic synapse (KEGG: 04728), GABaergic
Expression of Circulating miRNAs in synapse (KEGG: 04727) (Figure 4).
Serum of Obese Patients With NAFLD KEGG analysis for the group of patients with steatosis target
We screened 84 miRNAs in serum from NAFLD patients and genes revealed mainly signaling pathways related to insulin
healthy donors. Patients were divided into groups: healthy signaling and its impairments: mTOR signaling pathways
donors, groups of patients with steatosis, and NASH. First, (KEGG: 04150), insulin signaling pathways (KEGG: 04910),
unsupervised hierarchical cluster analysis was performed in insulin resistance (KEGG: 04931), AGE-RAGE signaling
Frontiers in Cell and Developmental Biology | www.frontiersin.org 4 September 2021 | Volume 9 | Article 736677
Vulf et al.                                                                                                                                    Analysis miRNAs in Serum

  FIGURE 2 | Histological examination of the liver biopsies. (A) Liver capsule from a healthy donor; (B) Liver capsule with inflammation; (C) Steatosis; (D) NASH,
  lymphocytic infiltration in the tissue. Hematoxylin and eosin (H&E) staining.

pathways in diabetic complications (KEGG: 04933). The most                              processes (clathrin-mediated endocytosis: R-HSA-8856828,
significant number of whole putative target genes were involved                         cargo recognition for clathrin-mediated endocytosis:
in the Hippo signaling pathway (KEGG: 04390) and axon                                   R-HSA-8856825). In addition, the following significantly
guidance (KEGG: 04360) (more than 25 hits) (Figure 4A).                                 enriched pathways were identified: neuro-humoral pathways,
   KEGG analysis for the group of patients with NASH target                             mitochondria-dependent energy pathways, pathways associated
genes showed that the most represented pathways were those                              with carbohydrate metabolism, RNA and protein metabolic
in cancer (KEGG: 05200) (more than 300 hits), indicating the                            pathways, cell death pathways, homeostatic pathways, metabolic
involvement of these miRNAs in the regulation of pathological                           pathways, and others.
cell proliferation processes that exacerbate the progression of
pathology. In addition, the following pathways were found:
MAPK signaling pathway (KEGG: 04010), Endocytosis (KEGG:
                                                                                        Epigenetic Regulation Signatures in
04144), RAS signaling pathway (KEGG: 04014), Wnt signaling                              NAFLD Pathogenesis in Patients With
pathway (KEGG: 04310), Hippo signaling pathway (KEGG:                                   Steatosis and NASH
04390), ErbB signaling pathway (KEGG: 04012), TGF-beta                                  To uncover the epigenetic mechanisms by which differentially
signaling pathway (KEGG: 04350), Cellular senescence (KEGG:                             expressed miRNAs contribute to or mitigate the progression of
04218) (Figure 4B).                                                                     NAFLD, we compared the predicted target genes of differentially
   Further GSEA was performed on the REACTOME                                           expressed miRNAs in the group of patients with steatosis and
database (Figures 5A,B). Target gene enrichment analysis                                NASH with genes involved in the NAFLD pathogenesis (158
in the REACTOME database in the group of patients                                       genes were obtained from the WikiPathways database). The
with steatosis identified 54 metabolic pathways. The largest                            results of this analysis are shown in Figure 6.
number of matches (hits) was for the PPAR pathway (PPARA                                   In the group of patients with steatosis, the differentially
activates gene expression: R-HSA-1989781), endocytosis                                  expressed miRNAs target 7% (11 genes) of NAFLD pathogenesis

Frontiers in Cell and Developmental Biology | www.frontiersin.org                   5                                       September 2021 | Volume 9 | Article 736677
Vulf et al.                                                                                                                                     Analysis miRNAs in Serum

  FIGURE 3 | Identification of differentially expressed miRNAs. (A) Hierarchical cluster analysis. Red—increased miRNA; green—decreased miRNA; black—no
  changes in expression. The magnitude of gene expression is determined by calculating the 2-1CT for each gene and normalizing to the average 2-1CT of all genes
  across all arrays. Volcano plot of differentially expressed miRNAs in serum; (B) group of patients with steatosis and (C) group of patients with NASH. Plots show the
  relationship between fold change and statistical significance. The solid vertical line shows no change in gene expression (log2 1 = 0). Data points to the right of the
  solid vertical line indicate activated genes, and data points to the left indicate repressed genes. The dashed lines represent the threshold—2. The solid vertical line
  represents the threshold of statistical significance, p < 0.05. Thus, the blue and yellow dots in the graph indicate >2.0-fold activation and suppression of expression
  with statistical significance. (D) Venn plot of miRNA profile overlap showing common and unique miRNAs in serum from groups of patients with steatosis and NASH.
  Expression activation is highlighted in red, while statistically significant expression suppression is highlighted in black (D).

genes. All of them are targeted by downregulated miRNAs                                 by upregulated miRNAs, nine genes were targeted only by
(Figures 6A,B). In the group of patients with NASH, miRNAs                              downregulated miRNAs, and 27 genes were targeted by both up-
target 50% (79 genes) of the genes involved in NAFLD                                    and downregulated miRNAs. A complete list of genes targeted
pathogenesis (Figures 6C,D). Bioinformatics analysis showed                             by miRNAs for each group is available in the Supplementary
that 43 genes of NAFLD pathogenesis were targeted only                                  Material (Supplementary Tables 3, 4).

Frontiers in Cell and Developmental Biology | www.frontiersin.org                   6                                        September 2021 | Volume 9 | Article 736677
Vulf et al.                                                                                                                                    Analysis miRNAs in Serum

  FIGURE 4 | Gene set enrichment analysis performed on the KEGG pathway database for two groups. (A) Target gene set of miRNA that were significantly
  deregulated in the group of patients with steatosis (p ≤ 0.05); (B) Target gene set of miRNA that were significantly deregulated in the group of patients with NASH
  (p ≤ 0.05). Common pathways in steatosis and NASH are highlighted in red. Hits—number of target genes represented in the pathway.

DISCUSSION                                                                              course of pathogenesis may be due to RNA-dependent epigenetic
                                                                                        regulation. Our analysis of circulating miRNAs in the serum of
Currently, NAFLD has been diagnosed in more than one                                    patients with steatosis or NASH showed that disease progression
billion people (Alqahtani et al., 2021). Steatosis may progress                         was associated with a significant increase in the number of
to fibrosis and hepatocellular carcinoma or persist for a long                          miRNAs (2 deregulated miRNAs in patients with steatosis versus
time in the form of fatty liver. The reason for the different                           21 deregulated miRNAs in patients with NASH). An increase

Frontiers in Cell and Developmental Biology | www.frontiersin.org                   7                                       September 2021 | Volume 9 | Article 736677
Vulf et al. Analysis miRNAs in Serum
FIGURE 5 | Gene set enrichment analysis performed on the REACTOME metabolic pathway database on two gene sets. (A) Target gene set of miRNA that were
significantly deregulated in the group of patients with steatosis (p ≤ 0.05); (B) Target gene set of miRNA that were significantly deregulated in the group of patients
with NASH (p ≤ 0.05). The common pathways in steatosis and NASH are highlighted in red. Hits—number of target genes represented in the pathway.
in the number of differentially expressed miRNAs in NASH is and are expressed by cardiomyocytes and fibroblasts (Tijsen et al.,
associated with pathology progression. 2014). The level of miR-16 in serum correlates positively with
NAFLD severity in some studies (Liu X.-L. et al., 2016), negatively
in others (López-Riera et al., 2018), or does not correlate
Deregulation of miR-195-5p and at all (Cermelli et al., 2011). miR-16-5p is one of the most
miR-16-5p Is Common in Patients in the commonly used reference standards in microRNA expression
Steatosis and NASH Groups assays (Okamoto et al., 2020). Based on the fact that its level
miR-195-5p and miR-16-5p were suppressed in both groups changes significantly in the group of patients with NAFLD, the
of patients with steatosis and NASH. It is noteworthy that use of miR-16-5p as an internal control needs to be reconsidered
miR-195-5p and miR-16-5p belong to the same miR-15 family in future studies.
Frontiers in Cell and Developmental Biology | www.frontiersin.org 8 September 2021 | Volume 9 | Article 736677Vulf et al. Analysis miRNAs in Serum
FIGURE 6 | Percentage and amount of NAFLD pathogenesis genes targeted by differentially expressed miRNAs. (A) Percentage of NAFLD pathogenesis genes
targeted by differentially expressed miRNAs in the group of patients with steatosis; (B) Venn plot of NAFLD pathogenesis genes targeted by differentially expressed
miRNAs in the group of patients with steatosis; (C) Percentage of NAFLD pathogenesis genes targeted by differentially expressed miRNAs in the group of patients
with NASH; (D) Venn plot of NAFLD pathogenesis genes targeted by differentially expressed miRNAs in the group of patients with NASH. Pink—genes targeted by
downregulated miRNAs; light blue—genes targeted by upregulated miRNAs; purple—genes targeted by both up- and downregulated miRNAs.
14 miRNAs Were Upregulated in the annotating (performing GSEA analyzes) the predicted genes
Group of Patients With NASH using the KEGG and REACTOME databases.
Gene set enrichment analysis on the KEGG database for the
Analysis of the literature showed that the results of our screening
patients with steatosis revealed pathways associated with cell
were consistent with other studies: 12 of 14 miRNAs that showed
cycle regulation, regeneration, apoptosis, and insulin signaling.
increased expression according to the results of our screening,
Pathways were characterized by the number of hits (the number
namely miR-15b, miR-21, miR-23a, miR-26a, miR-155, miR-
of genes targeted by differentially expressed miRNAs) and the
200c, miR-222, miR-224, miR-374a, miR-423, let-7a and let-7c
significance of enrichment (p < 0.05). The Hippo signaling
were upregulated in the serum of patients with NASH in other
pathway plays a crucial role in the processes of apoptosis,
studies (Cheung et al., 2008; Yamada et al., 2013; Csak et al., 2015;
proliferation, and cell regeneration (Nguyen-Lefebvre et al.,
Gerhard and DiStefano, 2015; Pirola et al., 2015; Liu Z. et al., 2016;
2021). The Hippo signaling pathway is an essential modulator
Dongiovanni et al., 2018; Matsuura et al., 2018; Menghini and
of liver metabolism (Koo and Guan, 2018), acting through the
Federici, 2018). The levels of miR-23a, miR-224, miR-200, miR-
hormone receptor GPCR. One of the types of post-translational
21, miR-423 were increased not only in the serum but also in liver
protein modifications is glycosylation. The mucin-type O-glycan
tissue of patients with NASH (Cheung et al., 2008).
biosynthesis pathway is responsible for glycosylation and protects
Thus, despite the small size of the test groups, our screening
the cell surface from external stress, microbial infection, and
results are largely consistent with the results of other studies.
autoimmune responses (Reily et al., 2019). O-glycans play an
We hypothesize that the these miRNAs (miR-15b, miR-21, miR-
important role in lipid metabolism: deficiency of O-glycans
23a, miR-26a, miR-155, miR-200c, miR-222, miR-224, miR-
during embryonic and postnatal development disrupts lipid
374a, miR-423, let-7a, and let-7c) might have high potential as
transport and leads to fatty liver (Fu et al., 2008). Thus,
diagnostic molecules.
signal transduction pathways and post-translational modification
(glycosylation) of proteins were the most enriched pathways.
Pathways of Neurohumoral Regulation For a more detailed characterization, a GSEA was performed
Are Epigenetically Modulated in NAFLD on the REACTOME database for the group of patients with
We also aimed to analyze the differences in RNA-dependent steatosis. The GSEA based on REACTOME resulted in a larger
epigenetic regulation of signaling cascades and metabolic number of enriched pathways due to the lower hierarchy of the
pathways in the groups of patients with steatosis and NASH. REACTOME database. The analysis for the group of patients
A theoretical understanding of miRNAs’ mechanisms during with steatosis showed that more than ten represented pathways
NAFLD progression was achieved by mining for target genes were involved in neuro-humoral regulation. The most enriched
for differentially expressed miRNAs and then functionally pathway for the group of patients with NASH was the neurexins
Frontiers in Cell and Developmental Biology | www.frontiersin.org 9 September 2021 | Volume 9 | Article 736677Vulf et al. Analysis miRNAs in Serum
and neuroligins pathway. Neurexins and neuroligins are synaptic (CXCL8) (Figure 7A and Supplementary Table 3). An increase
adhesion molecules in the central nervous system that regulate in the activity of these genes due to the downregulation of
the differentiation and maturation of glutamatergic (excitatory) miR-16-5p and miR-195-5p could be an adaptive mechanism to
or GABAergic (inhibitory) synapses (Craig and Kang, 2007). restrain the progression of steatosis.
Neuroligin family members have been found to stimulate insulin Mitochondria are able to adapt rapidly to external signals
production, demonstrating the importance of neurohumoral in order to maintain cell homeostasis and metabolic activity.
regulation in steatosis (Suckow et al., 2008). Dopaminergic They play a key role in energy production and cell death
pathways play an important role in the regulation of appetite and control (Longo et al., 2021). In obesity, the development of
eating behaviors, as well as inflammation associated with obesity oxidative stress leads to the formation of peroxynitrite, which
(Leite and Ribeiro, 2020). Dopaminergic pathways are found in causes damage to the mitochondrial electron transport chain via
many tissues and can influence glucose homeostasis and body cytochrome C and increases the production of reactive oxygen
weight (Matt and Gaskill, 2020). Activation of the intrahepatic species (ROS). Oxidative stress promotes damage to mtDNA,
GABAergic system protects the liver from damage (Wang leading to mitochondrial dysfunction (Skuratovskaia et al., 2020).
et al., 2017). Signaling pathways involved in neurohumoral In previous work, we have shown that mitochondrial dysfunction
regulation are strongly represented in the group of patients with may contribute to the development of type 2 diabetes in obese
steatosis. These findings provide a foundation for further research patients with an inflammatory process in the liver (Skuratovskaia
and understanding of how these pathways of RNA-dependent et al., 2021). This work emphasized the effect of increased
epigenetic regulation are involved in the pathogenesis of NAFLD expression of miRNAs in patients with NASH on the repression
and the impact this may have on disease progression. of genes for mitochondrial biogenesis.
Signaling pathways associated with synapse formation and In the group of patients with NASH, miRNAs were found
plasticity (axon guidance, dopaminergic synapse, and GABAergic to target genes largely responsible for the functioning of
synapse) were common in steatosis and NASH. This finding mitochondria, which are abundant in the liver (Degli Esposti
reveals new neurohumoral aspects of epigenetic regulation of et al., 2012). Our data show that the upregulated miRNAs
metabolic diseases that can be considered in future studies. targeted genes of mitochondrial complex I (NADH: ubiquinone
In contrast to the group of patients with steatosis, GSEA oxidoreductase), complex II (succinate dehydrogenase), complex
on the KEGG database for the group of patients with III (cytochrome bc1 complex), and complex IV (cytochrome c
NASH revealed multiple pathways associated with cancer oxidase) (Figure 7B and Supplementary Table 4). In the group
(approximately ten pathways). The enriched pathways highlight of patients with NASH, miRNAs likely decrease ATP synthesis
the potential of NASH to develop into malignant transformation by altering the expression of OXPHOS subunits. Probably, genes
(pathological proliferation). Moreover, the mechanisms of responsible for ATP production were suppressed by increased
epigenetic regulation associated with NAFLD progression based miRNAs (let-7c-5p, miR-155-5p, miR-423-5p, miR-15b-5p, miR-
on KEGG are associated with the most significant pathways: 143-3p, and miR-26a-5p) in the group of patients with NASH
regulation of cell cycle, proliferation, differentiation and compared to the steatosis group.
migration of cells, cellular and humoral responses. However, the There are studies that predict microRNAs from a targeted
most enriched Reactome pathway for the NASH group was the sequence. Thus, the authors found polymorphic variants of
neurexins and neuroligins pathway. genes in the mitochondrial D-loop (Hasturk et al., 2019).
Mitochondrial DNA variants m.16129 G > A, AA genotype and
Differentially Expressed miRNAs Target m.16249 T > C, CC genotype, were associated with fibrosis and
Genes Responsible for Oxidative lobular inflammation and histological steatosis in NASH patients,
respectively (Hasturk et al., 2019). They predicted several
Phosphorylation (Mitochondrial miRNAs for each polymorphic gene variant in target sequences.
Function) in Groups of Patients With The authors investigated the possible correlation of the mtDNA
Steatosis and Steatohepatitis copy number with the rs3746444 MIR499A polymorphism in
To identify specific miRNA-mRNA interactions within NAFLD, another study. It was shown that the homozygous variant
we focused on signaling pathways of NAFLD pathogenesis genotype for the rs3746444 MIR499A polymorphism correlates
exported from Wiki Pathways. We found that miRNAs with a decrease in the number of mtDNA copies, especially
deregulated according to our screening target 50% of NAFLD in patients with T2DM (p = 0.009). The association of the
pathogenesis genes in the group of patients with NASH and variant MIR499A allele with the mtDNA copy number suggests
7% of NAFLD pathogenesis genes in the group of patients with a possible effect of this polymorphism on oxidative stress
steatosis. RNA-dependent epigenetic regulation is enhanced in (Latini et al., 2020).
correlation with pathology progression.
In the group of patients with steatosis, the target genes
of decreased miR-16-5p and miR-195-5p are involved in
Differentially Expressed miRNAs Alter
Electron Transport Chain (OXPHOS system in mitochondria): Energy Balance in the Liver by Targeting
Complex I—NDUFA5, NDUFB5, Complex II—SDHC, Complex Genes of the AMPK Complex
III—UQCRB, UQCRFS1, lipid metabolism (genes: PRKAA2, AMPK is a central regulator of cellular metabolism that is
PRKAG3, RXRA, SREBF1, GSK3B) and chemokine signaling activated by a decrease in intracellular ATP levels. AMPK
Frontiers in Cell and Developmental Biology | www.frontiersin.org 10 September 2021 | Volume 9 | Article 736677Vulf et al. Analysis miRNAs in Serum FIGURE 7 | The modified NAFLD pathogenesis map showing epigenetic regulatory signatures in steatosis and NASH. (A) Predicted NAFLD pathogenesis genes targeted by differentially expressed miRNAs in the group of patients with steatosis are highlighted; (B) Predicted NAFLD pathogenesis genes targeted by differentially expressed miRNAs in the group of patients with NASH are highlighted. Pink—genes targeted by downregulated miRNAs; light blue—genes targeted by upregulated miRNAs; purple—genes targeted by both up- and downregulated miRNAs. The pathway was imported from WikiPathways. signaling reduces lipogenesis by inhibiting acetyl CoA and Supplementary Table 4). Suppression of B-subunit gene carboxylase (ACC). The AMPK complex consists of a catalytic expression disrupts the formation of the complex required for subunit (α) and two regulatory subunits (β and γ) (Mihaylova AMPK interaction with downstream targets. The binding of ADP and Shaw, 2011). AMPK activity in the liver is reduced in patients and AMP to the G-subunit of AMPK triggers phosphorylation with NAFLD in the presence of excess nutrients. In our work, the of Thr172 and maintains the kinase in an active conformation upregulated miRNAs target the regulatory subunit genes of the (Willows et al., 2017). Suppression of G-subunit gene expression AMPK complex: let-7a-5p, let-7c-5p, miR-26a-5p, miR-423-5p can suppress the activity of the AMPK complex. In the work of target PRKAB1; let-7c-5p, mir-423-5p target PRKAG1; let-7c-5p, Simino et al. (2021), Prkaa2 (AMPKα2) was shown to be a direct mir 15b-5p target PRKAG2; miR-15b-5p—PRKAB2 (Figure 7B let-7 target in the liver in a steatosis model (Simino et al., 2021). Frontiers in Cell and Developmental Biology | www.frontiersin.org 11 September 2021 | Volume 9 | Article 736677
Vulf et al.                                                                                                             Analysis miRNAs in Serum

In general, a decrease in the expression of AMPK complex genes           (ROS) that trigger cell death (Duarte et al., 2014; Redza-
by RNA-dependent epigenetic regulation indicates dysfunction             Dutordoir and Averill-Bates, 2016). Cells die by necrosis if
of the complex, consistent with data from other researchers.             there is not enough ATP or apoptosis if there is enough ATP
Let-7a-5p, let-7c-5p, miR-15b-5p, miR-26a-5p, miR-423-5p,                (Duarte et al., 2014).
inhibit the AMPK complex, disturbing the energy balance in the               The extrinsic pathway of apoptosis is triggered via death
liver, contributing to the formation of NASH.                            receptors (DR) or pattern recognition receptors (PRR) (Galluzzi
    Leptin (LEP) and adiponectin (ADIPOQ), hormones of                   et al., 2018). DR includes the Fas cell surface death receptor
adipose tissue (adipokines), can activate AMPK. In obesity, the          (FAS; also known as CD95 or APO-1) and a member of the
production of leptin increases, and the secretion of adiponectin         TNFR superfamily of receptors (Brenner et al., 2015). Elevated
is suppressed. Dysfunction of adipokines is associated with the          miR-143-3p targets the gene FAS according to bioinformatics
progression of NAFLD. Upregulated miR-200c-3p and miR-224-               prediction (Figure 7B and Supplementary Table 4). FAS (CD95,
5p target the gene LEP and lead to its suppression (Figure 7B            TNFRSF6) induces assembly of the death-inducing signaling
and Supplementary Table 4). Hyperleptinemia has been shown               complex (DISC), leading to apoptosis (Lavrik and Krammer,
to lead to the development of insulin resistance (the pathways           2012). The upregulated miR-423-5p targets the TNF gene. We
of leptin and insulin cross), inhibition of lipid oxidation, and         hypothesize that elevation of miR-143-3p and miR-423-5p, aimed
activation of lipogenesis by SREBP-1 in the liver (Jiménez-              at suppressing the expression of FAS and TNF genes, may prevent
Cortegana et al., 2021). Leptin can activate HSC, provoking              apoptotic signaling and programmed cell death, contributing to
the development of fibrosis (Polyzos et al., 2011). Therefore,           the development of fibrosis and hepatocarcinogenesis.
decreasing LEP gene expression through RNA-dependent                         Interestingly, miR-423-5p targets the downstream genes
epigenetic regulation is a promising therapeutic mechanism as it         of the TNF/NF-kB signaling pathway: RelA, JUN, IKBKB
leads to a decrease in lipid production in the liver.                    (Figure 7B and Supplementary Table 4). NF-κB is the major
    AMPK is closely linked to mitochondrial biogenesis via               transcriptional pathway that protects hepatocytes from TNF-
PPAR. PPAR forms a heterodimer with RXR, and this complex                and LPS-induced cell death (Luedde and Schwabe, 2011).
transactivates target genes to adapt cells to metabolic changes          Normal NF-κB function is required to synthesize cytokines
(Lee and Kim, 2010). The transcription factor PPAR plays                 (TNF, IL -6) and control hepatocyte proliferation after exposure
a vital role in lipid metabolism. Thus, deletion of Pparα in             to oxidative stress (Ringelhan et al., 2012). Blocking the RelA
mouse liver contributes to steatosis and NASH in obesity                 subunit disrupts NF-kB activation and renders hepatocytes
(Régnier et al., 2020). The increase in miR-423-5p suppresses            vulnerable to the lethal effects of TNF (Geisler et al., 2007). IKK-
the expression of the PPARA gene, which may lead to a                    beta-deficient hepatocytes counter with weak NF-κB activation
decrease in fatty acid oxidation and an increase in lipogenesis          in response to TNF in animal models. RelA deficiency was
in the liver.                                                            associated with prolonged JNK activation and elimination of
                                                                         the anti-apoptotic cellular protein inhibitor FLICE (c- FLIP)
                                                                         (Geisler et al., 2007). Inhibition of JUN (p39; AP -1; c-Jun)
Therapeutic Increase of miR-423-5p Can                                   promotes hepatocyte death in a background of oxidative stress
Decrease de novo Lipogenesis in the                                      and compensatory regeneration. Suppression of c-Jun and
Liver                                                                    NF-κB promotes hepatocyte death and impedes liver tissue
Another potential target of mir-423-5p is the PKLR gene                  regeneration (Hasselblatt et al., 2007; Le Clorennec et al., 2019).
(Figure 7B and Supplementary Table 4). Elevated L/R-type                 MiR-423-5p also acts on IKBKB (an inhibitor of the beta
pyruvate kinase (PKLR) levels are associated with NAFLD                  subunit of nuclear factor kappa B kinase). IKK phosphorylates
progression: thus, inhibition of PKLR lowers liver triglyceride          NF-kB inhibitors and stimulates their degradation, allowing
and cholesterol levels and improves insulin sensitivity in mice          free NF-kB to migrate into the nucleus and activate the
models (Krishnan et al., 2018). In addition, it has been shown           transcription of hundreds of genes involved in immune response,
that inhibition of PKLR in the liver leads to a decrease in              growth control, or protection against apoptosis. In addition to
OXPHOS in steatosis, suppressing mitochondrial respiration               NF-kB inhibitors, IKK phosphorylates several other pathway
and reducing active production of ROS, which alleviates fatty            components, including the NF-kB subunits RELA and NFKB1
liver. However, in fibrosis, PKLR inhibition has the opposite            and IKK-linked kinases (Salmerón et al., 2001; Yoboua et al.,
effect (Krishnan et al., 2018). In light of this, suppression of         2010). Reduction of the activity of IKB and RelA and JUN
PKLR by mir-423-5p to reduce de novo lipogenesis and improve             by miR-423-5p may lead to inhibition of the NF-kB pathway
mitochondrial function may have potential as a therapy in the            and inactivation of pro-apoptotic factors, contributing to the
early stages of NAFLD.                                                   progression of NASH.
                                                                             Let-7c-5p and miR-423-5p target genes associated with the
                                                                         mitochondrial (intrinsic) pathway of apoptosis, namely the
Differentially Expressed miRNAs Target                                   apoptosis activation genes BAK1 and BAX (Figure 7B and
Genes Responsible for Mechanisms of                                      Supplementary Table 4). BAK1 is a member of the BCL2 protein
Cell Death                                                               family that functions as a pro-apoptotic regulator. BAK and
Dysregulation of enzymes (I-III complexes) and mitochondrial             BAX form homo-oligomers within the mitochondrial membrane,
biogenesis leads to the formation of reactive oxygen species             resulting in the release of cytochrome C, which activates Apaf1

Frontiers in Cell and Developmental Biology | www.frontiersin.org   12                                  September 2021 | Volume 9 | Article 736677
Vulf et al. Analysis miRNAs in Serum
and leads to the activation of caspase 9 (Nguyen et al., 2018). Let- the processes of ATP synthesis and apoptosis were reduced,
7c-5p has a neuroprotective effect by inhibiting the expression of and oxidative stress and inflammation were increased in the
pro-caspase-3 and caspase-3 and preventing cell apoptosis after group of patients with NASH. Hepatocyte necrosis is considered
stroke (Tao et al., 2015). Overexpression of let-7c-5p inhibited an unprogrammed form of cell death resulting from metabolic
EtOH-induced hepatic steatosis and apoptosis (Wang et al., failure (Hotchkiss et al., 2009). Many authors associate necrosis
2018). Thus, let-7c-5p and miR-423-5p can suppress hepatocyte with a significant inflammatory response triggered by releasing
apoptosis in NAFLD. the pro-inflammatory cytokines IL-1, TNF (Kany et al., 2019).
Other miRNAs, miR-143-5p and miR-200c-3p, which are IL-1α directly or via induction of pro-inflammatory cytokines
upregulated in patients with NASH, target the ITCH gene (IL-6, TNFα, and IL-1β) promotes steatohepatitis by increasing
(Figure 7B and Supplementary Table 4). ITCH is a HECT the expression of adhesion molecules and chemotactic factors. IL-
ubiquitin ligase E3 that controls programmed cell death through 1β stimulates the accumulation of triglycerides and cholesterol
ubiquitin-induced degradation of anti-apoptotic proteins (Chang in primary hepatocytes and the formation of lipid droplets
et al., 2006). In contrast, suppression of the ITCH gene by miR- in the liver (Negrin et al., 2014). The upregulated let-7c-5p
143-5p and miR-200c-3 can promote apoptosis. No signs of targets the IL1B gene (group of patients with NASH). In several
malignant tissue degeneration were found in patients included cellular models, it has been shown that an increase in IL-
in the study, likely due to compensatory maintenance of 1β production leads to the progression of inflammation and
apoptotic processes in response to upregulation of miR-143-5p activation of HSC (Miura et al., 2010). Thus, suppression of IL-
and miR-200c-3. We anticipate that future experimental studies 1β expression by increasing let-7c-5p may lead to a reduction in
aimed at understanding the role of miR-423-5p, miR-143-5p, NASH progression, mediated by a decrease in lipogenic enzyme
and miR-200c-3 in regulating apoptotic processes in liver and activity, a decrease in migration of immunocompetent cells, and
hepatocarcinoma will be of great importance. suppression of metalloproteinase production.
IL-1β stimulates the release of IL-6. IL-6 binds to IL-6Ra
Differentially Expressed miRNAs Target or IL-6Rb and initiates signaling (Rose-John, 2018). Classical
Genes Involved in the Unfolded Protein IL-6 signaling occurs via IL-6Ra, stimulates liver regeneration,
and protects the liver from damage (Skuratovskaia et al., 2021).
Response Pathway IL-6R is downregulated by upregulated miR-423-5p, let-7a-5p,
Oxidative stress in fatty liver disease triggers ER stress, which let-7c-5p in the group of patients with NASH. Sui et al. (2019)
promotes the formation of misfolded proteins and NASH showed that IL-6R was identified as a direct target of let-7a
progression. According to the performed GSEA, the signaling (Sui et al., 2019). The authors showed that the let-7a inhibitor
pathways and processes associated with post-translational significantly increased the level of IL-6R expression, resulting
protein modification were predicted to be the most important in increased proliferation of liver cells. IL-6 is involved in the
in the group of patients with NASH. The development of regulation of various cellular functions. Inhibition of miR-423-
endoplasmic reticulum stress is associated with activating 5p, let-7a-5p, let-7c-5p can restore the classical pathway of IL-6
UPR-pathway, which controls protein homeostasis and lipid signaling in the liver.
metabolism (Lebeaupin et al., 2018). The PERK pathway is one TNF-α and IL -1β, LPS, and ROS can induce the expression
of the three major signaling branches of the UPR (Hetz, 2012). of VCAM-1 through different signaling pathways (NF-κB,
The increase in mir-26a-5p was targeted to the EIF2AK3 (PERK) IRF-1, and Ap-1) (Furuta et al., 2021). VCAM-1 is a cell
gene (Figure 7B and Supplementary Table 4). PERK-dependent adhesion protein that regulates leukocyte adhesion to vascular
ATF4 activation induces the expression of stress-sensitive genes endothelium (Carr, 2021). VCAM expression by liver sinusoidal
responsible for cellular redox potential and apoptosis signaling endothelial cells is significantly increased in NASH patients.
(Romine and Wiseman, 2019). Upregulated mir-26a-5p targets The upregulated let-7c-5p is predicted to target the VCAM1
the gene PERK and may aim to suppress antioxidant protection gene. Pharmacological inhibition or genetic deletion of VCAM-
and activate apoptosis. Another signaling branch of the UPR 1 in liver endothelial cells has been shown to reduce liver
pathway is ATF6. ATF6α activates transcription of XBP1 inflammation, injury, and fibrosis in NASH mice (Furuta et al.,
(Yoshida et al., 2001). The upregulated mir-423-5p and let-7a- 2021) 2021). Suppression of VCAM1 expression by let-7c-5p may
5p target the XBP1 gene. In hepatocytes, XBP1 regulates liver be protective against the development of NASH.
lipogenesis by directly binding to promoters of lipogenic genes
(SCD1, DGAT2, and ACC2) and activating their expression. It
was shown that de novo lipid biosynthesis was reduced in the Differentially Expressed miRNAs Target
liver of mice with deletion of XBP1 (Zhang et al., 2014). Thus, Genes Involved in TGF Signaling
a decrease in XBP1 gene expression by mir-423-5p and let-7a-5p According to target mining, the upregulated miRNA-423-5p
could result in a suppression of lipid biosynthesis. targets the TGFB1 gene. Signaling of the transforming growth
factor TGF-β activates Smad-dependent and TAK1-dependent
Differentially Expressed miRNAs Target signaling pathways necessary to regulate proliferation, cell
IL1B, IL6, IL6R, and VCAM1 survival, fibrosis, and tumorigenesis (Yang et al., 2014). The
According to the results of bioinformatic prediction of genes activation of the TGF-β pathway in the liver is associated
targeted by differentially expressed miRNAs, it was found that with hepatocyte damage, infiltration of inflammatory cells
Frontiers in Cell and Developmental Biology | www.frontiersin.org 13 September 2021 | Volume 9 | Article 736677Vulf et al. Analysis miRNAs in Serum
and their production of inflammatory cytokines, activation of In summary, let-7c-5p, miR-15b-5p, miR-21-5p, miR-423-
HSC, and development of fibrosis. Therefore, suppression of 5p, and miR-143-3p are of particular interest for further
genes associated with activation of this pathway will reduce research and potential therapy of insulin resistance. The
the progression of NAFLD. Another component of the TGF- latter two have been little studied in NAFLD; there is no
β signaling pathway is the SMAD7 gene. An increase in experimental evidence for targeting the predicted genes. Of
miRNA-423-5p, miR-155-5p and mir-200c-3p can suppress the note is the ambivalence of the effects of miR-423-5p and
SMAD7 gene. Thus, SMAD7 inhibits TGF-β signaling by acting miR-143-3p: increasing their expression is fruitful from the
downstream of the TGF-β receptor (Stopa et al., 2000). Smad7 point of view of possible suppression of GSK3. On the other
deficiency contributes to the development of alcoholic fatty liver hand, this leads to an inhibition of IRS1, which stimulates the
disease (Zhu et al., 2011). Song et al. (2020) showed that the miR- development of NASH.
200c-3p-SMAD7 regulatory axis promotes bone tissue formation
(Song et al., 2020). On the one hand, an increase in miRNA-
423-5p reduces the expression of the TGFB1 gene; on the other CONCLUSION
hand, miRNA-423-5p, miR-155-5p, and mir-200c-3p reduce
the expression of the TGF-β pathway inhibitor, SMAD7 gene. Thus, miR-15b, miR-21, miR-23a, miR-26a, miR-155, miR-200c,
Therefore, further research is needed to understand the role of miR-222, miR-224, miR-374a, miR-423, let-7a, and let-7c have
miRNA-423-5p in the regulation of the TGF-β signaling pathway. great potential as diagnostic biomarkers of NASH in serum.
Our study indicates the need to reconsider the use of miR-
16-5p as an internal control in future studies. The major
Differentially Expressed miRNAs Target signaling pathways involved in the progression of NASH were
Genes Involved in Insulin and PI3K-AKT signal transduction pathways, post-translational modification
Signaling (glycosylation) of proteins, pathways involved in neurohumoral
Differentially expressed microRNAs target genes that are also regulation, and pathways associated with the development of
involved in insulin signaling. For example, the upregulated malignant cell transformation. The data we obtained as a result
miRNA-143-3p and miR-423-5p target insulin receptor of bioinformatic analysis require confirmation by experimental
substrates 1 and 2 (IRS1 and 2), respectively (Figure 7B studies. We found that miR-374a-5p, miR-1-3p, and miR-23a-
and Supplementary Table 4). The miRNA-143-3p—IRS1 3p do not target genes directly involved in the pathogenesis of
relationship was experimentally confirmed: deletion of miRNA- NAFLD. The study of the obtained data will reveal new regulatory
143 in vascular smooth muscle cells leads to a substantial relationships involved in the pathogenesis of NASH.
increase in IRS1 expression and insulin signaling, and thus Suppression of the processes of apoptosis in the liver
insulin-induced glucose uptake in smooth muscle cells. It has promotes necrosis, fibrosis, and hepatocarcinogenesis. No signs
also been shown that suppression of IRS1 activity can contribute of malignant tissue degeneration were found in the patients
to necroinflammatory liver activity (Lan and Albinsson, 2020). included in the study, probably due to the compensatory
An increase in miRNA-143-3p and subsequent suppression of maintenance of apoptotic processes realized by miR-143-5p
IRS1 may lead to the formation of NASH via the development of and miR-200c-3. The role of miRNAs miR-423-5p, miR-143-
insulin resistance and hyperglycemia in the liver. 5p, and miR-200c-3 in regulating apoptotic processes in liver
According to the target mining results, many and hepatocarcinogenesis in humans is interesting for future
phosphoinositide 3-kinase (PI3K) family genes underwent experimental studies. According to bioinformatic predictions,
epigenetic regulation by deregulated miRNAs. Upregulated ATP synthesis and apoptosis processes were reduced, and
miRNA-423-5p and miR-21-5p target the PIK3R3 gene, which oxidative stress and inflammation were increased in the group of
has phosphatidylinositol kinase activity and can activate IRS1. patients with NASH.
Activation of PIK3R3 promotes the oxidation of fatty acids in the Inhibition of miR-423-5p, let-7a-5p, let-7c-5p can restore
liver via PPARα. Thus, a decrease in the expression of PIK3R3 the classical type of IL -6 signaling in the liver. Upregulated
by an increase in miRNA-423-5p and miR-21-5p may result in miRNA-423-5p reduces the expression of the TGFB1 gene on
suppression of the insulin signaling pathway and activation of the one hand; on the other hand, miRNA-423-5p, miR-155-5p,
lipid accumulation processes. and mir-200c-3p reduce the expression of the TGF-β pathway
Upregulated miR-423-5p targets glycogen synthase kinase- inhibitor SMAD7 gene. Therefore, further studies are needed
3 alpha (GSK3A) (Figure 7B and Supplementary Table 4). to understand the role of miRNA-423-5p in the regulation of
Inhibition of GSK3 leads to dephosphorylation and activation of the TGF-β signaling pathway. In summary, let-7c-5p, miR-15b-
glycogen synthase and maybe a liver defense mechanism. GSK3 5p, miR-21-5p, miR-423-5p and miR-143-3p are of particular
inhibitors have been considered as agents for targeted therapy interest for further research and potential therapy of insulin
for insulin resistance since the 1970s (Maqbool and Hoda, 2017). resistance. The latter two have been poorly studied in the context
Thus, the increase in miR-423-5p through an inhibitory effect of NAFLD; there is no experimental evidence of targeting the
on GSK3 has therapeutic potential for the treatment of insulin predicted genes. These findings provide the basis for further
resistance in the context of NAFLD. Of note, inhibition of GSK3 research and understanding of how these pathways of RNA-
also promotes liver regeneration in the presence of toxic damage dependent epigenetic regulation are involved in the pathogenesis
(Bhushan et al., 2017). of NAFLD and the impact this may have on disease progression.
Frontiers in Cell and Developmental Biology | www.frontiersin.org 14 September 2021 | Volume 9 | Article 736677You can also read