Appendix A
Air quality impact assessment
←
→
Page content transcription
If your browser does not render page correctly, please read the page content below

Appendix A Air quality impact assessment
APA East Coast Grid Expansion, Moomba to Wilton
Pipeline - Modification Report 1
Air Quality Impact Assessment

Prepared for APA Group
July 2021
Servicing projects throughout
 Australia and internationally

 SYDNEY
 Ground Floor, 20 Chandos Street
 St Leonards NSW 2065
 T 02 9493 9500

 NEWCASTLE
 Level 3, 175 Scott Street
 Newcastle NSW 2300
 T 02 4907 4800

 BRISBANE
 Level 1, 87 Wickham Terrace
 Spring Hill QLD 4000
 T 07 3648 1200

 ADELAIDE
 Level 4, 74 Pirie Street
 Adelaide SA 5000
 T 08 8232 2253

 MELBOURNE
 Ground Floor, 188 Normanby Road
 Southbank VIC 3006
 T 03 9993 1905

 PERTH
 Suite 9.02, Level 9, 109 St Georges Terrace
 Perth WA 6000
 T 02 9339 3184

 CANBERRA
 PO Box 9148
 Deakin ACT 2600

www.emmconsulting.com.au
APA East Coast Grid Expansion, Moomba
to Wilton Pipeline - Modification Report 1
Air Quality Impact Assessment

Report Number

J200919 RP#10

Client

APA Group

Date

7 July 2021

Version

v2 Final

Prepared by                                                              Approved by

Francine Manansala                                                       Ronan Kellaghan
Associate, Air Quality                                                   Associate, Air Quality
7 July 2021                                                              7 July 2021

This report has been prepared in accordance with the brief provided by the client and has relied upon the information collect ed at the time and
under the conditions specified in the report. All findings, conclusions or recommendations contained in the repo rt are based on the
aforementioned circumstances. The report is for the use of the client and no responsibility will be taken for its use by othe r parties. The client
may, at its discretion, use the report to inform regulators and the public.

© Reproduction of this report for educational or other non-commercial purposes is authorised without prior written permission from EMM
provided the source is fully acknowledged. Reproduction of this report for resale or other commercial purposes is prohibited without EMM’s
prior written permission.
Executive Summary
ES1       Introduction
East Australian Pipeline Pty Ltd, part of the APA Group (APA) currently operates an underground high pressure
natural gas transmission pipeline, extending from Moomba (South Australia) to Wilton (New South Wales). The
Moomba to Wilton Pipeline (MWP) is the mainline part of the Moomba Sydney Pipeline (MSP). APA is proposing an
expansion of transportation capacity on the East Coast Grid, linking Queensland with southern markets, by
approximately 25% through additional compression and associated works on both the South West Queensland
Pipeline (SWQP) and Moomba to Wilton Pipeline (MWP).
The expansion will be delivered in a number of stages. This report has been prepared to address the air quality
impacts for Stage 1 and 2, which includes the construction and operation of compressor stations at Milne (MW880)
and Round Hill (MW433).

ES2       Local setting and existing environment
The proposed compressor station at Round Hill (MW433) is located approximately 103 km north of Wilcannia in a
remote rural location, with few distinguishing topographical or land use features and mostly void of continuous
vegetation. There are no sensitive receptors within 5 km.
The Milne compressor station site (MW880) is located approximately 35 km south-west of Condobolin in a remote
rural location characterised by sparse pockets of vegetation. The terrain surrounding this site is flat with few
distinguishing features. The closest residential properties are located approximately 1.7 km to the north-east and
2.5 km to the south-east.
Analysis of meteorology for the study area is based on automatic weather stations located at Condobolin Airport
and White Cliffs. For the key pollutants associated with the operational phase of the project there are no significant
local sources that would contribute to background air quality, other than minor contributions from traffic and
agricultural plant and equipment.

ES3       Construction phase assessment
For the construction phase assessment, the construction methodology, scale of impacts and standard dust
mitigation measures are consistent across both compressor station sites, and therefore the risk-based assessment
of potential air quality impacts is applicable to each site. The construction assessment showed that there are no
sensitive human receptors within 350 m of each site and no ecological receptors within 50 m of the sites, therefore
impacts from construction dust are negligible. Good practice mitigation measures for construction dust will reduce
this risk further. Due to the proximity of receptor locations, the proposed construction dust mitigation measures
are most relevant to the Milne (MW880) site.

ES4       Operational phase assessment
Atmospheric dispersion modelling was completed using the AERMOD model system for the operation of the
compressor station at the Milne (MW880) site. Modelling results were compared against applicable NSW EPA’s
impact assessment criteria and a qualitative assessment of risk is also made, based on screening criteria prescribed
by the Western Australian Department of Water and Environmental Regulation (DWER).

J200919 | RP#10 | v2                                                                                                 i
The approach for modelling is to model the worst-case emission hour for every hour of the year (in this way, the
worst-case emission hour is paired with every possible meteorological condition). The highest NOx emission rate
for MW880 occurs for a high load scenario (96.6%), while the highest emission rate for CO and VOC occurs for the
low load scenario (18%). Emissions of SO2 are a function of the sulphur content of the fuel, therefore emissions will
be higher at higher loads (because more fuel is combusted).
When expressed as a percentage of the impact assessment criteria, the 1-hour average NO2 concentrations are less
than 1% of the impact assessment criterion. In accordance with the DWER screening criteria, if the 1-hour average
concentrations are less than 10% of the impact assessment, the incremental project impacts can be screened as
insignificant. For CO and SO2, the 1-hour average concentrations are also less than 1% of the impact assessment
criteria and can be screened as insignificant. For VOCs, the highest 1-hour average concentration is predicted for
formaldehyde, however it is less than 10% of the impact assessment criteria and therefore can be screened as
insignificant.
The predicted annual average concentrations of NOx and SO2, when assessed as a percentage of the impact
assessment criteria, are 0.1% of the impact assessment criterion. In accordance with the DWER screening criteria,
if the annual average concentrations are less than 1% of the impact assessment, the incremental project impacts
can be screened as insignificant.
Additional modelling assessment was not required for the Round Hill (MW433) site. The modelling results for Milne
(MW880) demonstrate that the operation of the compressor stations would result in insignificant incremental
ground level concentrations. For the Round Hill (MW433) site, sensitive receptors are located at almost double the
distance that was modelled for the Milne (MW880) site, therefore compliance can be inferred with confidence for
Round Hill (MW433).

ES5       Cumulative assessment
There are no significant local emissions sources that would contribute to ambient background concentrations for
all pollutants assessed, other than minor contributions from traffic and agricultural plant and equipment. On this
basis, ambient background for these pollutants can be assumed to be very low and compliance with the impact
assessment criteria can be inferred based on the minor project increment.

ES6       Greenhouse gas assessment
The significance of the project’s GHG emissions is assessed by comparing with GHG accounts for NSW (131,685 kt
CO2-e) and Australia (537,446 kt CO2-e) (AGEIS 2021). Annual average GHG emissions Stage 1 and Stage 2 during
construction represent approximately 0.001% of total GHG emissions for NSW and 0.0002% of total GHG emissions
for Australia, based on the National Greenhouse Gas Inventory for 2018. Annual average GHG emissions for Stage 1
operations represents approximately 0.02% of total GHG emissions for NSW and 0.006% of total GHG emissions
and annual average GHG emissions for Stage 2 operations represents approximately 0.05% of total GHG emissions
for NSW and 0.01% of total GHG emissions for Australia.

J200919 | RP#10 | v2                                                                                                ii
Table of Contents
Executive Summary                                           ES.1
1    Introduction                                             1
     1.1    Background                                        1
     1.2    Project overview and context                      1
     1.3    Report purpose and method                         2
     1.4    Study area and scope                              3
2    Project and site description                             4
     2.1    Compressor station details                        4
     2.2    Site and surrounding area                         7
3    Pollutants and assessment criteria                      10
     3.1    Introduction                                     10
     3.2    Applicable air quality assessment criteria       10
     3.3    Screening criteria and assessment of risk        12
4    Existing environment                                    13
     4.1    Meteorology and climate                          13
     4.2    Meteorological modelling                         16
     4.3    Baseline air quality                             21
5    Construction phase impact assessment                    23
     5.1    Introduction                                     23
     5.2    Construction assessment                          24
     5.3    Mitigation measures                              25
     5.4    Summary of commitments                           26
6    Operational phase impact assessment                     27
     6.1    Emissions                                        27
     6.2    Dispersion model selection and configuration     28
     6.3    Incremental results for Milne (MW880)            28
     6.4    Qualitative assessment for Round Hill (MW433)    29
7    Greenhouse gas assessment                               31
     7.1    Introduction                                     31
     7.2    Emissions sources and scope of the assessment    31

J200919 | RP#10 | v2                                               i
7.3 Estimated GHG emissions 32
7.4 GHG emission management 33
7.5 Construction 33
8 Conclusion 34
References 35
Abbreviations 36
Tables
Table 2.1 Construction and commissioning workforce 6
Table 2.2 Monthly construction and commissioning workforce distribution 6
Table 2.3 Air quality assessment locations 8
Table 3.1 Impact assessment criteria – common pollutants 11
Table 3.2 Impact assessment criteria – VOCs 12
Table 4.1 Regional meteorological monitoring sites 13
Table 5.1 Mitigation measures – construction emissions 25
Table 5.2 Summary of commitments – air quality 26
Table 6.1 Emissions data for Mars100-C65 27
Table 6.2 Stack parameters assumed for modelling 28
Table 6.3 Maximum 1-hour ground level concentrations (GLC) (µg/m3) 29
Table 6.4 Annual average ground level concentrations (GLC) (µg/m3) 29
Table 7.1 Summary of GHG emission sources included in assessment 32
Table 7.2 Summary of Scope 1 emissions for operations (t CO2-e) per year 33
Table 7.3 Summary of commitments – greenhouse gas 33
Figures
Figure 2.1 Assessment locations surrounding the Milne site 9
Figure 4.5 TAPM wind rose for the Milne site (BOM) 19
Figure 4.6 CALMET-calculated diurnal variation in atmospheric stability 20
Figure 4.7 CALMET-calculated diurnal variation in atmospheric mixing depth 21
J200919 | RP#10 | v2 ii1 Introduction 1.1 Background East Australian Pipeline Pty Ltd, part of the APA Group (APA) currently operates an underground high pressure natural gas transmission pipeline, extending from Moomba (South Australia) to Wilton (New South Wales), a distance of approximately 1,299 kilometres (km). The Moomba to Wilton Pipeline (MWP) is the mainline part of the Moomba Sydney Pipeline (MSP) and was constructed in 1976. Initially, the pipeline was owned and operated by the Pipeline Authority, a Commonwealth agency, and generally regulated under the Pipeline Authority Act 1973. The MWP is now owned and operated by APA; it was gazetted as State Significant Infrastructure (SSI) on 11 December 2020 and is authorised by Pipeline Licence No. 16 (PL16). The MWP currently operates at a forward haul capacity of approximately 489 terajoules per day (TJ/day) (AEMC 2021). 1.2 Project overview and context NSW imports the majority of its natural gas from other states, and a gas shortfall on Australia’s east coast is predicted by Winter 2023, with demand for gas forecast to outstrip supply. APA is proposing an expansion of gas transportation capacity on its East Coast Grid that links Queensland to southern markets ahead of projected potential 2023 supply risks. Expansion would be through the construction of additional compressions stations and associated works on both the South West Queensland Pipeline (SWQP) and MWP in NSW. The expansion will be delivered in a number of stages. The first stage of expansion works includes the construction of a single site of compression on each of the SWQP and MWP and will increase Wallumbilla to Wilton capacity by 12%. The first stage is targeted for commissioning in the first quarter of 2023 ahead of forecast southern state winter supply risks identified in the 2021 Australian Energy Market Operator (AEMO) Gas Statement of Opportunities (AEMO 2021). The second stage of expansion works (an additional site on the SWQP and on the MWP) will add a further 13% capacity and will be staged to meet customer demand. APA is undertaking engineering and design works on a potential third stage (three additional compressor locations on the MWP) of the East Coast Grid to add a further 25% transportation capacity. All up, these proposed capacity expansions would mean that the entirety of NSW peak demand could be met by gas flowing from northern sources. The proposed East Coast Grid Expansion (the project) presents an optimal opportunity to maximise gas supply via existing infrastructure with minimal impact. J200919 | RP#10 | v2 1
The five compressor stations for the East Coast Grid Expansion will be constructed at the following locations on the
MWP:
•      Modification 1:

       -      Stage 1:

              ▪        MW880 – Milne approximately 35 km south-west of Condobolin.

       -      Stage 2:

              ▪        MW433 – Round Hill approximately 103 km north of Wilcannia.

•      Modification 2:

       -      Stage 3:

              ▪        MW162 – Binerah Downs approximately 68 km north-west of Tibooburra.

              ▪        MW300 – Mecoola Creek approximately 70 km south-east of Tibooburra.

              ▪        MW733 – Gilgunnia approximately 63 km south-west of Nymagee.

This report has been prepared to address the air quality impacts for Stage 1 and 2 of the expansion works and to
support Modification Report 1. As such, only the air quality impacts at MW433 and MW880 have been assessed in
this report. A separate report will be prepared to support Stage 3 in Modification Report 2.

1.3        Report purpose and method
EMM Consulting Pty Limited (EMM) has been commissioned to prepare an air quality and greenhouse gas
assessment (AQGHGA) for the construction and operation of the project. This assessment has been prepared in
general accordance with the Approved Methods for the Modelling and Assessment of Air Pollutants in New South
Wales (NSW EPA 2017), and includes the following:
•      description of the existing air quality and meteorological environment;

•      identification of potential emissions to air during construction and operation of the project;

•      assessment of potential impacts arising from emissions to air during construction and operation of the
       project;

•      estimation of greenhouse gas (GHG) emissions and benchmarks against GHG accounts for NSW and Australia;
       and

•      appropriate mitigation measures to reduce the impacts from the project.

J200919 | RP#10 | v2                                                                                               2
1.4 Study area and scope The assessment presents a qualitative risk-based assessment of potential air quality impacts for construction and a quantitative assessment of potential air quality impacts for operations. The assessment approach is applicable to each compressor station. The compressor stations are located in remote and sparsely populated rural areas. The proposed Stage 1 site at Milne (MW880) has two receptor locations (ie occupied residences) within 2.5 km. The proposed Stage 2 site at Round Hill (MW433) has no receptor locations within approximately 4.5 km. For the construction phase assessment, the construction methodology, scale of impacts and standard dust mitigation measures is consistent across both compressor station sites, and therefore the risk-based assessment of potential air quality impacts is applicable to each site. Due to the proximity of receptor locations, any proposed construction dust mitigation measures are most relevant to Milne (MW880). For the operational phase, the assessment focuses on the Milne (MW880) site and a quantitative assessment of potential air quality impacts is presented. Assuming compliance is demonstrated for the Milne (MW880) site, compliance can also be assumed for the Round Hill (MW433) site. Although local dispersion conditions would differ, any uncertainty or variation in dispersion conditions across the sites is offset by a separation distance to occupied residences that is double that of the Milne (MW880) site. J200919 | RP#10 | v2 3
2          Project and site description
2.1        Compressor station details
The East Coast Grid Expansion in NSW will be facilitated by the construction of five compressor stations along the
length of the MWP. This modification report addresses the construction and operation of two compressor stations:
Stage 1 (MW880) and Stage 2 (MW433).
Each compressor station will include:
•       an enclosed gas turbine driven compressor unit;

•       microturbine;

•       compressor inlet / scrubber;

•       a control equipment building;

•       two fuel gas skids;

•       air compressors and receivers;

•       associated piping, electrical equipment, instrumentation, and controls;

•       a station vent; and

•       small accommodation and maintenance buildings for operations.

All facilities will be installed on driven piles or supported on structural steel skids over gravel sheeting, with the
exception of the accommodation and maintenance buildings which will be constructed on concrete slab.
Both of the proposed sites for the compressor stations are on land owned by APA, with MW433 being
approximately 380 m x 400 m with an area of 15.5 hectares (ha), and MW880 being approximately 400 m x 400 m
with an area of 16 ha. The compressor station will have a final footprint of approximately 1.5 ha.

2.1.1      Construction

Each compressor station will require a construction footprint of approximately 3.5 ha, which will be reduced to
approximately 1.5 ha for operations.
At MW433, the temporary construction workforce required to build the compressor station will be accommodated
in a temporary accommodation camp, with mobilisation and demobilisation of the workforce to and from Broken
Hill airport for each roster. The temporary accommodation camp will measure approximately 100 m x 100 m, with
an additional 100 m x 100 m for waste water treatment. A smaller accommodation unit for operations will be
included within the operational footprint on the compressor station.
At MW880, there are two options for the accommodation of the construction workforce. The preferred option is
to house the workforce in short-term accommodation in Condobolin (42 km by road from the site), with potential
overflow accommodation in West Wyalong (85 km by road from the site), if required. Workers will be driven to and
from site each day, with between one and four buses and between five and eight cars required per day, depending
on workforce numbers. The alternative option is to use a temporary accommodation camp on site (as per MW433),
where mobilisation and demobilisation of the workforce will be to and from Dubbo airport for each roster.

J200919 | RP#10 | v2                                                                                                 4
Waste water from the construction camp (if used) will be treated and disposed of via spray irrigation on site.
Construction materials and supplies (including food and services for the temporary accommodation camps) will be
sourced from relevant suppliers and transported to site. APA will use local suppliers where practicable.
At MW880, water will likely be purchased under a commercial arrangement from Lachlan Shire Council, or another
local provider and transported to site by 25 kilolitre (kL) water truck. At MW433, there are two options for water
supply – accessing groundwater on site, and/or purchasing water under a commercial arrangement from a local
water provider and transporting it to site by 25 kL water truck. APA is investigating options to access groundwater
under the relevant water sharing plans and regulations. If accessing groundwater at MW433 is feasible, then all
regulatory requirements for water licences will be met, and any further assessments and approvals will be
undertaken and applied for prior to water abstraction. If accessing groundwater is not feasible for all or part of the
project, then the commercial purchase and transport will become the default water supply option.
The majority of construction activities will take place between 7:00 am and 6:00 pm, seven days per week. During
the commissioning phase, activities will also take place between 7:00 am and 6:00 pm, seven days per week,
however for the final two weeks, commissioning activities will be 24-hours per day.

i         Construction activities

Construction of the compressor stations will include the following activities:
•      mobilisation of construction equipment;

•      establishment of access (where required);

•      establishment of construction camp accommodation and associated facilities;

•      establishment of access to water supply;

•      site bulk earthworks including build up to match existing levels;

•      installation of steel piles;

•      installation of all equipment items, skids and buildings;

•      installation of associated steel structures, prefabricated piping, electrical equipment, instrumentation and
       controls;

•      supply and install communication and controls infrastructure;

•      demobilisation of construction equipment;

•      rehabilitation of temporary disturbance areas; and

•      pre-commissioning and commissioning of compressor station.

ii        Workforce

The construction of the compressor stations will require an average workforce of 40 with a peak of 80 personnel
over the 12-month period. All roles are likely to be drive-in-drive-out (DIDO) or fly-in-fly-out (FIFO) and based at the
construction camp when on site. The anticipated roster is three weeks on followed by one week off.

J200919 | RP#10 | v2                                                                                                   5
There are expected to be five contracts put out to tender for the construction and commissioning of the compressor
stations:
• earthworks and civil works;
• establishment of the construction camp and associated waste water treatment system;
• piling;
• structural, mechanical, piping, electrical and instrumentation construction (SMPEI); and
• compressor station pre-commissioning and commissioning.
In addition to the contractor workforce, APA will have a project team on site to manage the works.
The anticipated workforce associated with each contract is outlined in Table 2.1 below.
Table 2.1 Construction and commissioning workforce
Entity Average workforce Peak workforce
APA Project Team 4 10
Earthworks 10 15
Piling 6 6
SMPEI Construction 30 50
Construction Camp 8 16
Pre-commissioning and Commissioning 10 14
The anticipated workforce distribution over the 12-month construction and commissioning program is presented
in Table 2.2.
Table 2.2 Monthly construction and commissioning workforce distribution
1 2 3 4 5 6 7 8 9 10 11 12
20 28 28 37 47 65 68 59 49 39 18 18
2.1.2 Operation
i Activities
The compressor stations are designed to operate remotely without onsite staff for most of their working life. They
will be operated remotely from APA’s control centre in Brisbane, and can operate up to 24 hours per day, seven
days per week.
Typical operations activities will involve minor maintenance, calibrations, inspections, equipment performance
checks, or equipment repair if needed. Operation activities will be typically carried out during daylight hours, unless
an emergency requires urgent works at night. Site personnel will carry out inspections ranging from daily
inspections to more rigorous inspections that may vary from one month to 4 years apart, dependent on the works.
Detailed maintenance plans will be prepared for all sites.
J200919 | RP#10 | v2 6Regulatory compliance checks will be carried out on different equipment as prescribed in applicable standards but will typically vary from one to four-year intervals subject to the equipment types. Compliance checks may include emissions testing, hazardous area compliance assessments, pressure vessel inspections, and electrical safety checks. Major services and engine overhauls will be carried out at five-to-ten-year intervals subject to equipment condition, manufacturer’s recommendations and run hours. Once complete, the compressor stations will have an average design life of approximately 25 years. APA will continue to monitor the condition of equipment up to and beyond the end of life to ensure equipment is sound and fit for further service. Continued operation beyond the nominal design life will be subject to specific equipment condition and plant fitness assessments. The compressor station will be decommissioned when there is no further economic potential to continued use. ii Workforce The compressor stations are designed to operate as unmanned facilities. The typical site workforce for operation activities is expected to be one to two people. Larger groups of up to five people associated with major services or overhauls will be required to minimise the time the compressor station is offline. The operations workforce will comprise existing APA employees, who are unlikely to be resident locally. Additional specialist servicing will be carried out by a mix of local contractors and interstate/international based depending on the complexity of the task. 2.2 Site and surrounding area The proposed compressor station at Round Hill (MW433) is located in a remote rural location with few distinguishing topographical or land use features and mostly void of continuous vegetation. There are no sensitive receptors within 5 km. The Milne compressor station site (MW880) is also located in a remote rural location characterised by sparse pockets of vegetation. The terrain surrounding this site is flat with few distinguishing features. The closest residential properties are located approximately 1.7 km to the north-east and 2.5 km to the south-east. As discussed previously, the assessment focuses on the Milne (MW880) site and a quantitative assessment of potential air quality impacts is presented. Assuming compliance is demonstrated for the Milne (MW880) site, compliance can also be assumed for the Round Hill (MW433) site. The nearest representative sensitive receptors to the Milne site have been identified (referred to in this report as assessment locations). Details are provided in Table 2.3 and their locations are shown in Figure 2.1. J200919 | RP#10 | v2 7
Table 2.3          Air quality assessment locations

            Assessment                                     Coordinates (MGA)          Distance and direction from site
Station                   Lot/address
            location ID                           Zone     Easting (m) Northing (m)
MW880       MW880-R1      3208 Crown Camp Road        55    504346       6303586            ~2.5 km south-east
            MW880-R2      2557 Crown Camp Road        55    500259       6303227            ~3.5 km south-west
            MW880-R3      1276 West Milby Lane        55    499585       6306422               ~3.5 km west
            MW880-R4      1515 Clarries Lane          55    500470       6306804          ~2.7 km west-northwest
            MW880-R5      3341 Crown Camp Road        55    504341       6306539             ~1.7 km northeast
            MW880-R6      3368 Crown Camp Road        55    505859       6306714             ~3 km northeast
            MW880-R7      7241 The Gipps Way          55    506825       6306464             ~4 km northeast

J200919 | RP#10 | v2                                                                                                     8
KEY
Compressor site
! Sensitive receiver location
Moomba to Wilton pipeline
CROWN CAMP ROAD
Major road
Minor road
Vehicular track
Watercourse/drainage line
Waterbody
INSET KEY
NPWS reserve
WES
T MI ! R4 State forest
LBY R6
LANE
\\Emmsvr1\emm3\2020\J200919 - APA East Coast Expansion MWP\GIS\02_Maps\Noise\N005_MW880AssessmentLocations_20210618_03.mxd 5/07/2021
!
R3 !
R5 !
R7
!
CROWN C
A MP ROAD
R1
P ROAD
!
AM
! R2
CROWN C
Assessment locations
surrounding the Milne site
APA - East Coast Grid Expansion
Air quality impact assessment
Modification report 1
Figure 2.1
Source: EMM (2021); DFSI (2017); GA (2011); ASGC (2006); LPI (2021) 0 0.5 1
km
GDA 1994 MGA Zone 55 ´3 Pollutants and assessment criteria
3.1 Introduction
The key emissions sources and pollutants applicable to the construction of the project include:
• fugitive dust from clearing, excavation, material handling, movement of plant and equipment, and wind
erosion of exposed surfaces, comprising:
- total suspended particulate matter (TSP);
- particulate matter less than 10 micrometres (µm) in aerodynamic diameter (PM10); and
- particulate matter less than 2.5 µm in aerodynamic diameter (PM2.5);
• diesel exhaust emissions from construction equipment, comprising:
- PM2.5;
- oxides of nitrogen (NOx)1, including nitrogen dioxide (NO2);
- sulphur dioxide (SO2);
- carbon monoxide (CO); and
- volatile organic compounds (VOCs).
For the operational phase, the key pollutants associated with the combustion of natural gas are oxides of nitrogen
(NOx), carbon monoxide (CO), sulphur dioxide (SO2) and volatile organic compounds (VOCs). Operational emissions
would be emitted from the ventilation stacks associated with each compressor.
3.2 Applicable air quality assessment criteria
The NSW EPA’s impact assessment criteria, as documented in Section 7 of the Approved Methods for the Modelling
and Assessment of Air Pollutants in New South Wales (NSW EPA 2017), are presented in Table 3.1 (common or
‘criteria’ air pollutants) and Table 3.2 (principal and individual toxic air pollutants).
For the pollutants listed in Table 3.1, the assessment criteria are applied at the nearest existing or likely future
sensitive receptor2. Typically, the following must be reported the pollutants in Table 3.1:
• the incremental impact (ie the predicted impact due to the project alone); and
• the total impact (ie the incremental impact plus the existing background concentration). Guidance on the
selection of background concentrations is provided in NSW EPA (2017).
1 By convention, NOx = Nitrous oxide (NO) + NO2.
2 NSW EPA (2016) defines a sensitive receptor as a location where people are likely to work or reside; this may include a dwelling, school, hospital,
office or public recreational area.
J200919 | RP#10 | v2 10TSP, which relates to airborne particles less than around 50 micrometres (µm) in diameter, is used as a metric for
assessing amenity impacts (reduction in visibility, dust deposition and soiling of buildings and surfaces) rather than
health impacts (NSW EPA 2013). Dust deposition impacts are derived from TSP emission rates and particle
deposition calculations in the dispersion modelling process.
Particles less than 10 µm in diameter, accounted for in this assessment by PM10 and PM2.5, are a subset of TSP and
are fine enough to enter the human respiratory system and can therefore lead to adverse human health impacts.
The NSW EPA impact assessment criteria for PM10 and PM2.5 are therefore used to assess the potential impacts of
airborne particulate matter on human health.
Table 3.1 Impact assessment criteria – common pollutants
Pollutant Averaging period Impact assessment criteria
TSP Annual 90 µg/m3
PM10 24-hour 50 µg/m3
Annual 25 µg/m3
PM2.5 24-hour 25 µg/m3
Annual 8 µg/m3
Dust deposition Annual 2 g/m2/month (project increment only)
4 g/m2/month (cumulative)
NO2 1-hour 246 µg/m3
Annual 62 µg/m3
CO 15-minute 100 mg/m3
1-hour 30 mg/m3
8-hour 10 mg/m3
SO2 10-minute 712 µg/m3
1-hour 570 µg/m3
24-hour 228 µg/m3
Annual 60 µg/m3
Notes: µg/m3: micrograms per cubic metre
In the case of the short-term criteria (1-hour NO2, 24-hour PM10 and 24-hour PM2.5), the total prediction must be
reported as the 100th percentile (ie the highest) value. At some locations, the background concentrations can
exceed the impact assessment criteria. This is most commonly the case for PM10 and PM2.5, which are affected by
events such as bushfires and dust storms. In such circumstances, there is a requirement demonstrate that no
additional exceedances of the impact assessment criteria will occur as a result of the proposed activity and that
best management practices will be implemented to minimise emissions of air pollutants as far as is practical.
There are no impact assessment criteria for total VOCs, however impact assessment criteria are prescribed for
various individual toxic and odorous VOCs, and some of the more commonly assessed substances are presented in
Table 3.2. Impact assessment criteria for VOCs are applied at and beyond the boundary of the emitting source, with
the incremental impact (ie predicted impacts due to the pollutant source alone) reported as the 99.9th percentile
concentration for an averaging period of 1 hour.
J200919 | RP#10 | v2 11Table 3.2 Impact assessment criteria – VOCs Pollutant Averaging period Impact assessment criteria Individual VOCs Benzene 1-hour (99.9th percentile) 29 µg/m3 Formaldehyde 1-hour (99.9th percentile) 20 µg/m3 Toluene 1-hour (99.9th percentile) 360 µg/m3 Xylene 1-hour (99.9th percentile) 190 µg/m3 3.3 Screening criteria and assessment of risk Typically, air quality impacts assessments will assess compliance against the impact assessment criteria presented in Table 3.1 and Table 3.2, with the assessment of risk based on whether compliance with these impact assessment criteria is achieved or not. For this study, a qualitative assessment of risk was also made, based on criteria used in other jurisdictions for screening out insignificant impacts. The NSW EPA do not prescribe criteria for screening out insignificant impacts, however in Western Australia, the WA Department of Water and Environmental Regulation (DWER) has developed draft guidelines for air emissions, outlining the use of screening concentrations (SC) to screen out emission sources as insignificant (DWER 2019). The SC are expressed as a percentage of their air quality guidelines values (AGVs). For annual averages, the SC are
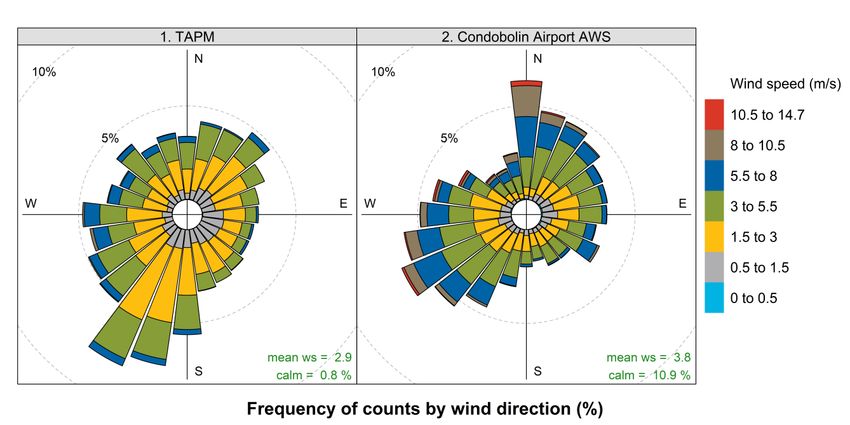
4           Existing environment
4.1         Meteorology and climate
Meteorological mechanisms govern the generation, dispersion, transformation and eventual removal of pollutants
from the atmosphere. To adequately characterise the dispersion meteorology of a region, information is needed
on the prevailing wind regime, ambient temperature, rainfall, relative humidity, mixing depth and atmospheric
stability.
Analysis of meteorology for the study area is based on automatic weather stations (AWS) operated by the Bureau
of Meteorology (BoM) summarised in Table 4.1.

Table 4.1          Regional meteorological monitoring sites

Site                                                 Location relative to the project sites
Condobolin Airport AWS                               ~40 km north east of Milne (MW880)
White Cliffs AWS                                     ~50 km south west of Round Hill (MW433)

4.1.1       Regional winds

Annual wind roses for 2018 for the regional monitoring sites are presented in Figure 4.1. Regional variation in wind
direction is evident while mean wind speeds range from 3.6 metres per second (m/s) to 4.9 m/s. Mean wind speeds
are noticeably higher and the frequency of calm winds (wind speeds less than 0.5 m/s) noticeably lower at the
White Cliffs site.

4.1.2       Rainfall

Precipitation is important to air pollution, as it impacts on dust generation potential and represents a removal
mechanism for atmospheric pollutants. Fugitive emissions may be harder to control during low rainfall years while
drier periods may also result in more frequent dust storms and bushfire activity, resulting in higher regional
background. Rainfall also acts as a removal mechanism, lowering pollutant concentrations by removing them more
efficiently than during dry periods.
Monthly rainfall data were obtained from the regional monitoring sites in Table 4.1 and the monthly variation in
rainfall is illustrated in Figure 4.2. As expected, monthly mean rainfall decreases with increasing distance inland.
Rainfall for the Condobolin area is moderate to low, with mean annual rainfall of 437 millimetres (mm), decreasing
to 255 mm for White Cliffs.

J200919 | RP#10 | v2                                                                                              13
Figure 4.1             Wind roses for the regional monitoring sites (BoM)

J200919 | RP#10 | v2                                                        14
Figure 4.2             Monthly mean rainfall for the regional monitoring sites

J200919 | RP#10 | v2                                                             15
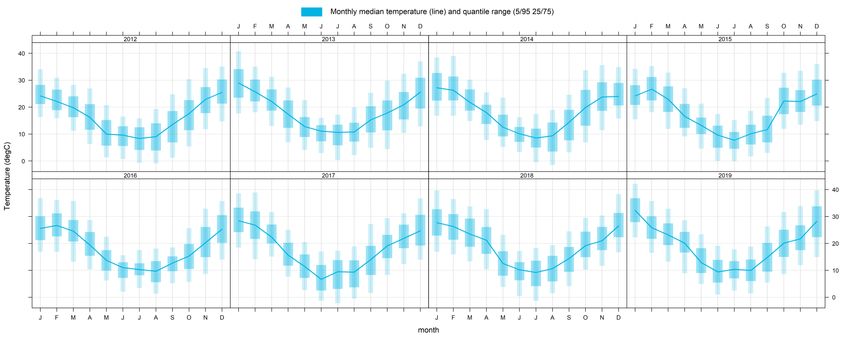
4.2         Meteorological modelling
Atmospheric dispersion modelling for this assessment uses the AMS3/USEPA4 regulatory model (AERMOD) (model
version v19191). In the absence of local meteorological data for the MW880 (Milne) site, the meteorological inputs
for AERMOD were generated using the AERMET meteorological processor based on data generated by the
Commonwealth Scientific and Industrial Research Organisation (CSIRO) TAPM meteorological modelling module.
Meteorological data from the Condobolin Airport AWS was used as observations for the TAPM run.
Meteorological parameters were extracted from TAPM at the MW880 (Milne) site and used within the AERMET
pre-processor in the ‘onsite’ pathway. Parameters extracted from TAPM included wind speed and direction,
temperature, relative humidity, solar radiation, and mixing height. The difference in temperature between two
heights (50-10 m) was extracted from the TAPM profile files and upper air data was read directly from the surface
file. Atmospheric pressure was taken from Condobolin Airport and cloud data was taken from Cobar Airport AWS.

4.2.1       Selection of a representative dataset for modelling

Eight years of hourly data from Condobolin Airport were reviewed and annual wind roses for the period 2012 to
2019 are presented in Figure 4.3. The analysis shows consistency in wind direction, average wind speed and
percentage occurrence of calm winds (less than or equal to 0.5 m/s). The high degree of consistency in winds across
all years indicates that any calendar year would be suitable for modelling. The inter-annual variation in temperature
is presented Figure 4.4. The box and whisker plots show monthly median temperature and the monthly quantile
ranges (5/95 and 25/75). The plots demonstrate that temperatures measured across each year are consistent and
therefore representative when compared with this recent period of measurements.
The calendar year 2018 was selected for modelling.

3     AMS - American Meteorological Society
4     USEPA - United States Environmental Protection Agency

J200919 | RP#10 | v2                                                                                               16
Figure 4.3             Annual wind roses for Condobolin Airport (BOM)

J200919 | RP#10 | v2                                                    17
Figure 4.4             Interannual variation in temperature for Condobolin Airport

J200919 | RP#10 | v2                                                                 18
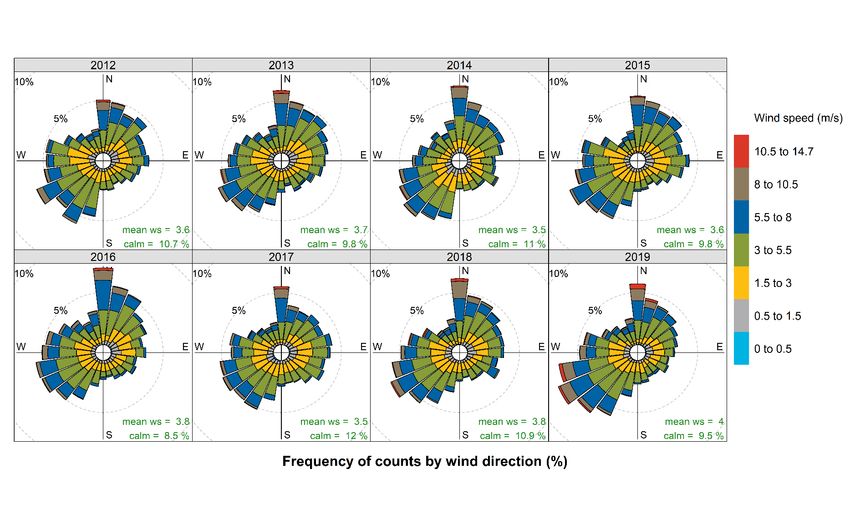
4.2.2     TAPM predicted winds for the Milne site

An annual wind rose created from wind speed and direction data extracted from TAPM at the Milne site is shown
in Figure 4.5 and compared with the closest observations at Condobolin Airport. The wind rose for Milne shows
that winds are recorded from all directions with a dominantly south-southwest flow. Annual average wind speeds
(2.9 m/s) and frequency of calm conditions (0.8%) are lower than the observations at Condobolin Airport.

Figure 4.5        TAPM wind rose for the Milne site (BOM)

4.2.3     Atmospheric stability and mixing depth

Atmospheric stability refers to the degree of turbulence or mixing that occurs within the atmosphere and is a
controlling factor in the rate of atmospheric dispersion of pollutants.
The Monin-Obukhov length (L) provides a measure of the stability of the surface layer (ie the layer above the ground
in which vertical variation of heat and momentum flux is negligible; typically, about 10% of the mixing height).
Negative L values correspond to unstable atmospheric conditions, while positive L values correspond to stable
atmospheric conditions. Very large positive or negative L values correspond to neutral atmospheric conditions.
Figure 4.6 illustrates the diurnal variation of atmospheric stability, derived from the Monin-Obukhov length
calculated by AERMET. The diurnal profile shows that atmospheric instability increases during the daylight hours as
the sun generated convective energy increases, whereas stable atmospheric conditions prevail during the night-
time. This profile indicates that the potential for effective atmospheric dispersion of emissions would be greatest
during daytime hours and lowest during evening through to early morning hours.

J200919 | RP#10 | v2                                                                                              19
Figure 4.6        CALMET-calculated diurnal variation in atmospheric stability

Mixing depth refers to the height of the atmosphere above ground level within which air pollution can be dispersed.
The mixing depth of the atmosphere is influenced by mechanical (associated with wind speed) and thermal
(associated with solar radiation) turbulence. Similar to the Monin-Obukhov length analysis above, higher daytime
wind speeds and the onset of incoming solar radiation increases the amount of mechanical and convective
turbulence in the atmosphere. As turbulence increases, so too does the depth of the boundary layer, generally
contributing to higher mixing depths and greater potential for the atmospheric dispersion of pollutants.
Figure 4.7 presents the hourly-varying atmospheric boundary layer depths generated by AERMET. Greater
boundary layer depths occur during the daytime hours, peaking in the mid to late afternoon.

J200919 | RP#10 | v2                                                                                             20
Figure 4.7        CALMET-calculated diurnal variation in atmospheric mixing depth

4.3       Baseline air quality
To demonstrate compliance with impact assessment criteria, consideration of cumulative impact is required to
assess how a project will interact with existing and future sources of emissions. There are no proposed or existing
major projects in the vicinity of the proposed sites that would result in cumulative impacts during the construction
or operation of the project. Similarly, there are no commercial or industrial facilities in the vicinity of the proposed
sites that either report to the National Pollutant Inventory (NPI) or hold an environment protection licence (EPL)
issued by the NSW EPA. Assessment of cumulative impacts therefore focuses on the existing baseline or background
air quality.
The air quality environment for the proposed sites is expected to be primarily influenced by fugitive dust during dry
conditions, from agricultural activity and continental scale wind erosion from exposed ground, and to a lesser
extent, local traffic travelling along sealed and unsealed roads, seasonal emissions from wood heaters or burning
and episodic emissions from bushfires.
The closest NSW Department of Planning, Industry and Environment (DPIE) air quality monitoring station (AQMS)
is located at Orange, approximately 200 km east of the Milne (MW880) site, and is unlikely to be representative of
the existing background concentration in the vicinity of the Milne site. There are no other DPIE AQMS located in
far-west NSW that can be used to describe and characterise ambient air quality.

J200919 | RP#10 | v2                                                                                                 21
However, the Community DustWatch network, also operated by DPIE, measures dust (as PM10) via a network of
instruments at DustWatch Nodes (generally using TSI DustTraks). The data are not used to report on air quality and
health-related issues, rather, measurements are used as an indicator for land management (ie adequacy of ground
cover in delivering healthy soils, clean air, functioning ecosystems and agricultural production). The Community
DustWatch network includes ‘nodes’ at Condobolin and White Cliffs, recording hours of dust activity, defined as
PM10 concentrations >25 µg/m³.
During 2018 at Condobolin there were 61 hours of the year where the reported PM10 concentrations were greater
than 25 µg/m³, increasing to 107 hours White Cliffs (this increase is to be expected, as dryer conditions increase
with distance inland). While these data cannot be used to derive a baseline for air quality assessment, they are
useful to provide some context to the existing air quality environment for the risk-based assessment of construction
phase impacts.
For the key pollutants associated with the operational phase (NOx, CO, VOCs) there are no significant local sources
that would contribute to background air quality, other than minor contributions from traffic and agricultural plant
and equipment. On this basis, the ambient background for these pollutants can be assumed to be very low or
negligible.

J200919 | RP#10 | v2                                                                                              22
5            Construction phase impact assessment
5.1          Introduction
Construction works at the compressor stations will include:
•       establishment of access (where required);

•       establishment of construction camp accommodation and associated facilities;

•       access to water supply;

•       site bulk earthworks including build up to match existing levels;

•       supply and install of Civil, Structural, Mechanical, Electrical and Instrumentation packages;

•       the installation of new compressor station ventilation outlets;

•       supply and install fuel gas conditioning skid including immersion heater, filter, meter and regulators; and

•       supply and install communication and controls infrastructure.

The main air pollution and amenity issues5 at construction sites are:
•       annoyance due to dust deposition (soiling of surfaces) and visible dust plumes;

•       elevated particulate matter less than 10 µm in aerodynamic diameter (PM10) concentrations due to dust-
        generating activities; and

•       particulate matter exhaust emissions from diesel-powered construction equipment6.

Very high levels of dust deposition can also damage plants and affect the diversity of ecosystems.
Dust emissions can occur during the preparation of the land (eg demolition and earthmoving) and during
construction itself. They can vary substantially from day to day depending on the level of activity, the specific
operations being undertaken, and the weather conditions. The risk of dust impacts from a construction site is
related to the following:
•       the nature of the activities being undertaken;

•       the duration of the activities;

•       the size of the site;

•       the meteorological conditions (wind speed, direction and rainfall), as adverse impacts are more likely to
        occur downwind of the site and during drier periods;

5   There are other potential impacts, such as the release of heavy metals, asbestos fibres or other pollutants during the demolition of certain buildings.
    These issues need to be considered on a site by site basis (IAQM 2014).
6   Exhaust emissions from on-site plant and site traffic are unlikely to have a significant impact on local air quality, and in the majority of cases they
    will not need to be quantitatively assessed (IAQM 2014).

J200919 | RP#10 | v2                                                                                                                                    23
• the proximity of receptors to the activities;
• the sensitivity of the receptors to dust; and
• the adequacy of the mitigation measures applied to reduce or eliminate dust generation.
5.2 Construction assessment
The proposed compressor station sites were considered in an assessment of potential construction dust impacts.
The assessment follows the Guidance on the Assessment of Dust from Demolition and Construction published by
the Institute of Air Quality Management in the United Kingdom (IAQM 2014). This guidance has been applied for
construction projects in NSW and accepted by the NSW EPA as a progressive approach to assessing the particulate
matter impact risk associated with short term construction and demolition projects.
The IAQM assessment procedure considers four main types of activities at construction sites: demolition,
earthworks, construction and vehicle track-out. Impacts are considered based on annoyance due to dust soiling,
the risk of health effects due to an increased exposure to PM10, and harm to ecological receptors. The assessment
is used to define appropriate mitigation measures to ensure that there will be no significant residual effects.
The key steps in the procedure are as follows:
• Step 1 – a screening requirement for a detailed assessment based on the proximity of surrounding receptors;
• Step 2 – an assessment of the risk of dust impacts and the sensitivity of surrounding receptors;
• Step 3 – a determination of site-specific mitigation;
• Step 4 – consideration of residual effects and significance; and
• Step 5 – an assessment report (this document).
Step 1 of the method specifies that a detailed construction dust assessment should be undertaken if:
• a human receptor7 is located within 350 m of the site boundary;
• an ecological receptor8 is located within 50 m of the site boundary; or
• a human/ecological receptor is within 50 m of a route used by construction vehicles up to 500 m from a site
entrance.
There are no human receptors located within 350 m of any of the compressor station sites. There are also no
sensitive ecological receptors within 50 m of the sites or human or ecological receptors within 50 m of construction
routes. Therefore, the risk assessment does not proceed past Step 1 and the risk of adverse effects due to
construction dust is considered negligible for all sites. Regardless of risk levels, it is good practice to ensure that
mitigation measures are in place to minimise construction dust as far as possible (see Section 5.3).
7 A ‘human receptor’ refers to any location where a person or property may experience the adverse effects of airborne dust or dust soiling, or
exposure to PM10 over a time period relevant to air quality standards and goals. In terms of annoyance effects, this will most commonly relate to
dwellings, but may also refer to other premises such as museums, galleries, vehicle showrooms, food manufacturers, electronics manufacturers,
amenity areas and horticultural operations.
8 An ‘ecological receptor’ refers to any sensitive habitat affected by dust soiling. This includes the direct impacts on vegetation or aquatic
ecosystems of dust deposition, and the indirect impacts on fauna (eg on foraging habitats).
J200919 | RP#10 | v2 245.3 Mitigation measures
A construction environmental management plan (CEMP) will be prepared which will outline measures to manage
dust and other emissions. These may include but are not limited to the measures listed in Table 5.1. Justification
for the selection of mitigation measures is based on what would be considered good practice mitigation for
construction projects.
Table 5.1 Mitigation measures – construction emissions
Impact Mitigation measure Responsibility Timing
Reporting and record • Develop appropriate communications in the stakeholder Contractor Establish communications
keeping engagement plan to notify the potentially impacted and complaints management
residences of the project (duration, types of works, etc), system prior to the
relevant contact details for environmental complaints commencement of
reporting. construction.
• A complaints management system should be maintained Ongoing reporting and record
throughout the construction phase which should include keeping throughout the
any complaints related to dust. Where a dust complaint is duration of construction
received, the details of the response actions to the activities.
complaint should be detailed in the register.
Dust generation - • Provide an adequate water supply on the construction site Contractor Throughout the duration of
general for effective dust/particulate matter construction activities.
suppression/mitigation.
• Avoid site runoff of water or mud.
Materials handling • Prevention of truck overloading to reduce spillage during Contractor Throughout the duration of
loading/unloading and hauling. construction activities.
Soil stripping • Soil stripping will be limited to areas required for Contractor Throughout the duration of
extraction / construction of foundations, etc. construction activities.
Exposed areas • Only the minimum area necessary will be disturbed. Contractor Throughout the duration of
• Exposed areas will be stabilised as soon as practicable. construction activities.
Dust generation from • Watering of main haulage routes as required. Contractor Throughout the duration of
vehicles moving on • Routes to be clearly marked and speed limits enforced. construction activities.
unpaved roads
• Ensure vehicles entering and leaving sites are covered to
prevent escape of materials during transport.
Vehicle fuel • Ensure proper maintenance and tuning of all equipment Contractor Throughout the duration of
combustion emissions engines. construction activities.
• Ensure vehicles switch off engines when not in use.
J200919 | RP#10 | v2 255.4 Summary of commitments
The following commitments will minimise air quality impacts associated with the project:
Table 5.2 Summary of commitments – air quality
Stage Commitment ID Commitment
Construction GE-01 The approved construction footprint, including vegetation clearing extent and environmental or
heritage features within the construction footprint, will be clearly demarcated and identified
during the construction stage with survey pegs and at some locations with flagging, bunting,
barrier mesh or similar. No go zones will be clearly marked and communicated as such.
Construction GE-03 Rehabilitation of disturbed areas will commence progressively as soon as practicable during and
after construction, and will be carried out in accordance with the SWMP and Landcom (2004).
Construction GE-04 A complaints management system will be put in place that documents:
Operation • name of persons receiving complaint;
• name of person making the complaint;
• date and time of complaint;
• nature of the complaint;
• actions taken to rectify;
• actions to minimise risk of reoccurrence; and
• name of person(s) responsible for undertaking the required actions.
Construction GE-05 All project personnel will complete an induction that will include environmental and heritage
management requirements.
Construction GE-06 Nearby landholders will be provided a dedicated point of contact for the duration of the project.
Operation
Construction AQ-01 Stabilisation of exposed soils will be undertaken as soon as practicable, and dust suppression
undertaken as required using water sprays, water extension agents, soil stabilising polymers or
other media on:
• unpaved work areas subject to traffic or wind;
• exposed soil;
• main haulage routes, as required;
• sand, spoil and aggregate stockpiles; and
• during the loading and unloading of dust generating materials.
When water is used for dust suppression, it will not be applied in a way that causes ponding or
runoff.
Construction AQ-02 Construction vehicles with potential for loss of loads (such as dust or litter) will not be
overloaded and will be covered when using public roads.
Construction AQ-03 Plant and equipment will be maintained in good condition to minimise ignition risk, fuel
Operation consumption, spills and air emissions that may cause nuisance.
Construction AQ-04 Plant, equipment and vehicle engines will be switched off when not in use.
Operation
Design SE-01 The existing stakeholder engagement plan will continue to be implemented to facilitate ongoing
Construction consultation with relevant stakeholders, including local businesses, throughout the project so
that stakeholders have access to information regarding the nature of the proposed project
Operation
activities and their likely impacts.
J200919 | RP#10 | v2 266 Operational phase impact assessment
6.1 Emissions
The operation of the gas pipeline and compressor stations will vary according to gas demand, which is often driven
by weather conditions (ie higher heating demand in winter) and working days (ie less demand on weekends). Gas
flows (and the associated operation of compressor stations) will therefore vary on a seasonal, weekly and daily
basis. Demand is highest during the winter period, typically April through to late September, and during this window
there may be periods when all proposed compressor stations need to be operational. Variation in demand will also
dictate the operational load under which the turbines operate.
The typical intraday operational load for each stage of the development is as follows:
• Stage 1 - MW880 operating at loads between ~60% and >~95%; and
• Stage 2 - MW880 operating at loads between ~30% and >~95% and MW433 operating at loads >80%.
Emissions data were provided by the turbine supplier (Solar Turbines) for the Mars100-C65 which will be used at
both MW880 and MW433. Emission estimates were provided for different operating loads and summarised in
Table 6.1. As shown in Table 6.1, the highest NOx emission rate for MW880 occurs for the 96.6% load scenario
(shown in bold), while the highest emission rate for CO and VOC occurs for the low load scenario (18%) (shown in
bold). Emissions of SO2 are a function of the sulphur content of the fuel, therefore emissions will be higher at higher
loads (because more fuel is combusted).
As described in Section 3.2, there are short-term (1-hour average) impact assessment criteria prescribed for the key
pollutants of concern, therefore the approach for modelling is to model the worst case emission hour for every
hour of the year (in this way, the worst case emission hour is paired with every possible meteorological condition).
It is noted that the worst-case emission hour under the low load scenario may not happen very often, therefore the
approach provides a conservative assessment of impacts. It is also noted that this is a very conservative approach
for comparing against the long-term (annual) average impact assessment criteria.
The emission rates shown in bold in Table 6.1 are used for modelling.
Table 6.1 Emissions data for Mars100-C65
Load Ambient Emission rates (kg/hr) Emission rates (g/s)
Compressor model Location (%) temperature
NOx CO VOC SO2 NOx CO VOC1 SO2
(oC)
Mars-100-C65 MW880 18 20 3.2 58 80 0.9 16.1 22.2
30 20 3.7 27 68 1.0 7.5 18.9
40 20 4.1 2.5 57 1.1 0.7 15.8
96.1 20 7.4 5.9 1.7 0.009 2.1 1.6 0.5 0.003
MW433 20 20 3.4 62 84 0.9 17.2 23.3
30 20 3.8 28 69 1.1 7.8 19.2
40 20 4.2 2.5 58 1.2 0.7 16.1
Note: 1 Reported as UHC (unburnt hydrocarbons) in the emission data
J200919 | RP#10 | v2 27You can also read