Arctic Oscillation and Polar Vortex Analysis and Forecasts
←
→
Page content transcription
If your browser does not render page correctly, please read the page content below

Arctic Oscillation and Polar Vortex Analysis
                  and Forecasts
                                    January 17, 2022

Dear AO/PV blog readers:
We have shifted the public release of the Arctic Oscillation/Polar Vortex blog to
Wednesdays weekly through the winter season.
For those who would like an early look on Mondays, we will be offering at a nominal
price (US $25) a PDF version of the upcoming blog, and we will be rolling out in the
coming weeks access to the datasets used in the production of this blog. At present
we plan to make available in comma-separated values the timeseries of the Polar Cap
Height and the timeseries of the Wave Activity Flux (vertical component), though we
would appreciate to hear your suggestions for additional data of interest to you all.

Dr. Judah Cohen from Atmospheric and Environmental Research (AER) embarked on an
experimental process of regular research, review, and analysis of the Arctic Oscillation
(AO) and Polar Vortex (PV). This analysis is intended to provide researchers and
practitioners real-time insights on one of North America’s and Europe’s leading drivers
for extreme and persistent temperature patterns.

During the winter schedule the blog is updated once every week. Snow accumulation
forecasts replace precipitation forecasts. Also, there is renewed emphasis on ice and
snow boundary conditions and their influence on hemispheric weather. With the start of
spring we transition to a spring/summer schedule, which is once every two weeks.
Snow accumulation forecasts will be replaced by precipitation forecasts. Also, there will
be less emphasis on ice and snow boundary conditions and their influence on
hemispheric weather.

Subscribe to our email list or follow me on Twitter (@judah47) for notification of updates.

The AO/PV blog is partially supported by NSF grant AGS: 1657748.

Summary

   •   The Arctic Oscillation (AO) is currently positive and is predicted to straddle
       neutral the next two weeks with mixed pressure/geopotential height anomalies
       across the Arctic and mixed pressure/geopotential height anomalies across the
       mid-latitudes. The North Atlantic Oscillation (NAO) is also near neutral and is
       predicted to straddle mostly neutral as pressure/geopotential height anomalies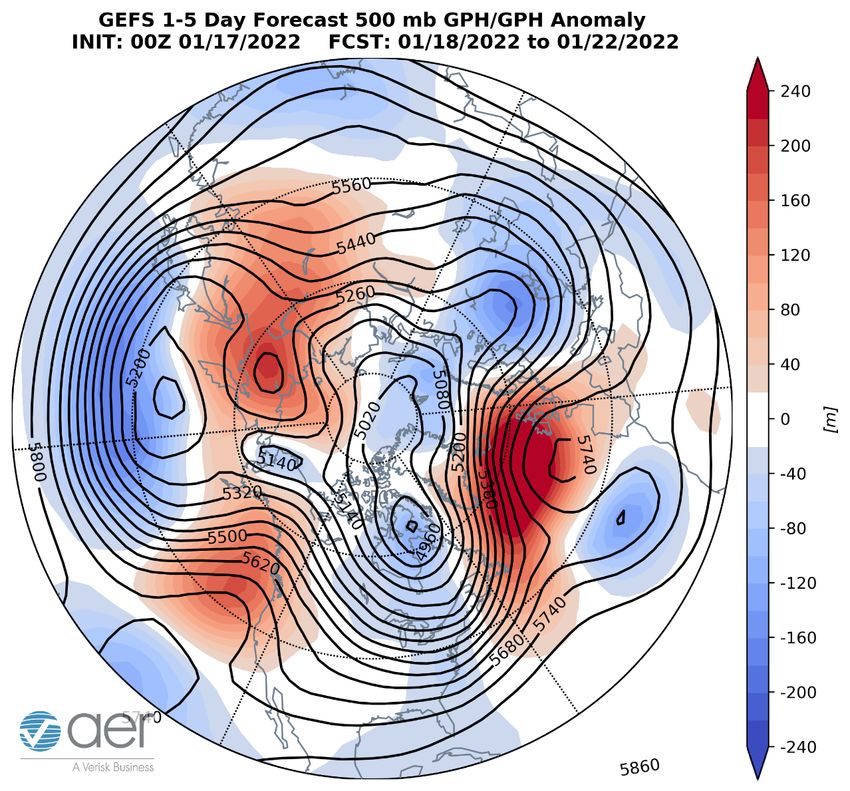
are predicted to remain weak and transitory across Greenland the next two
       weeks.
   •   This week into next week, ridging/positive geopotential height anomalies
       centered just west of the United Kingdom (UK) will force northerly flow across
       Western Europe and troughing/negative geopotential height anomalies across
       Eastern Europe. This will favor normal to below normal temperatures across
       Western and Southern Europe including the UK with normal to above normal
       temperatures across Northern and Eastern Europe this week. However, next
       week as North Atlantic ridging/positive geopotential height anomalies
       retrogrades westward into the central North Atlantic, troughing/negative
       geopotential height anomalies coupled with normal to below normal
       temperatures will become more widespread across Europe.
   •   The dominant pattern across Asia the next two weeks is a quasi-omega block
       pattern with troughing/negative geopotential height anomalies coupled with
       normal to below normal temperatures across far Western and Eastern Asia with
       ridging/positive geopotential height anomalies coupled with normal to above
       normal temperatures dominating much of the interior of Asia. However normal
       to below normal temperatures are predicted to remain localized across Asia.
   •   The dominant pattern across North America the next weeks is amplified
       ridging/positive geopotential height anomalies coupled with normal to above
       normal temperatures in the Gulf of Alaska and along the west coast of North
       America with deep troughing/negative geopotential height anomalies coupled
       with normal to below normal temperatures across Eastern Canada and the
       Eastern United States (US).
   •   In the Impacts section I continue to discuss my expectations for the polar vortex
       (PV) and the weather of the Northern Hemisphere (NH) as we transition into
       February.
Plain Language Summary

We just had one stretched polar vortex event, and another is ongoing. These two events
will contribute to a colder and snowier pattern in the Eastern US for much of January. I
think what happens in early February depends on whether we get a third stretched polar
vortex event right at the end of the month. If one occurs early February could be cold
and if not, it will likely be mild. Europe will turn colder due to high pressure/ridging in
the central North Atlantic that will induce a colder northerly flow across much of the
continent. Still, lots of uncertainty heading into early February as the current pattern is
highly anomalous.

Impacts

Happy first day of not meteorological or astronomical but Cohen winter (at least in the
Eastern US) – Martin Luther King Day! The Eastern US experienced its biggest
snowstorm of the season so far over the past two days, though not in the I95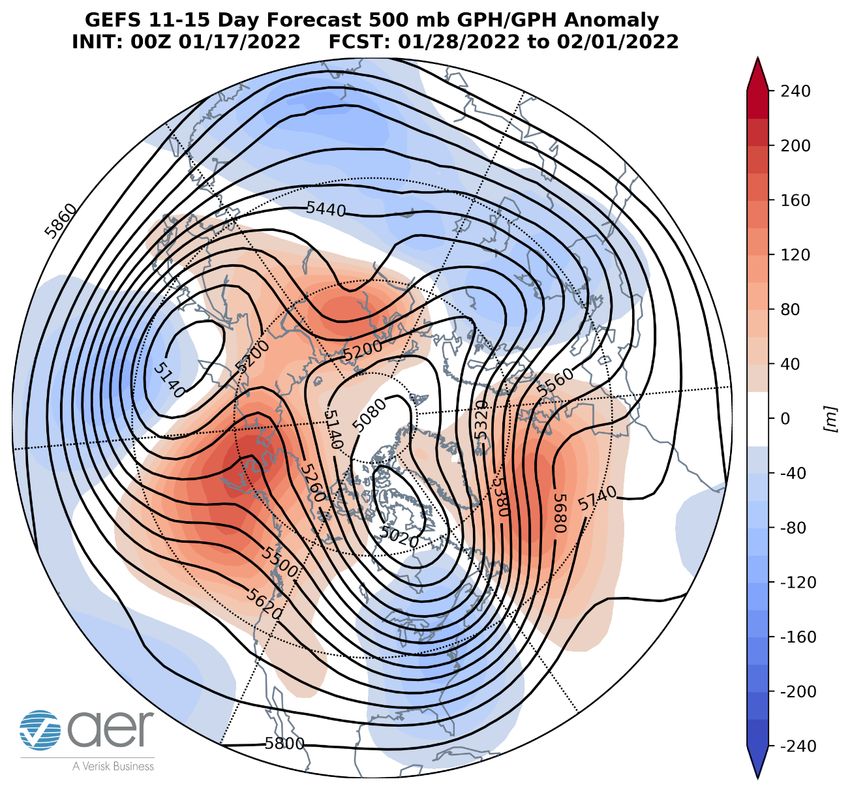
megalopolis cities of the Northeastern US. The pattern looks active for the foreseeable
future with cold and possibly snow, though based on our snow ensemble plots no big
signals this morning.

I hate to be a broken record but all I can think about again today is how this remains a
challenging forecast period. The pattern so far this winter in the Eastern US has been -
relatively warm October, cold November, warm December and now likely a cold
January. So based on that calendar friendly monthly checkered pattern, February will be
relatively warm and finally March will be cold. Ah if it were only that easy.

I mentioned on Twitter that our experimental machine learning model is predicting a
warmup in the Eastern US in early February. So far, I am very encouraged by the
performance of the machine learning model and that the model is predicting a pattern
flip deserves to be considered. But I know from benchmarking its accuracy based on
historical forecasts or hindcasts that the model is not perfect.

And as far as I can tell the machine learning model is consistent with long range
forecasts from the dynamical models (GFS, Canadian and EPS). It seems that the
models are predicting that the entire mid-tropospheric circulation in the Western
Hemisphere will retrograde or rotate to the west. This would bring the ridging currently
near Western Europe into the Eastern US, the troughing in eastern North America back
into western North America and the ridging in the Gulf of Alaska closer to the
Aleutians. And in a broad sense the circulation of February would resemble that of
December. Though for what it's worth, the current CFS is predicting a cold February for
the Eastern US (see Figure 15).

But I remain wary of this simple by straightforward forecast. As I have been discussing
all winter the polar cap geopotential height anomalies (PCHs) continue to show
cold/negative PCHs in the stratosphere but warm/positive PCHs in the troposphere
continuously from mid-December and predicted right into early February. This is an
exceptionally long time for the troposphere and stratosphere to remain uncoupled (at
least in the classical sense of either a strong or weak PV are coupled with a positive or
negative surface AO respectively). I did check my historical PCHs to find something
analogous and the only winter that exhibited something similar over the reanalysis
period is the winter of 2013/14 (see Figure i). For much of the winter from December
through February the stratosphere and troposphere remained uncoupled with some
brief exceptions (e.g., second week of January and second week of February).

Figure i. Observed daily polar cap height (i.e., area-averaged geopotential heights
  poleward of 60°N) standardized anomalies from 1 October 2013 through 31 March
                                         2014.

That winter experienced repeated stretched PV events throughout the winter that
combined to produce a harsh winter in the Eastern US especially around the Great
Lakes. I don’t see anything matching the magnitude of cold (and it was quite snowy as
well) from that winter but could the stretched PVs from January continue into February
that would favor cold in the Eastern US?

Looking at the dynamical model forecasts episodic Ural ridging/high pressure is
predicted over the next two weeks. I include an animation of the 500 hPa geopotential
heights over the next two weeks from this morning’s operational GFS (Figure ii). I think
that it is consistent with ensemble forecasts predicting high heights near the Urals,
though each event is brief and likely not persistent enough to initiate a sudden
stratospheric warming (SSW). My research shows that Ural ridging/high pressure is
the source of energy that initiates stretched PV events. In addition, our recent
paper, Cohen et al. 2021, suggests that blocking in the North Atlantic is a precursor to
stretched PV events, which is predicted over the next two weeks.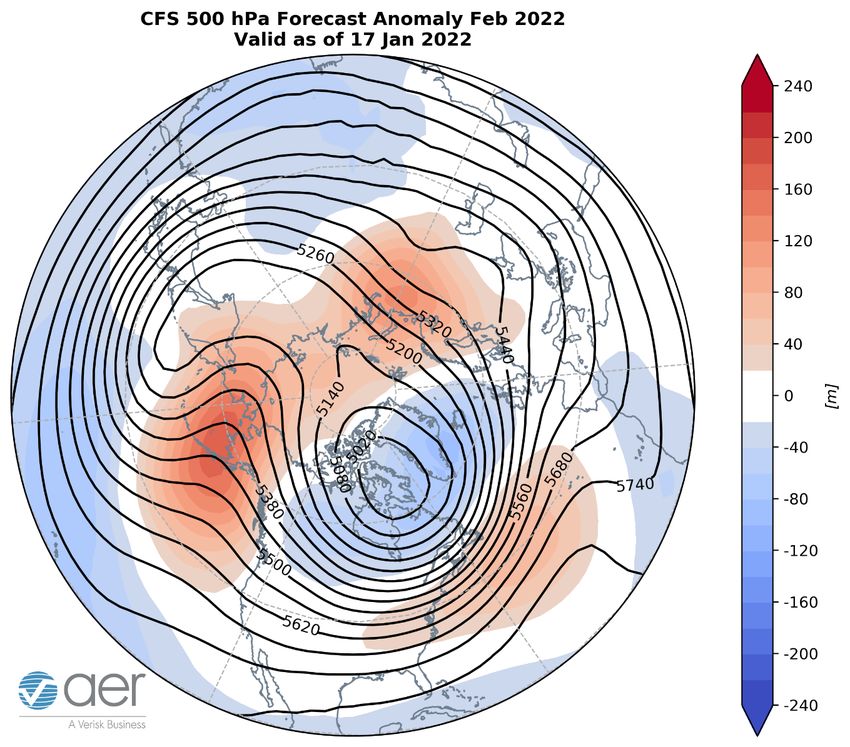
Figure ii, CLICK for Loop

 Figure ii. (a) Initialized 500 mb geopotential heights (dam; contours) and temperature
   anomalies (°C; shading) across the Northern Hemisphere for 17 January 2022 and
   forecasted from 18 January – 2 February 2022. The forecasts are from the 00Z 17
                             January 2022 GFS model ensemble.

Our now operational diagnostics to anticipate stretched PV events are playing a game
of hide and seek or peek-a-boo one, day indicating another stretched PV at the end of
January just to take it away the next day. So in summary, I believe that the atmospheric
conditions remain favorable for subsequent stretched PV events in addition to the two
so far this month but not certain.

I would be very content to simply throw up my hands and say cold Eastern US for the
remainder of January with anything possible for February but then what is the purpose
of the blog? Even in winter 2013/14, where I believe the forcing for stretched PVs was
more robust, the cold in the Eastern US was not continuous but episodic, though some
of those cold episodes were unusually long in duration for stretched PV events. One
particularly long stretch followed a stretched PV event in early February when the
stratospheric PCHs turned briefly warm (see Figure i). I don’t see anything similar in the
foreseeable future, but if that were to happen, then I would be more confident of a
longer duration cold spell in the Eastern US. So, I think at least a relaxation of the cold
for the Eastern US in early February makes a lot of sense even if it doesn’t mean a
complete breakdown of the cold pattern. But I do think conditions remain favorable for
stretched PV events and I don’t think the two observed this winter are the only events of
the winter and I would expect more. A brief turn to milder weather would likely include a
brief coupling of the cold/negative PCHs from the stratosphere to the surface. A
complete breakdown of the colder pattern would be a more extended coupling of the
cold/negative PCHs from the stratosphere to the surface. This latter scenario would
pretty much put an end to meaningful winter weather in the Eastern US until next year,
unless there was very early Final Warming or an early exit of the PV.

I realize that I have been focused on the Eastern US and not Europe or East Asia but that
is where I think the forecast is most interesting. I really think for widespread significant
winter weather to occur in Europe a larger disruption of the PV needs to occur,
preferably a PV split. Hard for me to convince myself that a large PV disruption is likely
anytime soon, though some GFS forecasts have been suggestive. Besides repeated
stretched PV events we have also observed repeated North Atlantic ridging that has
kept Europe close to seasonable as opposed to seasonable or even unseasonably
warm. I believe this atmospheric feature to be transient and would expect it to move on
in early February. Though there has been some regional high impact winter weather like
this past week in Southeastern Europe.

Central and East Asia should also be cold during stretched PV events, but I have been
underwhelmed by the temperature anomalies in Asia and relative cold seems to be
mostly localized. Though enough to produce some spectacular snowfalls in Japan. If
Ural blocking could become more persistent then East Asia and the Eastern US could
turn colder.

1-5 day

The AO is predicted to be neutral this week (Figure 1) as geopotential height anomalies
are predicted to be mixed across the Arctic with mixed geopotential height anomalies
across the mid-latitudes of the NH (Figure 2). And with weak and mixed geopotential
height anomalies predicted across Greenland (Figure 2), the NAO is also predicted to be
neutral this week as well (Figure 1).

Figure 1. (a) The predicted daily-mean AO at 1000 hPa from the 00Z 17 January 2022
 GFS ensemble. (b)The predicted daily-mean near-surface AO from the 00Z 17 January
 2022 GFS ensemble. Gray lines indicate the AO index from each individual ensemble
    member, with the ensemble-mean AO index given by the red line with squares.

This week, ridging/positive geopotential height anomalies centered just west of the UK
will promote northerly flow across Western Europe and troughing/negative geopotential
height anomalies in Eastern Europe this period (Figures 2). The resultant northerly flow
and/or low heights will result in normal to below normal temperatures across Western
and Southern Europe with normal to above normal temperatures across Northern and
Eastern Europe (Figure 3). This week, ridging/positive geopotential height anomalies
will dominate much of Central Asia with troughing/negative geopotential height
anomalies limited to Western Asia and Far East Asia (Figure 2). This pattern favors
widespread normal to above normal temperatures across much of Asia with normal to
below normal temperatures confined to parts of Western and Far East Asia including
Eastern Siberia (Figure 3).
Figure 2. Forecasted average 500 mb geopotential heights (dam; contours) and
geopotential height anomalies (m; shading) across the Northern Hemisphere from 18 –
  22 January 2022. The forecasts are from the 00z 17 January 2022 GFS ensemble.

This week, the predicted pattern across North America is ridging/positive geopotential
height anomalies across Alaska, Western Canada and the Western US which will
contribute to deepening troughing/negative geopotential height anomalies across
Eastern Canada and the Eastern US this period (Figure 2). This will favor normal to
above normal temperatures across eastern Alaska, Western Canada and the Western
US with normal to below normal temperatures in western Alaska, Central and Eastern
Canada and the Central and Eastern US (Figure 3).

Figure 3. Forecasted surface temperature anomalies (°C; shading) from 18 – 22
     January 2022. The forecast is from the 00Z 17 January 2022 GFS ensemble.

Troughing and/or cold temperatures are predicted to support new snowfall across
Norway, Southeastern Europe including Turkey, Central Asia and the Tibetan Plateau
while mild temperatures promote snowmelt in and around the Baltic Sea, Western Asia
and the Far East (Figure 4). Troughing and/or cold temperatures are predicted to
support new snowfall across Southern and Eastern Canada and possibly the Deep
South while mild temperatures promote snowmelt in Western Canada, the Western US
and the Northeastern US (Figure 4).

  Figure 4. Forecasted snow depth changes (mm/day; shading) from 18 – 22 January
          2022. The forecast is from the 00Z 17 January 2022 GFS ensemble.

Mid-Term

6-10 day
The AO is predicted to remain close to neutral or slightly positive this period (Figure 1)
as geopotential height anomalies remain mixed to mostly negative across the central
Arctic with mixed geopotential height anomalies across the mid-latitudes of the NH
(Figure 5). And with weak and mixed geopotential height anomalies across Greenland
(Figure 5), the NAO is predicted to remain near neutral this period.

   Figure 5. Forecasted average 500 mb geopotential heights (dam; contours) and
geopotential height anomalies (m; shading) across the Northern Hemisphere from 23 –
  27 January 2022. The forecasts are from the 00z 17 January 2022 GFS ensemble.

Persistent ridging/positive geopotential height anomalies in the North Atlantic just west
of the UK will support northerly flow across Western Europe and troughing/negative
geopotential height anomalies across Eastern Europe (Figures 5). This will result
in normal to below normal temperatures across Western and Southern Europe including
the UK with normal to above normal temperatures across Northern and Eastern Europe
(Figure 6). Ridging/positive geopotential height anomalies are still predicted dominate
much of Asia except for troughing/negative geopotential height anomalies in far
Western and Southern Asia and Eastern Siberia this period (Figure 5). This pattern
favors normal to above normal temperatures across much of Asia with normal to below
normal temperatures limited to parts of Western and Southern Asia and Eastern
Siberia (Figure 6).

    Figure 6. Forecasted surface temperature anomalies (°C; shading) from 23 – 27
    January 2022. The forecasts are from the 00Z 17 January 2022 GFS ensemble.

Ridging/positive geopotential height anomalies are predicted to persist across Alaska,
Western Canada and the Western US this period helping to anchor troughing/negative
geopotential height anomalies across Eastern Canada and the Eastern US (Figure
5). This will favor normal to below normal temperatures across far western Alaska,
much of Eastern Canada and the Eastern US with normal to above normal temperatures
in much of Alaska, Western Canada and the Western US (Figure 6).

  Figure 7. Forecasted snow depth changes (mm/day; shading) from 23 – 27 January
          2022. The forecast is from the 00Z 17 January 2022 GFS ensemble.
Troughing and/or cold temperatures are predicted to support new snowfall across Norway, Southeastern Europe including Turkey, Central Asia, the Tibetan Plateau and Eastern Siberia while milder temperatures promote snowmelt across Northeastern Europe, Western and Eastern Asia (Figure 7). Troughing and/or cold temperatures are predicted to support new snowfall across western Alaska, Northern and Eastern Canada, and the Northeastern US while milder temperatures promote snowmelt across Southern Alaska, Western Canada and the Western US (Figure 7). 11-15 day With geopotential height anomalies predicted to be positive across the North Pacific side of the Arctic but neutral across the Central and North Atlantic side of the Arctic and mixed geopotential height anomalies across the mid-latitudes of the NH (Figure 8), the AO should remain close to neutral this period (Figure 1). With predicted mostly positive but weak pressure/geopotential height anomalies across Greenland (Figure 8), the NAO is forecasted to remain near neutral this period.
Figure 8. Forecasted average 500 mb geopotential heights (dam; contours) and
 geopotential height anomalies (m; shading) across the Northern Hemisphere from 28
   January – 2 February 2022. The forecasts are from the 00z 17 January 2022 GFS
                                     ensemble.

Persistent ridging/positive geopotential height anomalies in the central North Atlantic
are predicted to continue to support northerly flow across Western Europe and
troughing/negative geopotential height anomalies across Central and Eastern Europe
with any ridging mostly confined to far Western Europe including the UK this period
(Figure 8). This pattern favors more normal to below normal temperatures across
much of Europe with normal to above normal temperatures across far Northern and
Eastern this period (Figures 9). Troughing/negative geopotential height anomalies are
predicted in Northwestern, Northeastern and Southern Asia with ridging/positive
geopotential height anomalies across much of Siberia this period (Figure 8). This
pattern favors more widespread normal to below normal temperatures across Southern
Asia and parts of Western and Northeastern Asia with normal to above normal
temperatures widespread across much of Northern and Central Asia this period (Figure
9).

Figure 9. Forecasted surface temperature anomalies (°C; shading) from 28 January – 2
    February 2022. The forecasts are from the 00z 17 January 2022 GFS ensemble.

Ridging/positive geopotential height anomalies are predicted to persist across western
North America and centered near the Aleutians contributing to anchoring
troughing/negative geopotential height anomalies in eastern North America this period
(Figure 8). This pattern favors normal to above normal temperatures across Alaska,
Northern Canada and the Western US with normal to below normal temperatures in
Southern and Eastern Canada and the Central and Eastern US (Figure 9).
Figure 10. Forecasted snow depth changes (mm/day; shading) from 28 January – 2
February 2022. The forecast is from the 00Z 17 January 2022 GFS ensemble.
Troughing and/or cold temperatures are predicted to support possible new snowfall
across the higher elevations of Southern Europe, Central and Eastern Europe including
Turkey, Western and Eastern Asia and the higher elevations of Southern Asia while
milder temperatures promote snowmelt across Western and Central Siberia (Figure 10).
Troughing and/or cold temperatures are predicted to support possible new snowfall
across Northern and Western Canada and the Western US while milder temperatures
promote snowmelt across Alaska, Southern Canada and the Northeastern US
(Figure 10).
Longer Term
30–day
The latest plot of the polar cap geopotential height anomalies (PCHs) currently shows
cold/negative PCHs throughout the stratosphere and lower troposphere with
warm/positive PCHs in the mid to upper troposphere (Figure 11). The negative
departures are predicted to deepen in the upper stratosphere over the next two weeks
(Figure 11). Currently the stratosphere and troposphere are decoupled and waiting for
coupling to resume, though exactly how remains an open question to me. This
extended stretch of decoupled PCHs is highly unusual.Figure 11. Observed and predicted daily polar cap height (i.e., area-averaged
geopotential heights poleward of 60°N) standardized anomalies. The forecast is from
the 00Z 17 January 2022 GFS ensemble.
The normal to below normal PCHs predicted early this week in the lower troposphere
are consistent with the predicted positive surface AO early this week (Figure 1). The
PCH forecast continues to look strange today and suggests repetitive troposphere-
(very) low stratosphere-troposphere coupling events that are quite shallow and
condensed in time. Regardless I believe that a stretched PV is the best way to
understand stratosphere-troposphere coupling this month.
The vertical Wave Activity Flux (WAFz) from the troposphere to the stratosphere or
poleward heat transport in the stratosphere is predicted to remain mostly below normal
(Figure 12). A more active period is possible towards the end of the month. The
negative WAFz anomalies predicted over the next two weeks will continue to support a
relatively strong PV through mid- to late-January as suggested by the relatively cold
stratospheric PCHs. Though again not all strong PVs are created equal, and I think a
stretched polar vortex is what is most critical right now.Figure 12. Observed and predicted daily vertical component of the wave activity flux
(WAFz) standardized anomalies, averaged poleward of 40-80°N. The forecast is from
the 00Z 17 January 2022 GFS ensemble.
Though zonally averaged WAFz is weak, another stretched stratospheric PV and second
of this month seems to be occurring with the PV centered near Svalbard with ridging
centered on the Aleutians and polar stratospheric warming across the Beaufort Sea,
Alaska and Northwest Canada. In addition, the PV exhibits a stretched configuration
from the Urals to Eastern Canada and not circular (Figure 13). However, the
perturbation is relatively minor, and the PV is relatively strong resulting in a current
positive stratospheric AO (Figure 11).Figure 13. (a) Intiialized10 mb geopotential heights (dam; contours) and temperature
anomalies (°C; shading) across the Northern Hemisphere for 17 January 2022. (b) Same
as (a) except forecasted averaged from 28 January – 2 February 2022. The forecasts
are from the 00Z 17 January 2022 GFS model ensemble.
The below normal WAFz is predicted to allow the PV to strengthen and become quite
strong with the PV remaining centered between the North Pole and Svalbard at the end
of January (Figure 13) with a persistent positive stratospheric AO the next two weeks
(Figure 11). The strengthening stratospheric PV could couple with the surface
commencing a relatively mild period across the US and Europe, sometime in February.
Figure 14. Forecasted average 500 mb geopotential heights (dam; contours) and
geopotential height anomalies (m; shading) across the Northern Hemisphere for
February 2022. The forecasts are from the 00Z 17 January 2022 CFS.I include in this week’s blog the monthly 500 hPa geopotential heights (Figure 14) and
surface temperatures for February (Figure 15) from the Climate Forecast System (CFS;
the plots represent yesterday’s four ensemble members). The forecast for the
troposphere is ridging centered over the Urals, Eastern Siberia, Alaska and the Gulf of
Alaska and the western North Atlantic with troughing across Western Europe, Eastern
Asia, most of Canada and the Northwestern US (Figure 14). This pattern favors
seasonable to relatively warm temperatures across Scandinavia, Western Asia, much of
Siberia, Alaska, Northwestern Canada and Southwestern US with seasonable to
relatively cold temperatures across much of Europe, Central and Eastern Asia, much of
Canada and the Northern and Eastern US (Figure 15).
Figure 15. Forecasted average surface temperature anomalies (°C; shading) across the
Northern Hemisphere for February 2022. The forecasts are from the 00Z 17 January
2022 CFS.
Surface Boundary Conditions
Arctic Sea ice
Arctic sea ice is growing but remains below normal mostly in Baffin Bay and is above
normal in the Bering Sea. Overall sea ice is relatively extensive compared to recent
winters, though it remains relatively thin. In the Barents-Kara Seas extent is close to
normal. Below normal sea ice in the Barents-Kara seas favors cold temperatures in
Central and East Asia, while below normal sea ice in Baffin Bay favors cold
temperatures in the Eastern and Northern Europe however this topic remains
controversial. Recent research has shown that the regional anomalies that are most
highly correlated with the strength of the stratospheric PV are across the Barents-Kara
seas region where low Arctic Sea ice favors a weaker winter PV. Low sea ice in theChukchi, Beaufort and Bering seas may favor colder temperatures across North
America but has not been shown to weaken the PV.
Figure 16. Observed Arctic Sea ice extent on 16 January 2022 (white). Orange line
shows climatological extent of sea ice based on the years 1981-2010. Image from the
National Snow and Ice Data Center (NSIDC).
SSTs/El Niño/Southern Oscillation
Equatorial Pacific Sea surface temperatures (SSTs) anomalies are below normal and we
continue to observe weak to possibly moderate La Niña conditions (Figure 17) and La
Niña conditions are expected through the winter. Observed SSTs across the NH remain
well above normal especially in the central North Pacific (west of recent years), the
western North Pacific and offshore of eastern North America though below normal
SSTs exist regionally especially in the North Pacific. Not my expertise but the SST
pattern in the North Pacific are strongly resembling a negative Pacific DecadalOscillation (PDO) pattern that favors colder temperatures across northwestern North
America and milder temperatures across southeastern North America.
Figure 17. The latest weekly-mean global SST anomalies (ending 16 January 2022).
Data from NOAA OI High-Resolution dataset.
Currently no phase of the Madden Julian Oscillation (MJO) is favored (Figure 18). The
forecasts are for the MJO to remain weak but could briefly pop into phase seven before
weakening again to where no phase is favored. MJO phase seven favors high latitude
blocking including Alaska. Initially phase seven favors troughing and cold
temperatures in the Western US and ridging and mild temperatures in the Eastern US
but then reverses. To be honest not sure what to make of the MJO forcing this month
but doesn't seem to be much of a factor currently but admittedly this is outside of my
expertise.Figure 18. Past and forecast values of the MJO index. Forecast values from the 00Z 17 January ECMWF model. Yellow lines indicate individual ensemble-member forecasts, with the green line showing the ensemble-mean. A measure of the model “spread” is denoted by the gray shading. Sector numbers indicate the phase of the MJO, with geographical labels indicating where anomalous convection occurs during that phase. Image source: http://www.atmos.albany.edu/facstaff/roundy/waves/phasediags.html Get Detailed Seasonal Weather Intelligence with sCast We appreciate your taking the time to read the public Arctic Oscillation blog from Dr. Judah Cohen and the AER Seasonal Forecasting team. Dr. Cohen’s detailed monthly seasonal forecast, sCast, is also available for purchase. sCast provides a monthly 30-60-90-180-day outlook into temperature and precipitation, solar flux and wind anomalies across the globe, and regional population weighted cooling and heating degree forecasts for the US. Our sCast principal engineer, Karl Pfeiffer, can help you use sCast and other AER seasonal forecast products to deliver important, long-lead time weather intelligence to your business. Please reach out to Karl today!
You can also read