Assessment Methodology Review of Length-Based Assessment Methods - Pacific Fishery Management ...
←
→
Page content transcription
If your browser does not render page correctly, please read the page content below
Agenda Item D.4
                                                                                Attachment 2
                                                                              September 2020

   Assessment Methodology Review of Length-Based Assessment Methods
Panel Members:
André Punt (Chair), Scientific and Statistical Committee (SSC), Univ. of Washington
John Budrick, SSC, California Department of Fish and Wildlife
Jason Cope, Northwest Fisheries Science Center
E.J. Dick, Southwest Fisheries Science Center
John Field, SSC, Southwest Fisheries Science Center
Melissa Haltuch, SSC, Northwest Fisheries Science Center
Owen Hamel, SSC, Northwest Fisheries Science Center
Kristin Marshall, SSC, Northwest Fisheries Science Center
Jason Schaffler, SSC, Muckleshoot Indian Tribe
Theresa Tsou, SSC, Washington Department of Fish and Wildlife
Will White, SSC, Oregon State University

Pacific Fishery Management Council (Council) Representative:
John DeVore, Council Staff

Proponents
Jason Cope, Northwest Fisheries Science Center
Merrill Rudd, Scaleability LLC
Chantel Wetzel, Northwest Fisheries Science Center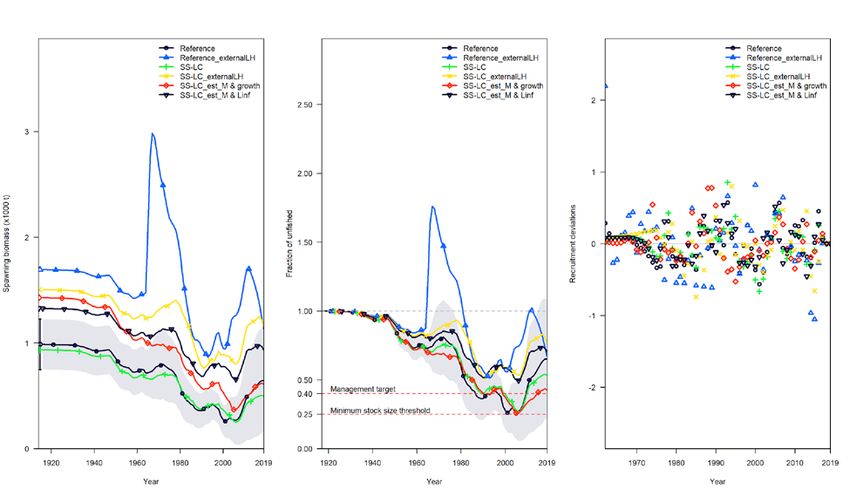
1) Overview
The review of length-based assessment methods was conducted by a Methodology Review Panel
(Panel) convened via webinar May 12th to 14th, 2020. This review was conducted in conjunction
with a workshop on data-moderate and data-limited assessment methods. The review focused on
two analytical approaches that are heavily reliant on fish length data, as well as a catch time
series: Stock Synthesis with Catches and Length (SS-CL) and the Length-based Integrated
Mixed Effects (LIME) assessment platform.
    Introductions were made (see list of attendees, Appendix 1), the goals for the review and its
Terms of Reference (TOR; Appendix 2) were reviewed, and the agenda was adopted. Rapporteur
assignments were made and the plan for finalizing the report was outlined.
    The primary document provided to the Panel addressed testing of SS-CL using simulated
data sets and the consequences of reducing the data types (index, length composition, age
composition and quantity of length data) in previously conducted benchmark stock assessments.
Other background documents were provided (Appendix 3).
    Drs. Merrill Rudd, Chantel Wetzel and Jason Cope presented the SS-CL and LIME methods,
the results of simulation testing of SS-CL, and comparisons of the results of benchmark
assessments for West Coast groundfish when elements of the data used for parameter estimation
are ignored during model fitting. In their evaluation of LIME, the proponents found LIME
required many additional changes to fully realize the length and catch modeling configuration.
The level of change needed was beyond the time available, so further consideration of LIME
would require additional development and testing before it could be considered for use in Pacific
Fishery Management Council (PMFC) stock assessments.
    The Panel agreed that the SS-CL method should be adopted for use in PFMC groundfish
stock assessments, along with the flow chart of tasks that should be conducted for any SS-CL
assessment (Appendix 4), subject to completion of several short-term research tasks (see Section
6). The Panel also agreed that an extension to SS-CL (SS-CL+Index, i.e., SS-CL with index data
from fishery-independent surveys, e.g., West Coast Groundfish Bottom Trawl Survey) could be
adopted and reviewed under the TOR for data-moderate assessments. The Panel made
suggestions for the TOR for Stock Assessments to reflect the broader range of data-moderate
assessments were SS-CL and SS-CL+Index to be adopted, and also identified criteria for
identifying stocks that could be subject to data-moderate stock assessments.
    The chair thanked the analysts for providing documentation of the reviewed methods and for
responding to the requests for additional analyses, the PFMC staff for their assistance with
making a remote meeting work effectively, and the rapporteurs for their rapid and complete draft
notes.

1. Stock Synthesis with catches and lengths
1.1 Technical basis
Options for data-limited stock assessments have grown rapidly over the past decade. The PFMC
was an early adopter of catch-only methods (i.e., category 3 methods) in order to meet Annual
Catch Limit (ACL) requirements in the Magnusson Stevens Act (MSA). Subsequent
development of a data-moderate (i.e., category 2 methods) assessment occurred during a 2011
SSC methods review. This category currently recognizes catch with index-based methods, but
not catch with length-based methods. The latter methods were briefly discussed in the 2011
review when Dr. Steve Ralston presented a model with catch and length (only) data for aurora
rockfish, and was considered potentially a promising approach. However, the Panel requested
further research and testing to determine if catch with length methods would be reliable. The
need to reconsider such approaches has become more evident as there are many groundfish

                                               2
stocks where index data are not available or informative, but for which a time series of length
compositions is available. In addition, there are challenges with obtaining age data and using
them in assessments, which has hindered the ability to produce higher category assessments for
some groundfish stocks.
    Dr. Cope began the session with a presentation on the SS-CL framework titled “Evaluating
the performance of length and catch models in the Stock Synthesis framework.” He described
differences between the current PFMC stock categories, pointing out that data-limited (catch-
only, e.g., Depleted-Based Stock Reduction Analysis [DB-SRA] and Simple Stock Synthesis
[SSS]) methods are elevated to data-moderate status with the addition of abundance indices (e.g.,
production models, Extended Depletion-Based Stock Reduction Analysis [XDB-SRA] and
Extended Simple Stock Synthesis [XSSS]).
    Dr. Cope then summarized existing assessment methods (Table 1). Length-only methods
provide information about fishing intensity and relative stock status but not yield, e.g., Length-
based Spawner per Recruit (LB-SPR) – an extension of the Fraction of Lifetime Egg Production
method (O’Farrell and Botsford, 2006), and LIME without catch data. Indicator methods can be
used to inform changes in yield without status information. Catch-only methods provide
information about yield, but require information about stock status (e.g., Depletion Corrected
Average Catch [DCAC], DB-SRA, and SSS). Extended catch-only methods with priors on stock
status (e.g., XDB-SRA and XSSS) are reparameterized surplus production models. Length with
catch methods infer trends in fishing mortality rate from length data, providing estimates of
status.
    Dr. Cope described the cabezon stock assessment to further motivate the development of SS-
CL. For this species, an estimate of status (biomass relative to unfished) was obtained using LB-
SPR (a length-only model). This status estimate was then used as an input into the catch-only
SSS model. The SS-CL model combines these steps into a single framework, providing an
integrated approach that relies on data that are frequently available.

1.2 Technical basis for SS-CL
The technical team stated that applying SS-CL is very similar to conducting a standard Stock
Synthesis (SS) assessment. Since SS-CL is based on Stock Synthesis, all equations for the model
can be found in the SS documentation (Appendix A of Methot and Wetzel, 2013). In the
technical description below, Italics indicate where the SS-CL model differs from a standard SS
model. Underlined parentheticals indicate similarities to standard SS approaches. SS-CL file set-
ups are treated as follows.

Data file treatment
   • As many fleets, sexes, etc. as desired
   • Catches are a full time series and assumed known
   • Length compositions are assumed to be representative; Effective sample size is treated in
       standard way
   • No other data (e.g., indices and age compositions) available to the model.

Control file treatment
   • Life history values (i.e., steepness, growth parameters (k, L ∞ , t 0 ), natural mortality,
      fecundity, maturity) are generally pre-specified rather than being estimated (some degree
      of this does happen in many standard SS models).

                                                2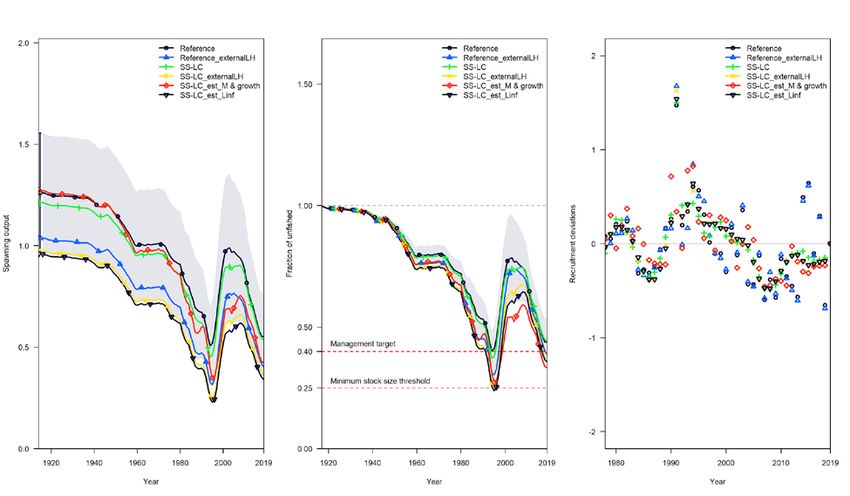
•   Recruitment can be estimated; standard bias correction procedures followed
   •   Selectivity can be estimated
   •   Data-weighting, only needed if the model includes multiple fleets; follows standard
       procedures as outlined in the TOR for Stock Assessments.

Starter and forecast files
These files are specified as in traditional SS.

Dr. Cope noted that performance and stability of SS-CL was better with smaller model
dimensions (e.g., fewer fleets). The Panel noted that methods such as SS-CL would be sensitive
to errors in the fixed values for L ∞ and the coefficient of variation (CV) of length-at-age, and this
is explored in the requested additional analyses.

1.3 Testing of SS-CL using simulated data sets
Dr. Rudd presented ‘Simulation-testing SS with catches and lengths’, a study that simulation-
tested SS-CL to examine performance in estimating stock status and catch limits using catch and
length data. This study considered various life history and data scenarios representative of U.S.
West Coast groundfish stocks. Life history scenarios varied in longevity (i.e., maximum age) and
growth (i.e., how quickly fish reach asymptotic length). All scenarios included 100 years of catch
data based on a F/F MSY time series that was common across life history types. Two levels of
recruitment standard deviation (σ R ; 0.4 and 0.8) were also considered. Stock Synthesis was used
as the operating model (OM) to simulate 100 iterations of “true” populations for each
combination of life history, fishing mortality, and recruitment variability scenario, with
simulation replicates varying from each other within each scenario due to the input recruitment
deviations. SS files were set up with values representing each scenario (e.g., life history values,
recruitment standard deviation, input fishing mortality rates) and SS run to obtain the true values
from the “Report.sso” file. Length data were generated for each length data scenario using the
expected data values from the “data.ss_new” file. Catches were assumed to be known without
error.
     Two test scenarios considering whether patterns in bias and precision were due to length
sampling scenarios and not model misspecification (i.e., apart from the uncertainty in the data,
the operating and estimation models were identical). The “data-rich” scenario included length
composition known without error for all 100 years and a high input sample size, as well as an
abundance index and age composition with high sample size, to demonstrate the model was
unbiased given an ideal data scenario. The “perfect” scenario included length-composition data
known without error for all 100 years and a high input sample size, but excluded the index and
age-composition data. The multinomial distribution was then used to sample from the true
length-composition. Sample sizes included 200 samples annually, 50 samples annually, or 200
samples until year 87 out of 100 and then 50 samples from year 88 to 100. Each sample size
scenario varied the number of years of length data included in the model: 75, 20, 10, 5, 2, and 1
year of length data. The estimation model (EM) was SS v.3.30.14, estimating the log of
equilibrium recruitment, left-side double-normal selectivity parameters (i.e., shape and peak of a
double logistic selectivity function parameters to mimic an asymptotic selectivity function), and
recruitment deviations. The first year of estimated recruitment deviates was set relative to the
first year of length data that was available less the maximum age (i.e., the short life history with
a maximum age of 30 and only one year of length data started recruitment estimation 30 years
prior to the data). The last year of estimated recruitment deviates was the last year of the time
                                                  3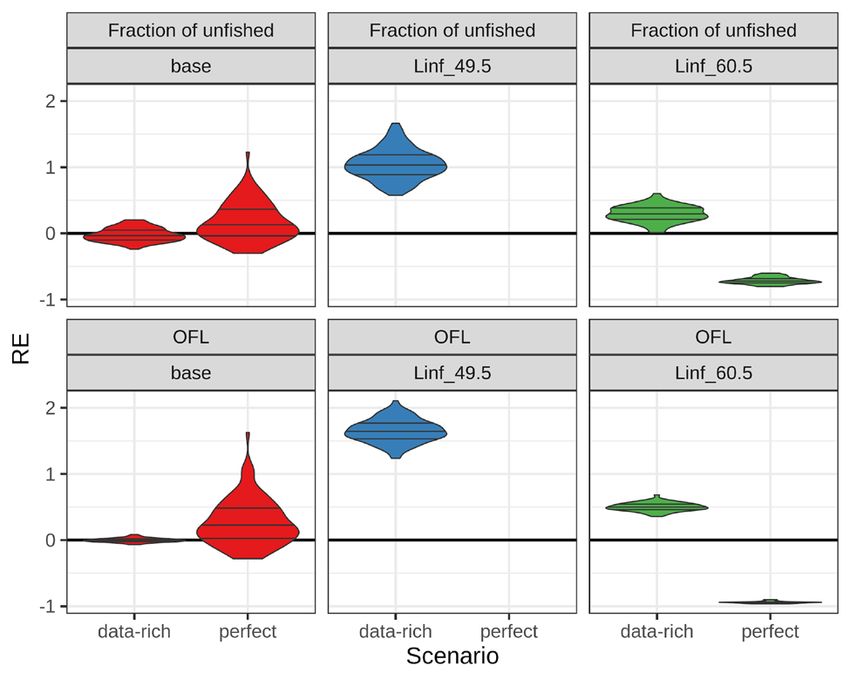
series less the age at 5% selectivity. Early recruitment deviates were estimated 30 years prior to
the first year of fishery removals to prevent biases in estimates of the unfished spawning
biomass, and the iterative procedure for bias adjustment from Methot and Taylor (2011) was
applied. Performance of each scenario was assessed in terms of bias (median relative error) and
overall error (median absolute relative error).
    The test scenarios confirmed that any increase in bias was due to the quantity and quality of
the length data. Error decreased with more years of length data, particularly for the longer-lived
life history types or estimating the overfishing limit (OFL). The number of years of length data
did not affect accuracy with high recruitment variability, but results were biased with a single
year of length data for the low recruitment variability scenario. Low sample size of lengths did
not affect accuracy or total error with longer time series of length data, but did result in greater
error with two or fewer years of length data. Performance was similar or better than that with
constant 50 samples annually over 20 years when sample size declined from 200 to 50 samples
over time. Higher recruitment variability resulted in greater error. Results were insensitive to an
alternate fishing mortality scenario where the fraction of unfished biomass in the last year of data
was 60%, as opposed to 40% for the scenarios described above.

1.3.1 Panel discussion
The high level of similarity between the OM and the EM and clarifying question regarding
model structure.
The Panel noted that the EMs have little mis-specification and some OMs have no observation
error, resulting in a high level of similarity between the OMs and EMs. Specifically, the
estimation models were provided with the true values for steepness and natural mortality (M),
σ R , the correct shape of the selectivity curve (logistic), and the length-composition sample sizes
and error distribution (multinomial) assumed in the EM matched those used to generate the data
in the OM. Simulations were simplified to include only one fleet and thus did not require tuning
of length-composition sample sizes. The time period for which length-composition data were
available compared to the level of fishing mortality during this time were discussed. The
proponents clarified that the lengths available are always for the most recent years or were
focused on years where lengths were generally available in previous stock assessments. The
Panel discussed the need for future simulations in which the true selectivity and estimated
selectivity were dome-shaped, given that if simulations suggest that models perform poorly with
dome-shaped selectivity the PFMC should be cautious about implementing length-based
methods when dome-shaped selectivity is plausible
     The Panel also noted that length data generated from a multinomial distribution are generally
more informative than actual data so the scenarios explored in these simulations are ‘best case’
scenarios.

Why is the ‘perfect’ simulation scenario biased, given that there is little model mis-specification
and data are generated without observation error?
The Panel discussed the bias in results from the ‘perfect’ simulation, noting that this scenario
does have recruitment variability, and that more than 100 replicates may be needed to generate
unbiased results. Several Panel requests focused on the unexpected bias in the ‘perfect’
simulations.

How well do the generated length frequency distributions capture the distributions of the real
data?

                                                 4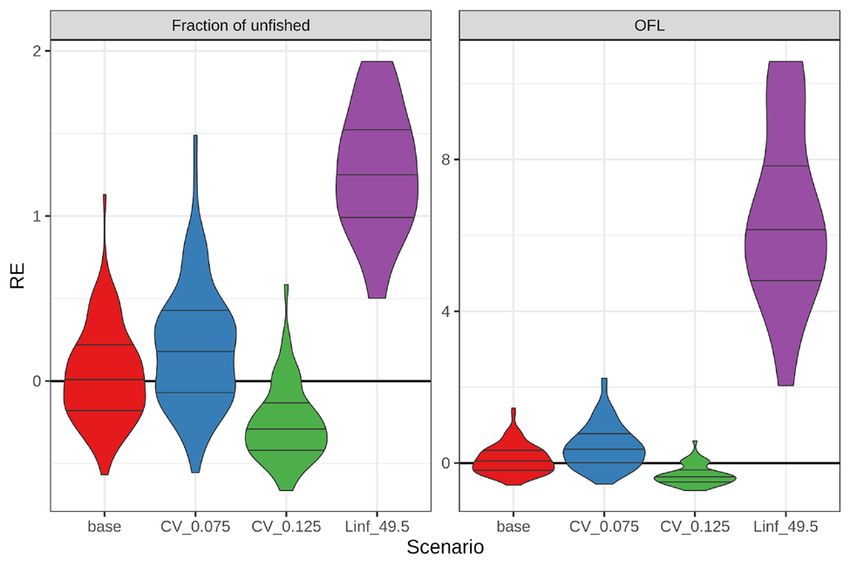
The Panel discussed the observation that length data generated using the multinomial distribution
are often more informative than actual data with similar sample sizes, and that both the OM and
the EM assume multinomial distributions. Thus, because the estimation models are getting better
data than is typically available for stock assessments, the simulations presented reflect a scenario
with results that are likely optimistic. The Panel also discussed the use of multinomial sampling
in the OM, suggesting that it would better to generate data using a Dirichlet distribution (which
will usually lead to less unrealistic generated length-compositions than the multinomial for
smaller sample sizes), and then use the multinomial distribution in the estimation models.

Concerning or counter-intuitive outcomes.
The Panel noted that some simulation results were counter-intuitive given expected patterns in
results for the ‘slower to Linf fish’ scenarios compared to the ‘faster to Linf fish’ scenarios.
Specifically, the Panel expected that the ‘slower to Linf fish’ scenarios would be less biased,
because the generated data should have more contrast in the length data. However, the ‘slower to
Linf fish’ scenarios performed more poorly than the ‘faster to Linf fish’ scenarios in many cases.
The reasons for this were not clear. Dr. Rudd noted that previous LIME scenarios also performed
more poorly for longer-lived species. The expectation that the ‘faster to Linf fish’ scenarios may
have more information about recruitment and has less overlap between distributions of ages and
lengths was discussed. The Panel was also concerned with the positive bias and long positive
tails of distributions in OFLs for longer-lived ‘slower to Linf fish’ when using length-only
methods.

Management implications of the simulation results
The Panel briefly discussed the management implications of adopting the SS-CL data moderate
stock assessment method using a category 2 stock assessment sigma. There was tentative
agreement that using category 2 assessment sigma is appropriate. It was noted that under a
revised TOR for 2021 data-moderate stock assessments, both acceptable data and methods
needed to be addressed, along with a review process that clearly differentiates from the update
and benchmark stock assessment processes.

1.3.2 Requests for additional information / analyses
Request 1: Provide selectivity and recruitment estimates from EMs for a range of OMs ranging
from perfect to data-poor cases.
Rationale: To understand why the perfect scenario is biased given that there is no model mis-
specification.
Response: The selectivity parameters were estimated accurately, with error increasing as fewer
years of length data were included. Equilibrium recruitment was generally estimated accurately,
although there was some bias under the “perfect” data scenario (perfectly known length data, no
index or ages). Under the perfect length data scenario, recruitment is estimated without bias
across the time series until approximately year 90, when the recruitment estimates begin to
diverge from the true values, particularly for the longer-lived life history types. Tested on a
single simulation replicate, the accuracy in the final years diverged from the true values, similar
to the pattern observed across the 100 simulation replicates (Figure 1). There was a similar
decline in accuracy estimating recruitment at the end of the time series with 200 samples of
lengths annually for 75 years. However, for any given simulation replicate sampling 200 lengths
per year, the estimated recruitment does not necessarily match the true recruitment as tightly as
with perfect data. Overall, however, Dr. Rudd was unable to determine why there is some bias in

                                                 5
the perfect scenario that is not as apparent when there is observation error, other than the general
increase in error associated with sampling scenarios.
Request 2: Rerun the simulation with N=200 and 75 years of length data to explore the impact
of fixing EM selectivity, and then fixing selectivity and R 0 in the EM (two runs). Analysts
should run at least one life history scenario of their choosing.
Rationale: The perfect scenario is biased. However, it is not clear why given that the EM is not
miss-specified. These runs will evaluate if performance is improved for a high information case.
Response: The simulation with perfect length data (without index and ages) and sampling N =
200 lengths over 75 years of length data were run with fixed selectivity and fixed R 0 and
selectivity. This did not help to understand the reasons for the biases. The reason for the
unexpected biases is likely related to the treatment of the recruitment deviations, but there was
insufficient time during the review to explore this. Future work should include simulations in
which the recruitment deviations are assumed known.
Request 3: Run a ‘perfect (with ages and indexes)’ simulation by providing the EM with the
correct selectivity parameters. Then run the ‘perfect’ and ‘perfect (with ages and indexes)’ when
L ∞ is wrong by 10%.
Rationale: The first run will evaluate if performance is improved when the EM is provided with
the correct selectivity parameters. The second set of runs will evaluate how bias changes when
L ∞ is miss-specified.
Response: Given the true L ∞ of 55 cm, Dr. Rudd mis-specified L ∞ as 10% less than the true L ∞
(49.5 cm) and 10% greater than the true L ∞ (60.5 cm). She expanded the maximum length bin
from 72 cm to 82 cm given the adjustments to L ∞ . Initial data-rich runs showed that selectivity
parameters were inaccurately estimated and that the peak selectivity parameter was often
estimated at the upper bound (e.g., last length bin). She ran these models after confirming this
allowed the data-rich scenario to estimate selectivity parameters away from the upper bound.
However, no simulation replicates converged for the “perfect” scenario (no index and ages) due
to peak selectivity parameters estimated at the bound.
The results for L ∞ = 49.5 cm were as expected, with positive bias in estimates of current
depletion and OFL. However, the data-rich assessment provided positively biased estimates of
current depletion for L ∞ = 60 cm, which was unexpected (Figure 2) and this warrants further
investigation.
The Panel concluded that the results of this request further highlighted the need to carefully
evaluate whether there are sufficient data to estimate key life history parameters.
Request 4: Explore the impact of mis-specification of L ∞ and growth CVs on EM performance.
Use at least one realistic simulation scenario.
Rationale: The simulations do not adequately capture the consequences of model mis-
specification.
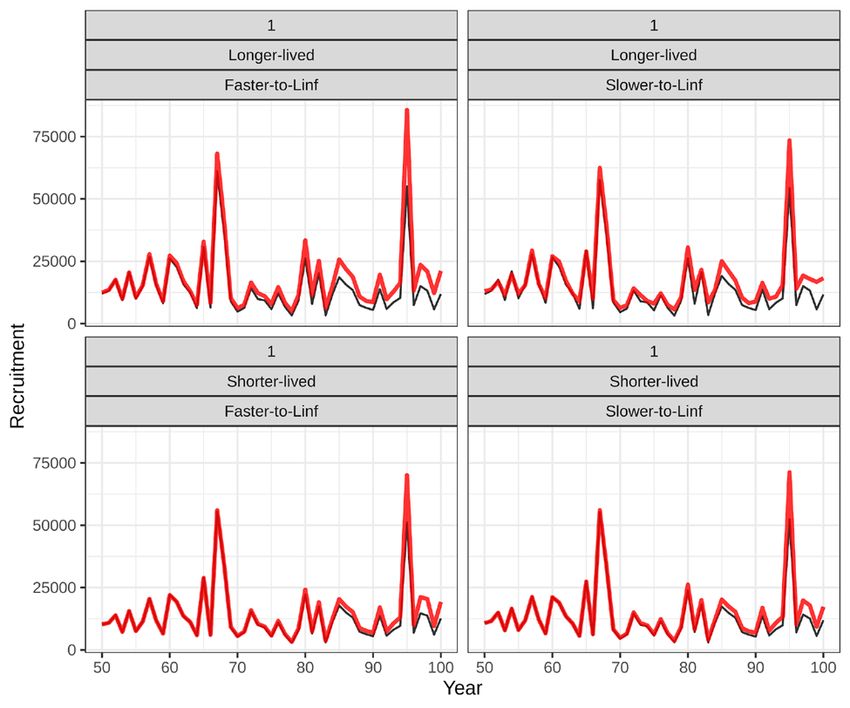
Response: A representative set of results is shown in Figure 3. The growth CVs were mis-
specified by +/- 25% and L ∞ mis-specified by -10% with 75 years of length data with 200
samples for the longer-lived, ‘faster-to-Linf’ life history type. Mis-specifying L ∞ by +10% led to
very long run-times and non-convergence issues, which could likely be improved by expanding
the upper length bins further than 82 cm. Mis-specifying CV by +/- 25% led to over-estimates of
fraction unfished biomass and OFL, with CV mis-specified by -25% and under-estimates of
those parameters of interest with CV mis-specified by +25%. Mis-specifying L ∞ by -10% led to
6over-estimates of the fraction unfished biomass and OFL. These patterns were driven by biases
in the estimates of ln(R 0 ) and the selectivity parameters. Mis-specifying L ∞ leads to convergence
issues for many simulation replicates due to estimating ln(R 0 ) at an unreasonably high value. No
simulation replicates converged for the sampling scenario with 200 samples and 20 years of
length data, similar to the issues that occurred with the “perfect” scenario in Request 3. While
selectivity parameters were estimated away from the bound, the equilibrium recruitment
parameter was estimated far above a reasonable value (e.g., log(R 0 ) = 19). Convergence was not
a problem with 200 length samples annually over 75 years.
Request 5: Plot the OM length compositions for both the multinomial and Dirichlet distributions
against a real data set.
Rationale: To investigate how realistic the generated length compositions are.
Response: The simulated length compositions for N=200 for the multinomial distribution looked
unrealistically informative. The simulated length compositions for the Dirichlet distribution with
N=50 looked more realistic compared to the actual length-composition data for China rockfish.
Request 6: Generate OM length data using the Dirichlet distribution for a subset of runs.
Rationale: Investigate if the results are robust to how the data are generated and because
Dirichlet-generated length data should look more realistic.
Response: Basing the simulations on data generated from a Dirichlet distribution led to
increased variation in relative errors, but no qualitative change in results.
Request 7: Plot OM length-composition data for the Low Linf and Fast Linf scenarios.
Rationale: Investigate why scenarios with ‘slower to Linf fish’ perform more poorly than those
with ‘faster to Linf’ fish.
Response: The length-compositions for the Low Linf and Fast Linf scenarios looked very
similar (Figure 4). However, the distributions of length-at-age appeared to show that there was
less separation of cohorts for the longer-lived ‘slower-to-Linf’ scenario for the longer-lived
‘longer-to-Linf’ scenario (Figure 5).
1.4 Comparison of SS-CL related to exiting benchmark assessments
Drs. Wetzel and Cope provided the results of SS-CL relative to the results of accepted
assessments of West Coast groundfish stocks (e.g., existing Best Scientific Information
Available), to understand the impact of data type and data time series length on estimates of
stock status. A subset of West Coast groundfish stock assessments were selected for data
explorations (stocks in blue in Figure 6) where data types were removed or greatly reduced. The
selected stocks encompass a range of life histories (e.g., flatfishes, roundfishes, elasmobranchs,
rockfishes), exploitation histories (e.g., recreational or commercial fisheries), and data
availability (e.g., CPUE, fishery-independent indices, and length and age compositions). Each
assessment also contains variable quality and quantity within each available data type.
Several modifications were made to the full assessment models for ease of comparisons
across data scenarios. These included fixing all biological parameters to their estimated values
from the benchmark assessment to limit the effects of aberrant parameter estimation and fixing
retention parameters at the benchmark assessment maximum likelihood estimates to avoid
variances in estimates of total mortality among runs. Next, each assessment was run with the full
Hessian matrix estimated, and subsequently reweighted. The reweighted model was termed the
“reference model” for that stock, and seven data scenarios were performed relative to this model.
7These included: 1) remove all indices of abundance or CPUE in the model (i.e., only length- and
age-composition data remain); 2) remove all length data in the model (i.e., only indices and age-
composition data remain); 3) remove all age data in the model (i.e.., only indices and length-
composition data remain); 4) only retain length data in the model (i.e., indices and age data
removed); 5) twenty years of length data at the end of the modelled period; 6) ten years of length
data at the end of the modelled period; and 7) a single-year of length data at the end of the
modelled period. When time series of length data were removed it was always the most recent
year(s) of length data that remained to inform the model. The estimates of unfished spawning
biomass, final year spawning biomass, final year fraction of unfished, recruitment deviations,
and the OFL estimate from each data scenario was compared relative to the reference model.
1.4.1 Panel Discussion
Results were generally consistent with those for the reference model when running models with
length-composition data only and there were at least 20 years of data. Both the Panel and the
analysts acknowledged that the reference (base) models in the evaluation should not be
considered “true,” and the analysts noted that the evaluation was essentially an unstandardized
experiment, and every assessment they evaluated had unique characteristics and shortcomings.
The analysts also noted that the general direction of bias (7 of 10 models) was to be more
conservative (pessimistic) than the base models, particularly with respect to the most recent stock
status (estimated depletion).
The Panel noted that the selection of stocks generally had limited or uninformative age and
index data, and were thus largely informed by length-composition data, which tended to have
larger sample size and thus greater contribution to the overall likelihood. Thus, the general result
(that length-based models were consistent with the “full” data models) was not surprising, and
was noted in the written report provided by the analysts. A more robust evaluation may have
included more assessments with informative age data (such as petrale sole and chilipepper
rockfish). The analysts stated that they attempted to focus on nearshore stocks (or stocks that
shared data and index quality limitations with nearshore stocks), given that those would be likely
targets of future applications of SS-CL. Moreover, the analysts noted that many stock
assessments already rely heavily on length data so their approach does not widely diverge from
current practices or levels of data availability. The analysts also noted that some of their results
did include more “complicated” models, such as black rockfish, the assessment of which
includes composition and index data that are both influential and the index data are inconsistent
with the length and age data. Future work could potentially include a broader set of evaluations,
such as including more assessments with informative age composition and/or index data.
The Panel noted that the practice of fixing life history parameters at the values estimated in
the base models would not be replicable in most actual applications of the SS-CL approach, and
that a better comparison would be to use the point estimates of priors from external (growth) or
meta-analyses (e.g., natural mortality, steepness) that would presumably inform actual
applications. For this reason, the performance of SS-CL relative to the reference models in this
evaluation is likely overstated. The Panel and analysts discussed the nominal efficiencies likely
to be gained by adopting SS-CL, and the analysts indicated that while a large fraction of the
work associated with a “benchmark” assessment would remain, there would likely be some room
for increased efficiency and throughput.
The performance of length-based methods may deteriorate given dome-shaped selectivity if
not recognized, as is true for more complicated stock assessments. It is necessary to describe
expected selectivity patterns for co-occurring species and document the depth distribution of the
8species along with the depth distribution of the catch, especially if there is evidence for different
length distributions spatially. Similarly, a changing spatial distribution of fishing could induce
hyperstability of length-composition, which would lead to biased results.
1.4.2 Requests for additional information / analyses
Request 1: Provide more detail on the process for developing new length-based models,
preferably in the form of a flow chart.
Rationale: Having a better understanding of the process and sequence by which these models
would be developed would be very helpful, particularly with respect to considerations of gains in
efficiencies with this approach relative to full benchmark assessments.
Response: The analysts provided a sequential outline of protocols to follow in developing a SS-
CL model (Appendix 4). They noted that there had been some discussion about adding survey
indices to a SS-CL model, and asked whether in such scenarios a model might also include the
length-composition data for the survey index. There was agreement that a version of these
protocols would be helpful to include as an appendix in the stock assessment TOR document.
The Panel noted that there were several points in the flow chart at which some careful
consideration of a pathway forward may be necessary, such as when there is sexually dimorphic
growth and most length data are not sex-specific, and if all selectivities were estimated as dome-
shaped.
Request 2: Develop examples of the application of this method in which the flow chart process
is followed, particularly with respect to life history parameters (natural mortality, steepness). Use
a representative set of stocks, based on the life history profile (three stocks across that range
[Figure 6] should suffice, though note request 4).
Rationale: The current comparisons use the base model life history parameter assumptions,
rather than the assumptions that would presumably be made in the absence of a base model.
Response: Dr. Wetzel provided the darkblotched rockfish (low M/K) example (developed in
response to request 4) and Dr. Cope provided gopher rockfish (intermediate M/K) and cabezon
(high M/K) examples. Dr. Cope reported that his attempt to fill the original request was not
feasible for lingcod, given extremely long runs for lingcod profiles.
The analysts focused on the development of the life history (growth, natural mortality) values
to implement this approach, which included obtaining point estimates from prior distributions or
other analyses, and including those in SS-CL as fixed values. The analysts found that the models
appeared to have information for these values, when starting from externally derived values, and
added additional results to better inform this observation. The analysts kept steepness and
maturity at previously fixed values (steepness fixed at the prior mean used in the assessment
except for darkblotched rockfish where the steepness prior was updated from 0.77 to 0.72). The
authors then ran six scenarios, including two versions of the original reference model (with the
original estimated life history parameters as well as the external life history parameters), a SS-
CL model in which the reference model growth parameters were used, another in which external
point estimates were used as point estimates (essentially, this was the request), and two in which
the external estimates were used as starting values, and then the analysts turned on estimation for
M and L ∞ (or for all growth parameters) (see Figure 7 for an example for cabezon). Note that the
scenarios in which the life history parameters were estimated were not requested by the panel.
For cabezon, results indicated some fairly substantial differences across this range of model
structures. Results were particularly divergent from reference models (i.e., with all data or just
with lengths) when external estimates were used as fixed values, even for the reference model
9when the new fixed biology values were applied. Most of the estimates of spawning biomass
were outside the confidence limits of the base model, often well outside, while the estimates of
depletion were more similar (Figure 7). These results could lead to some concerns if only
literature values of growth were available for the stocks. Estimating the life history parameters
using the new priors produced better performing models.
There was less variability in results overall for gopher rockfish among the six scenarios
(Figure 8), with results generally more pessimistic as more of the life history parameters were
estimated. Most of the scenarios were within the uncertainty envelopes for the base model.
For darkblotched rockfish, both steepness and natural mortality (for males and females) were
fixed at externally estimated or prior values, but some judgement-based decisions were necessary
to derive the “external” growth estimates from the benchmark assessment. This speaks to the
need to carefully consider how these point estimates were derived in actual model development
and review, given the range of options that exist for how such values can be derived. Results are
considerably more pessimistic than from the benchmark assessment, in fact outside of the
uncertainty bounds, when both the assessment estimates and the external estimates are used in
SS-CL (Figure 9). Results were still more pessimistic when the life history parameters were
estimated, but more consistent with the base model. The difference observed between reference
model and SS-CL results could be due to the lack of age data. Age data have been observed to be
highly influential in other long-lived rockfish assessments (e.g. Pacific ocean perch) and often
inconsistent with the length data. An attempt was made to estimate natural mortality but resulted
in very low values (e.g., ~0.025yr-1) for darkblotched rockfish, the poor estimates (relative to the
external priors) may be due to all selectivity patterns in the benchmark assessment were dome-
shaped.
Request 3: Develop likelihood profiles for key life history parameters (natural mortality, L 2 /L ∞ ,
CV of L ∞ , steepness) for the three models developed in the previous request and compare the
likelihoods, current biomass, current depletion and OFL to those from the reference model.
Rationale: Assumptions related to life history parameters would be expected to be critical in
terms of model outputs, but the ability to estimate them may be limited.
Response: The profiles for cabezon indicated some information content in the data with respect
to growth in the length-based model. However, the “data-poor” model infers higher confidence
regarding the true value of natural mortality than the benchmark assessment (very large
likelihood differences among M values for SS-CL), likely as a result of less tension in the data
with conflicting data excluded. There is a need to further examine the steepness profile as a small
number of the runs appeared to have failed to have converged.
Results for gopher/black and yellow rockfish, indicated a similar information pattern across
models with respect to natural mortality (somewhat informed) and steepness (very little
information), and indicated that there was some information in the length data to inform L ∞ and
the CV at L ∞.
The length data for darkblotched rockfish indicated a natural mortality rate similar to that of
the benchmark model. Steepness runs had convergence issues, but generally had the consistent
result of little information content in data. There was some fairly robust information on L ∞ , with
the model outputs quite sensitive to the values assumed for L ∞ .
It appears that for some of these examples, some parameters can be estimated. However, the
Panel expressed concern with the observation that at times the model suggests that you know
more about some parameters when there is less data are included in the model likelihood. This is
particularly true for growth, in which it is somewhat worrisome to think that we know more
10about the growth rate and intercept parameters of the growth curve when we ignore age data.
Regardless, the likelihood profile plots are very helpful and should be included in any
assessment. They do not appear, as of yet, to provide a way to definitively decide whether these
parameters should be fixed or estimated, but should be examined routinely during assessments
based on SS-CL. However, one option might be that the flowchart developed in request one
could be revised to add a step in which profiles were developed from fixed life history values,
and if they indicated information in the data, the analysts could consider possibility of
estimation. Additional simulation testing of taking these steps in the context of “known” growth
and assessment models would be helpful. Both analysts and the Panel agreed that the depth of
potential reviews should increase with the estimation of more parameters.
Request 4: Develop an example comparable to those in the provided analysis using darkblotched
rockfish. If a darkblotched rockfish example can be developed, use this as one of the three
examples used in requests 2 and 3.
Rationale: To expand the range of life history scenarios bracketed by the case studies to be more
inclusive of a stock with a very low M/K ratio.
Response: Dr. Wetzel developed a darkblotched rockfish example, and provided an overview of
the results (Figure 9). In general, removing age and index data both led to a more pessimistic
perception of stock status. This was similar to what was observed in the model for Pacific ocean
perch, and may merit a closer investigation (characterized by rapid early growth, and greater
longevity without significant growth upon reaching asymptotic length). The results of this
request and analyses were used in the response to requests 2 and 3.
Request 5: Repeat request 2, but with a shorter time series of length-composition data. Perhaps
just 20, 10, and 5 years (no need to do the one-year scenario).
Rationale: It would be beneficial to expand the analysis to consider what happens when the data
are truncated to both 20 and 10 years, as might be the case for more data-poor stocks.
Response: The analysts provide runs for the reference model, for the SS-CL model and for a
variant of the SS-CL model in which life history parameters were estimated. These plots were
produced although some of the runs may have failed to converge, which may explain some of the
greater than anticipated variability in results among model runs (particularly for cabezon and
gopher/black and yellow rockfish). Most of the model runs diverged from the base run to some
modest to significant extent, and many were outside of the confidence intervals from the base
model. There was not a clear indication of consistent improvement in performance (relative to
the base model) when natural mortality and/or growth was estimated (noting that natural
mortality could not be estimated for the darkblotched model). Basing the results on the last five
years of length-composition data generally differed the most from the SS-CL model that used all
of the data, although results varied considerably among scenarios. While the results did not
provide a clear sense of a minimum number of years of data necessary to achieve a consistent
result, in general the analysts and Panel agreed that 10 to 20 years of data was likely the range at
which reasonable results could be achieved.
Request 6: If time allows, consider repeating request 5, but excluding the most recent length
data, rather than the earliest. It was noted that this may not be possible as it may require adjusting
time-blocks for selectivity.
Rationale: It was noted that length-composition data are more robust early in the time series for
some California stocks.
11Response: The analysts provided runs where the most recent 10 years of length data were
removed from both the reference and the SS-CL models. There are some indications that the
nature of the shift in results changes when more recent data are dropped from the model relative
to the earliest data, even for the reference model (i.e., darkblotched rockfish). However, it was
noted that due to a misunderstanding in how the request was phrased, the number of years in
these scenarios was not always comparable to those in Request 5.
1.5 Conclusions and caveats
1.5.1 SS-CL
1. The Panel agreed that SS-CL should be adopted by the SSC/PFMC for use as a data-
moderate (category 2) stock assessment. While there are concerns with the results of the
simulation study (see section 1.3) and there is a need for additional comparisons of
benchmark and SS-CL assessment, as well as closed-loop performance evaluation
(MSE), the Panel agreed that the analyses conducted to date are sufficient to warrant
adoption of SS-CL. The availability of a method that informs depletion for stocks based
solely on length-composition data is a major step forward in providing stock assessments
for West Coast groundfish.
2. SS-CL can exhibit convergence problems and analysts should pay particular attention to
ensuring that the best fits are obtained.
3. The SSC is unlikely to approve SS-CL assessments in which all fleets are allowed to
have dome-shaped selectivity patterns, especially if the life history parameters are
estimated, in particular because the simulation study did not address the issue of all fleets
having dome-shaped selectivity.
4. While most of the simulations led to results that matched the expectations of the Panel,
this was not always the case. Short-term research to understand why the simulations for
the ‘perfect’ / data-rich cases were biased, why the results for the over-estimated L ∞ were
not as expected, as well as additional comparisons of benchmark and SS-CL assessments
needs to be undertaken before final adoption of SS-CL, including for species with
uninformative length-composition data. The Panel expressed its willingness to continue
to work with the analysts to ensure that the analyses conducted match what is needed to
address these considerations.
5. The Panel emphasizes the importance of following the flow chart in Appendix 4,
particularly full exploration of uncertainty.
6. Data-moderate assessments based on SS-CL need to provide decision tables, and use of
life history parameters (e.g., steepness, M, and L ∞ ) as axes of uncertainty may be
warranted.
7. The first applications of SS-CL should be to 3-4 species, with a range of characteristics,
including some with low attainment and others that are nearshore data-limited species
with no relative CPUE index information (see Section 4 below). The Panel recognizes
that as with more data rich models, SS-CL models with greater complexity (greater
number of fleets, models that attempt to estimate growth and/or natural mortality) will
require a larger amount of time and resources to both develop and to review.
8. The Panel proposes that the first review of assessments based on SS-CL (and SS-
CL+Index) should be conducted by the SSC groundfish sub-committee, as the sub-
committee is more aware of the issues with the methods and the species to which they
should be applied. The review could involve an initial desktop review followed by in-
person/webinar meetings. There may be benefit from the involvement of one CIE
12reviewer in the first review. There may also be value in a CIE review once the
methodology is stable for “deeper evaluation” and refinement.
9. An MSE should be conducted to evaluate the ideal frequency of assessments based on
SS-CL, as well as performance under model mis-specification (i.e., life-history
parameters and/or selectivity assumptions).
1.5.2. SS-CL+Index
1. SS-CL+Index is the combination of the current “XSSS” data-moderate assessment
methods (applied to well-designed surveys) and SS-CL (which should be an adopted
method if the further analyses outlined above are completed). As such, its performance
should be expected to be closer to that of a data-rich assessment. The SSC should have
the option to designate stocks assessed using SS-CL+Index as category 1 stocks for cases
in which recruitment deviations are estimated.
2. The Panel noted that SS-CL+Index has not been simulation tested nor extensively
compared to benchmark assessments. However, previous testing and the testing of SS-CL
provided confidence that SS-CL+Index should perform at least as well as SS-CL.
3. The additional index data may lead to longer review times, given the possibility of data
conflicts. There should be careful consideration of the trade-offs associated with complex
SS-CL+Index models that exclude age data if age data are available, relative to full
benchmark assessments.
1.5.3 Estimating rather than pre-specifying life history parameters.
1. The results from SS-CL are sensitive to errors in the life history parameters and the
methods presented in the flow chart of the SS-CL method in Appendix 4 allows for the
possibility of estimating these parameters.
2. Only natural mortality (M) and the growth parameters (those defining mean length-at-age
and the CVs of length-at-age) should be considered as possibly estimable. Steepness (h),
the parameters of the length-weight relationships, and maturity-at-age/-length should
always be pre-specified. The latter two types of parameters are always pre-specified in SS
assessments.
3. A decision to estimate M and the growth parameters should be taken with caution.
Factors to consider include:
• How different are the pre-specified and estimated parameter values (note that the
internally estimated values for the growth parameters may differ from external
estimates even for a benchmark assessment)?
• Can much confidence be placed on the externally estimated parameters (e.g., if
the sample size for the length-at-age data is limited)?
• The results of analyses showing the sensitivity of the results (e.g., estimates of
spawning output, relative stock status, OFL, estimated selectivity curves) to M
and the growth parameters.
• If priors are used, how do the priors impact the final estimates?
• The information content of the data as inferred from likelihood profiles. Results
shown during the review indicated that the estimate of the natural mortality rate
was better informed with less data, which is not an intuitive result and is
concerning regarding whether SS-CL can reliably estimate life history parameters.
The reasons for this type of behaviour is likely related to fewer data conflicts
and/or how the length-composition data are weighted in the likelihood, but should
be better understood through additional analyses
13• Ideally, an MSE should be used to evaluate the trade-off between reduced bias
due to estimating life history parameters and the increased variance, as well as the
reliability of likelihood profiles for life history parameters based on SS-CL.
• Simulation results reporting how well growth parameters and M can be estimated
would strengthen the likelihood of supporting estimation.
1.5.4 When can SS-CL or SS-CL+Index be applied?
1. There is no definitive way to decide when there are sufficient data or not, but the Panel
agreed that the simulations and comparisons between benchmark and SS-CL assessments
supported that generally 10 years of length-composition data (with reasonable sample
sizes) would generally be a minimum.
2. Additional research is needed to determine if the performance of SS-CL will be similar
for species having significantly different life histories from those evaluated during this
review.
3. There may be value in using a SS-CL assessment based on fewer than 10 years of data as
a category 3 stock assessment. The advantage of this is that depletion would be based on
some data. However, there may be situations in which a prior for depletion based on
expert judgement or meta-analysis could be superior to application of SS-CL with limited
or unrepresentative data. Simulation testing might provide a better way to understand the
trade-off between SSS/DB-SRA and SS-CL with limited length-composition data.
2. The Length-based Integrated Mixed Effects (LIME) method
Dr. Rudd described the structure and testing of the LIME model. The LIME model accounts for
recruitment variability when considering length data alone, while other length-based methods
assume equilibrium conditions. LIME is based on an age-structured model, requires natural
mortality, length-at-age, weight-at-age, maturity-at-length, and at least one year of length data,
and can fit to catch and an abundance index if available. LIME estimates annual fishing mortality
rates, the lengths at 50%- and 95%-selectivity, the standard deviation of the recruitment
deviations, and the Dirichlet-multinomial parameter as fixed effects and recruitment deviates as
random effects. When total catches are not available, LIME includes a penalty on the fishing
mortality rate to prevent it from changing too rapidly between years based on information from
the length data. LIME derives stock status in terms of the spawning potential ratio and relative
spawning biomass, standard population processes typically output from an age-structured model,
and uncertainty in terms of standard error for key population parameters. LIME is different from
Stock Synthesis in that it is written in Template Model Builder, treats recruitment deviations as a
random effect, estimates annual fishing mortality rates as fixed effects, and does not have as
many features such as multiple fleets, sex-specific considerations, and automatically-generated
figures (Table 2).
There was initial interest in applying LIME to West Coast groundfish stocks because the data
requirements match the catch and length data often available for West Coast stocks and the
consideration of recruitment deviations sets LIME apart from other data-limited methods. Initial
model runs compared LIME and Stock Synthesis using catch and length data, and LIME
performed adequately as long as the penalty on fishing mortality was turned off. However, Drs.
Rudd, Cope, and Wetzel encountered difficulties testing LIME and ultimately decided to focus
their efforts on the SS-CL framework. Specifically, they found that 1) LIME required additional
configuration to report OFL estimates, 2) run times were excessive when estimating annual
fishing mortalities as fixed effects for long time series, and 3) selectivity and sex options were
14limited in LIME, making comparisons to SS-CL difficult. Dr. Rudd and the review Panel agreed
that these issues could be remedied without much difficulty and the Panel encouraged further
research (additional details below).
3. Terms of Reference for length-based data-moderate stock assessments
The Panel identified considerations for the SSC when updating sections of the Stock Assessment
TOR to include the SS-CL and SS-CL+Index assessment methods. There was agreement that the
language in the TOR should provide guidance that is not overly restrictive, to allow for
exceptions, since this is still an evolving methodology, and latitude should be provided in its
application to make it adaptable. The flow chart (Appendix 4) and categorization (Table 3) of
these methods define the process for implementation and the scope of each method. The flow
chart includes how to prepare catch estimates, length data, parameter estimation, model
weighting, model convergence and characterizing uncertainty. The SS-CL+Index assessment
method includes fishery-independent indices of abundance for which index development
methods are well established. Development and review of indices can highlight tensions in the
model and fits can be problematic, especially for a streamlined process of review. Defining and
distinguishing that the specific methods implemented with the provided specifications will allow
for standardization and facilitate a more streamlined review by the SSC Groundfish
Subcommittee rather than a Stock Assessment Review (STAR) panel. Otherwise, intermediate
models may be best reviewed in a full assessment review (see Table 3 for a possible
categorization of assessment types). If a fishery-independent survey is included in an SS-
CL+Index assessment, the length-composition from that survey should also be included, as well
as length-composition from other fishery independent or dependent data sources.
The limited scope of the assessment methods for these SS-CL and SS-CL+Index data-
moderate methods also should allow for more limited documentation requirements relative to full
stock assessments, leading to additional efficiencies. Reporting requirements should also be
developed for more complex intermediate models to cover the range of possible applications.
Given the reduced reporting requirements and the freedom from the ageing timelines, review of
methods meeting the strict definitions and protocols in Appendix 4 should be more
straightforward. Assessments using these conforming methods could be reviewed by the
Groundfish Subcommittee of the SSC along with Update Assessments in May of odd years. The
reviews are expected to take between a half day and two days depending on the number, type and
novelty of the assessments. It may be beneficial to hold a half day preliminary review during a
virtual meeting prior the Groundfish Subcommittee at which the final review will be conducted.
The number of SS-CL or SS-CL+Index assessments that can be conducted at a given STAR
panel or the Groundfish Subcommittee of the SSC in combination with update assessments,
depends on the complexity of the models, spatial areas and novelty of the methods. Between two
and four may be reasonable, and flexibility should be provided to the SSC in determining how
many and in what process. The intermediate methods with fishery-dependent indices or with
historical age and index data may be difficult to review outside of a STAR panel.
A continuum of models should be accommodated in the section of the TOR regarding data-
moderate stock assessments to allow combinations of catch, lengths, ages and indices to be
applied to both new assessments and length-based extensions of existing benchmark
assessments, though review processes may differ. The SSC should be given latitude to determine
whether the review should take place through the STAR panel process or by the Groundfish
Subcommittee of the SSC depending on the complexity and novelty of the assessment. These
methods can be applied to stocks that were formerly assessed with a full benchmark assessment,
15but for which attainment has been low or conducting a full or update assessment is not a priority
despite the assessment becoming dated.
The SS-CL and SS-CL+Index methods should be considered separately from past full stock
assessments that exclude new age and/or index, but maintain index or age data included in the
previous assessment while adding length and catch data. Addition of new age data to either type
of length-based Stock Synthesis assessment is discouraged to avoid confounding the nature of
the assessment, reducing model tension arising from potential conflicts in age and length data,
and increasing clarity in the related review process. Due to the complexities and potential data
conflicts that can occur from fitting to age data in combination with indices and lengths,
assessments that include current age data should be considered full benchmark assessments and
assigned to STAR panels.
The Terms of Reference should specify critical modeling steps included in the SS-CL flow
chart (Appendix 4). Jittering and alternative phasing should be used given the difficulties
encountered by the analysts during this review finding the global minimum of the objective
function. If there is dimorphic growth, then sex-specific information should be included. Fleet
consolidation is recommended if selectivity is similar among sectors or surveys to reduce model
conflict and confounding affects. That said, further investigation into the application of dome-
shaped selectivity and the increased model reliability when at least one of the fleets is
asymptotic, which is the default assumption at present. Simplifying model structure and spatial
areas will reduce complexity in the assessments and workload in both the analysis and review.
The TOR for SS-CL and SS-CL+Index, can be developed as a supplemental document for
the June 2020 Briefing Book and reviewed before the September 2020 Council meeting. This
will provide the time necessary for development of language to address review of the
intermediate models.
3.1 Areas of future research to inform guidance in the TOR
The following areas of research would provide additional guidance in the TOR.
• The time lag between reproduction and recruitment of fish to the survey or fishery from
which lengths are obtained may affect the ability to resolve recent recruitment and the
potential for bias or increased uncertainty. Additional research would help inform which data
sources might be most amenable to analysis.
• A formalized ensemble process is needed to integrate results from multiple model runs, and,
once developed, the process should be included in the TOR.
• Length-based selectivity curves are constrained to being asymptotic despite a lack of
evidence from the data, and evaluation of dome-shaped curves for one or more of fleets
should be the subject of future research that provides guidance on modeling selectivity.
• Considerations around modeling of discards should be identified. The question remains
whether discards should be added to catches, as well as whether to add discarded lengths to
retained compositions and adjust selectivity.
4. Candidate species for assessment using length-based data-moderate methods
The Panel considered criteria for the applicability of SS-CL and prioritization of stocks to which
it could be applied. Dr. Budrick provided a presentation and discussion of these issues, while Dr.
Hastie provided information from the stock assessment prioritization workbook on several
candidate species. Criteria and types of species that would be appropriate for application of SS-
CL were discussed. The latter include:
16You can also read