Assessment of Solar PV Potential and Performance of a Household System in Durban North, Durban, South Africa
←
→
Page content transcription
If your browser does not render page correctly, please read the page content below
Assessment of Solar PV Potential and Performance of a Household System in Durban North, Durban, South Africa Williams S. Ebhota ( ebhotawilliams1@gmail.com ) Durban University of Technology https://orcid.org/0000-0003-3099-3704 Pavel Y. Tabakov Durban University of Technology Research Article Keywords: Renewable energy, Solar photovoltaic (PV), PV performance parameters, meteorological parameters, PV design and simulation applications, PV*SOL and Solargis Posted Date: July 1st, 2021 DOI: https://doi.org/10.21203/rs.3.rs-644597/v1 License: This work is licensed under a Creative Commons Attribution 4.0 International License. Read Full License

Assessment of Solar PV Potential and Performance of a Household System in Durban
                            North, Durban, South Africa

                                    Williams S. Ebhota1* and Pavel Y. Tabakov2
   1,2
         Department of Mechanical Engineering, Institute for Systems Science, Durban University of
                                  Technology, Durban, South Africa.
                            *Correspondence email: ebhotawilliams1@gmail.com

Abstract                                                       environmental degradation (Almasoud & Gandayh,
                                                               2015). Energy conservation is receiving urgent attention
A rooftop solar photovoltaic (PV) system is an alternative
                                                               due to the depletion of fossil fuels and the unabated price
electricity source that is increasingly being used for
                                                               fluctuations. The use of fossil fuel contributes the highest
households. The potential of solar PV is location
                                                               share to CO2; a by-product of fossil fuel combustion,
dependent that needs to be assessed before installation.
                                                               emitted into the atmosphere (Nachmany et al., 2014). The
This study focuses on the assessment of a solar PV
                                                               sacrificing of the environment and human health for the
potential of a site on coordinates -29.853762°,
                                                               energy required for socio-economic activities is presently
031.00634°, at Glenmore Crescent, Durban North, South
                                                               attracting criticisms. However, this compromise has not
Africa. In addition, it evaluates the performance of a 6
                                                               bridged the gap of energy insufficiency in many
kW installed capacity grid-connected rooftop solar PV
                                                               developing countries. About 50% of the population in 41
system to supply electricity to a household. The results,
                                                               countries in sub-Saharan Africa (SSA) have no adequate
obtained from PV design and simulation tools –
                                                               access to energy; 650 million people are expected not to
PV*SOL, Solargis prospect and pvPlanner, were used to
                                                               have access to power by 2030 (IEA, 2017).
analyse and establish the site and PV system technical
viability. The system’s configuration is as follows: load      The present large economies are products of fossil fuels,
profile - a 2-Person household with 2-children, energy         such as natural gas, coal, and oil. These are unarguably
consumption - 3500 kWh, system size - 6 kWp,                   effective economic boosters, but they leave behind
installation type - roof mount, PV module type - c-Si -        negative environmental impacts and health consequences
monocrystalline silicon, efficiency - 18.9%, orientation       (Williams Saturday Ebhota, 2019; Williams S Ebhota &
of PV modules -Azimuth 0° and Tilt 30°, inverter 95.9%         Tien-Chien Jen, 2018; Williams S. Ebhota & Tien-Chien
(Euro efficiency), and no transformer. The results show:         Jen, 2018; W. S. Ebhota & Tabakov, 2018; Williams S.
meteorological parameters - global horizontal irradiation      Ebhota & Tabakov, 2019). The consequential effects of
(GHI) 1659.3 kWh/m2, direct normal irradiation (DNI)           the continuous use of these fuels to the biosphere
1610.6 kWh/m2, air temperature 20.6 °C; performance            (Aljazeera, 2019; FloodList, 2019a, 2019b) are evidenced
parameters - annual PV energy 8639 kWh, Specific               in the increasing climate change triggered events. Some
annual yield 1403 kWh/kWp, performance ratio (PR)              of these events are the unceasing rise in temperatures,
74.9%, avoided CO₂ emissions 5662 kg/year, and solar           droughts, flood, cyclone, storms and ice melts, and
fraction 42.5 %. The analysis and benchmarking of the          migration. Several efforts to check the aforementioned
results show that the proposed solar PV system under the       energy issues have been advanced, and these include
current conditions is technically viable for household         measures to reduce energy consumption, maximization of
electrification in Durban North, South Africa.                 the use of renewable energy (RE), use of hybrid
                                                               renewable      energy    system      (HRES)     (Rinaldi,
Keywords: Renewable energy; Solar photovoltaic (PV);
                                                               Moghaddampoor,        Najafi, & Marchesi,         2021),
PV performance parameters; meteorological parameters;
                                                               digitalization and decentralization of energy system
PV design and simulation applications; PV*SOL and
                                                               (DCES), and the smart grid.
Solargis
                                                               1.1. The need for alternative energy
1. Introduction                                                The decision by the United Nations (UN) to cut down the
The deployment of solar photovoltaic (PV) systems is           global consumption of fossil fuel, to reduce the effect of
increasing due to the rising and uncontrollable fossil fuels   CO2 emissions was well-received globally (UN, 2015).
prices, its environmental menace, and the continuous           However, there is a need to develop alternative energy
decline of solar PV components prices. In addition, it         sources to replace fossil fuel; since energy is what powers
mitigates climate change consequences, promotes a              socio-economic growth. These alternatives are expected
decentralisation system, reduces dependence on energy          to be clean, reliable, adequate, and affordable energy.
imports, and extensive grid infrastructure. The continuous     Sustainable energy transition will simply be fiction or a
extensive use of fossil fuels is increasingly adding to the    mirage without alternative energy to replace fossil fuel
concentration of CO2 in the atmosphere, which                  (W. S. Ebhota, Eloka-Eboka, & Inambao, 2014; Williams
contributes to the global temperatures rise and                S. Ebhota & Inambao, 2015; Williams S Ebhota &
                                                               Inambao, 2017). Subsequently, the contemporary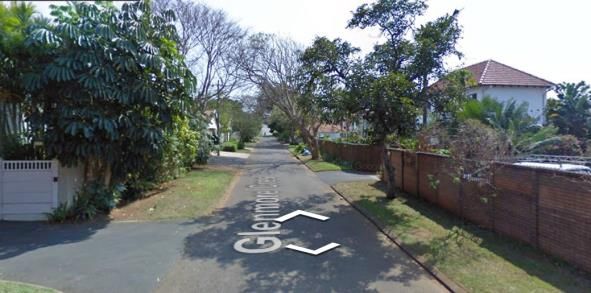
questions surrounding energy are centred on how to             and analysis of site-specific meteorological factors, and
harness RE resources; raise the efficiency of supply and       PV performance parameters; comparison of the annual
end-use; reduce CO2 emissions originating from energy          energy yield and prediction of the performance of 6 kWp
generation and consumption; and provide clean energy           grid-connected rooftop solar power plant.
for all. This implies that much advancement has to be
made to improve and facilitate RE deployment.                  2. Background of study
Renewable energy technologies such as solar, biofuels,
hydro, geothermal, tidal, and wind are currently receiving     2.1. Solar resource      basics and modelling solar
massive interest in terms of deployment, investment, and            radiation
research and development. In addition, nuclear energy          Solar radiation is used to assess the potential power levels
has also been described as reliable, safe, clean, compact,     that can be generated from photovoltaic cells, and
competitive, and practically inexhaustible (Eiden, 2014 ).
                                                               necessary for determining cooling loads for buildings.
However, because of the perceived side effects, many
                                                               Hence, accurate quantification of solar radiation is
countries are sceptical about the use of energy although
                                                               required for various PV system applications, such as
nuclear has enormous energy required for electricity. The
                                                               agricultural and water resource planning, management,
study aims to facilitate the generation of clean electricity
                                                               and the design of irrigation systems. Additionally, solar
through the deployment of solar PV for the reduction of
                                                               radiation is the most basic and reliable renewable and
fossil fuel consumption.
                                                               clean energy source in nature that can play an alternative
1.2. Solar energy                                              role to fossil fuels. Therefore, the knowledge of solar
                                                               radiation is essential for the optimal design and
Amongst the three most harnessed RE resources (solar,
                                                               evaluation of solar energy applications, such as
small hydropower, and wind), solar photovoltaic is the
                                                               photovoltaic and solar-thermal systems. Solar radiation
most deployed. This is mainly because of its widespread
                                                               takes a reasonable time before it reaches the Earth’s
availability coupled with the continuous price decline of
                                                               surface, causing it to have various extra-terrestrial
PV components, easy installation, and low maintenance
                                                               interactions with the atmosphere and surfaces of objects
cost. Solar energy is regional dependent and the annual
                                                               along its path. The amount of solar radiation per unit of
direct solar irradiation in some regions exceeds 300 Watt
                                                               horizontal area for a given locality is called, insolation, it
per square meter (W/m2). A study observed that many of
                                                               originates from the sun, and depends mainly on the
the countries that are likely to experience a rapid increase
                                                               distance between the earth and sun, and solar zenith
in urbanisation are in solar-rich regions, such as
                                                               angle. Insolation can also be altered by the atmosphere,
Singapore, Nigeria, Spain, Australia, India, and South
                                                               topography and surface features, as it travels down the
Africa ("World Energy Council. ( 2013, 15/01/2018).
                                                               earth. At the earth's surface, it forms three radiation
World Energy Resources: Solar "). This gives solar PV
                                                               components, as shown in Fig 1 - direct, diffuse, and
systems the greatest potential for wider utilisation in
                                                               reflected radiations − the direct radiation makes a direct
SSA. Singapore is already exploiting the PV system, and
                                                               line from the sun as it is intercepted by the earth
have planned to raise solar power through a roadmap that
                                                               unobstructed; the diffuse radiation is dispersed by
adopts two scenarios - a “baseline” (BAS) scenario and
                                                               atmospheric constituents, such as dust and clouds as it
an “accelerated” (ACC) scenario (Roadmap, 2020). The
                                                               travels through them; and the reflected radiation hits on
targets of these scenarios are BAS - 1 GWp and 2.5 GWp
                                                               surface features along its path and gets reflected. The
by 2030 and 2050, respectively; ACC - 2.5 GWp and 5
                                                               summation of these three radiation components is called
GWp by 2030 and 2050, respectively. The success of this
                                                               global or total solar radiation.
plan will save the yearly CO2 emissions of about 1.6
million tonnes (Mt) and 3.4 Mt by 2030 and 2050,
respectively. The realisation of the significance of
massive deployment of the different scales of solar PV
systems in SSA will help to address the frequent
blackouts and inadequate power supply considerably. At
the same time, it would facilitate the building of a
sustainable energy system in the end, which will reduce
CO2 emissions (Njoku & Omeke, 2020).
Despite the successes recorded in solar efficiency,
structure, and cost, the efficiency of multi-crystalline
silicon photovoltaic (PV) cell is hovering around 10% to
17% (Kammen & Sunter). Recently, PV laboratory
studies have reported efficiency of over 40%, using               Fig 1: Components of total/global radiation (direct,
concentrated multi-junction cells (NREL, 2016).                    diffused, and reflected radiations) (Cotfas, N/A)
Researches are still ongoing to further improve the PV
                                                               Amongst these three components, direct radiation is the
panel conversion performance and cost decline. Hence,
                                                               largest component, followed by diffuse radiation while
this study assesses the solar PV potential of Glenmore
                                                               the reflected radiation constitutes the least proportion,
Crescent, Berea, KwaZulu-Natal in South Africa and use
                                                               except for locations surrounded by highly reflective
the information to design a solar PV system for the
                                                               surfaces, such as snow-covered areas. The point locations
location. The objectives of the study include discussion       or entire geographic area’s radiation can be estimated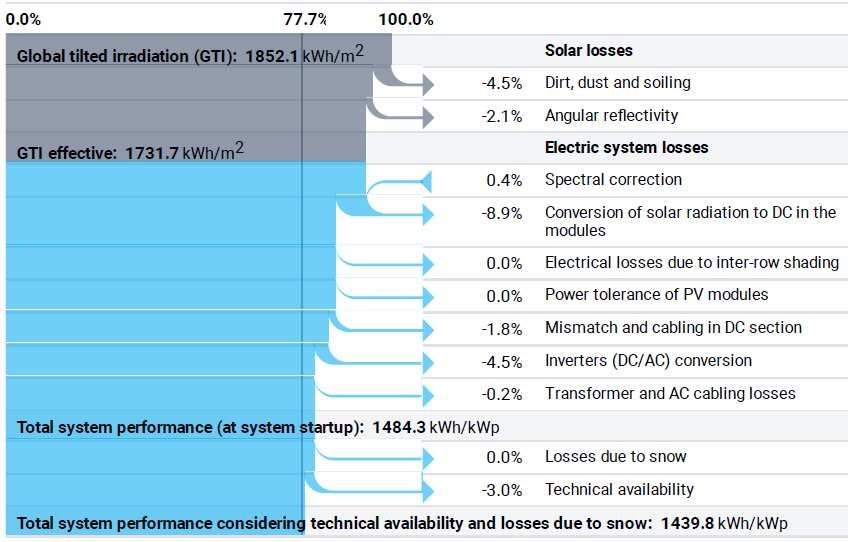
using solar radiation tools and this involves the following Global Tilted Irradiation/Irradiance (GTI), or total
four steps (Alamoud, 2000; Cioban, Criveanu, Matei, radiation collected on a surface with set tilt and azimuth
Pop, & Rotaru, 2013; Rich, Dubayah, Hetrick, & Saving, angles, fixed or sun-tracking is the summation of the
1994): direct, scattered, and reflected radiation. It is occasionally
affected by shadow and is used for PV applications.
i. The computation of an upward-looking
hemispherical viewshed based on topography. 2.2.1. Global radiation calculation
ii. Estimation of direct radiation by overlaying the
The estimated of global radiation (Globaltot) is:
viewshed on a direct sun map.
iii. Estimation of diffuse radiation by overlaying the Globaltot Dirtot Diftot _______________ (1)
view-shed on a diffuse sky map
This process can be repeated for every location of interest Where Dirtot and Diftot are direct and diffuse radiation of
to create an insolation map. all sun map and sky map sectors, respectively.
2.2. Mathematical calculation of insolation Dirtot Dir ,
__________________________ (2)
The solar radiation analysis tools compute insolation
throughout a landscape or for particular locations, centre Dir , SConst * m ( ) * SunDur , * SunGap , *
_ (3)
cos AngIn ,
on techniques from the hemispherical view-shed
algorithm created by Rich et al. (Fu & Rich, 2002; Rich
et al., 1994). The total radiation is computed for a specific Where Dirθ,α is the direct insolation from the sun map
location and is given as global radiation. The computation
sector (Dirθ,α) with a centroid at zenith angle (θ) and
of direct, diffuse, and global insolation is replicated for azimuth angle (α); SConst is the solar constant, and 1367
every featured location on the topographic surface,
W/m2 is usually used in the analysis; β is the
creating insolation maps for the total geographical area.
transmissivity of the atmosphere; m(θ) is the relative
Direct Normal Irradiation/Irradiance (DNI) is the optical path length; SunDurθ,α is the time duration
element that deals with the photovoltaic concentration represented by the sky sector; SunGapθ,α is the gap
technology (concentrated photovoltaic, CPV) and thermal fraction for the sun map sector; AngInθ,α is the angle of
(concentrating solar power, CSP). incidence between the centroid of the sky sector and the
axis normal to the surface.
Global Horizontal Irradiation/Irradiance (GHI) is the
summation of direct and diffuse radiation collected on a Relative optical length, m(θ), is function of solar zenith
horizontal plane. GHI is used as the basis for climatic angle (θ) and elevation above sea level. For zenith angles
zones radiation comparison and is an essential parameter less than 80°, relative optical length, m(θ):
for computing radiation on a tilted plane.
m EXP 0.000118* Elev 1.638*109 * Elev 2 / cos ____________________________________ (4)
Angle of incidence (AngInSkyθ,α):
AngIn , acos Cos * Cos Gz Sin * Sin Gz * Cos Ga ______________________________ (5)
Where Gz is the surface zenith angle, and Ga is the surface azimuth angle
2.2.2. Computation of diffuse radiation fraction and angle of incidence utilizing this expression in
(6):
The diffuse radiation at its centroid (Dif) is estimated,
integrated over the time interval, and corrected by the gap
Dif , Rglb * Pdif * Dur * SkyGap , *Weight , * cos AngIn , __________________________________ (6)
Where Rglb is the global normal radiation; Pdif is the without correction for angle of incidence, then correcting
proportion of the diffused global normal radiation flux (it the proportion of direct radiation, which equals 1-Pdif:
is usually estimated 0.2 for very clear sky conditions and
0.7 for very cloudy sky conditions); Dur is the time
Rglb SConst m( ) / 1 Pdif _______ (7)
interval for analysis; SkyGapθ,α is the gap fraction for the
sky sector (proportion of visible sky); Weightθ,α is the Weight , cos2 cos1 / Divazi ____ (8)
proportion of diffuse radiation starting from a given sky
sector relative to all sectors; AngInθ,α is the angle of Where θ1 and θ2 are the bounding zenith angles of the sky
incidence between the centroid of the sky sector and the sector; Divazi is the number of azimuthal divisions in the
intercepting surface. sky map.
The global normal radiation (Rglb) can be computed by For the standard overcast sky model, Weightθ,α is
summing up the direct radiation from every sector, computed as follows:
Weight , 2cos2 cos22 2cos1 cos21 / 4* Divazi _______________________________________ (9)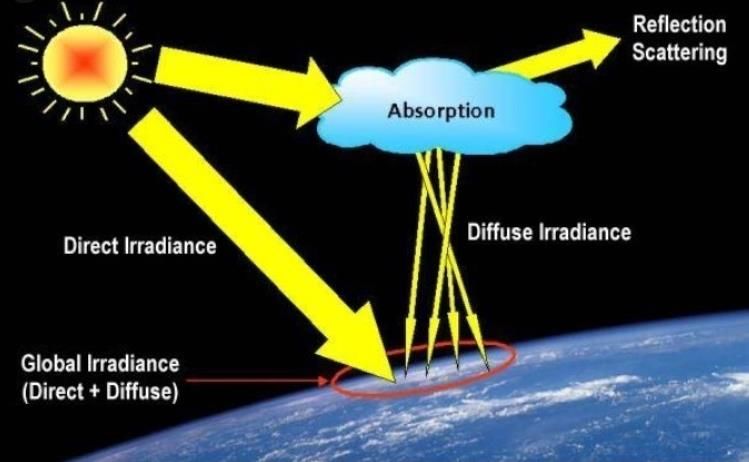
Total diffuse solar radiation for the location (Diftot) is study, sizing, and conditions and parameters
computed as the sum of the diffused solar radiation (Dif) data analysis of specific to a project
complete PV
from all the sky map sectors: systems. The PV
systems include
Diftot = Dif , _______________________ (10) stand-alone, grid-
connected, pumping
2.3. Solar PV system design and simulation and DC-grid. The
applications application has
extensive
Many reliable and innovative software applications have metrological and PV
been developed to carry out solar PV assessment, system systems components
databases, as well as
design, costing, energy generation prediction, and general solar energy
operation activities. Other uses are obtaining PV site tools
location and meteorological information, assessing the
site's solar PV potential, and conducting system design, 3. Methodology
PV panel degradation assessment, and financial analysis.
The impacts of the sun on a geographic area of a given The study involves the assessment of solar PV potential
period can be mapped and analysed using solar radiation of Glenmore Crescent, Durban North, South Africa;
analysis tools that exploit two methods: estimation of the electricity generation capacity of the
location; and model solar PV system. The study will
i. Calculation of insolation across an entire exploit the geospatial technology of two PV software
landscape, in a repeated manner for each applications, PV*SOL and Solargis, to evaluate and
location in the input topographic surface, using present solar resource information, PV system design
area solar radiation tool landscape. model, simulation, and optimization results. The software
ii. Calculation of the amount of radiant energy for a applications are supported with satellite-derived annual
specified location, using the point's solar global solar radiation and temperature data. The
radiation tool. assessment will be used to define the amount and pattern
of solar insolation and the capacity of PV power that can
In addition, they are used by solar installers for system be generated by the solar resource. This information will
design for stand-alone/off-grid, grid-connected, and be inputted in the modelling of solar PV system for the
hybrid systems for industrial plants, commercial, and generation of electricity with net-zero or sub-zero CO2
residential buildings (Li, 2021). Some of these emissions. The schematic diagram in Fig 2 represents the
applications and their uses are presented in Table 1. flowchart of the methodology employed in this study.
Table 1: Software applications used for solar PV systems
performance analysis (Dondariya et al., 2018; Fuzen,
2021; Khatib, Mohamed, & Sopian, 2012)
Software Software Inputs required
specifications
PV*SOL It is applied for the Location Coordinates, Fig 2: Schematic of the methodology flowchart
Planning and meteorological data,
simulation of a site- system and auxiliary 3.1. Location information and system description
specific solar PV devices requirements
system. Detailed information of the site location is a requirement
SolarGIS A satellite map- Type of PV technologies, for an accurate solar PV potential estimation since the
supported online local coordinates, AC/DC performance of the PV system depends on site-specific
simulation tool for losses, load demand,
meteorological factors. These factors are wind speed,
site assessment, cable sizing.
planning and solar irradiance characteristics, and ambient temperature.
optimization of solar Other determinants are installation site factors, which
PV systems, and include dust, pollution level, latitude, orientation, and tree
comparing energy cover. The site is located in a residential area and a
harvest from various
PV technologies. section of the site, as obtained from Google Map, is
PVGIS An open-source Total irradiance, Monthly shown in Fig 3.
research tool for values of atmospheric
performance conditions, the mounting
assessment of PV position
technology in
geographical regions
and as a support
system for
policymaking in the
European union
SISIFO An open web service Location of the system,
software for the solar resource data,
simulation of PV technical characteristic of
systems the system and optionally
system economics.
Fig 3: A section of Glenmore Crescent, Durban North,
PVsys A software Site location, Albedo South Africa
application for the definition, some sizing
For this study, a hypothetical household building was          Land cover                    Urban areas
selected as a site, at a latitude of 29.800955°, the           Population density            2892
                                                               (inh./km2)
longitude of 31.0327245° in Glenmore Crescent, Durban          Terrain azimuth (°)           118
North, South Africa. Other information on the selected         Terrain slope (°)             3
site is presented in Table 2.                                  Annual air temperature at     20.9
                                                               2 m (°C)
   Table 2: the site location and the system information
Site location information                                      Generally, the grid-connected PV system is made up of
Project name                Durban North                       solar PV panel arrays, a solar inverter, electrical panel,
Address                     Glenmore Crescent, Durban North,   array mounting racks, cabling, meters, combiner box,
                            South Africa                       surge protection, disconnects (array DC disconnect,
Geographical coordinates    -29.800955, 31.0327245
(°)
                                                               inverter DC disconnect, inverter AC disconnect, exterior
Time zone                   UTC+02, Africa/Johannesburg        AC disconnect), and grounding equipment other electrical
                            [SAST]                             accessories, as shown in Fig 4.
Elevation (m)               48

                  Fig 4: Components of the grid-connected PV system (Roos, Nelson, & Brockman, 2009)
3.2. Simulation of grid-connected PV system                    inverter without storage is suitable for this type of PV
                                                               system. Monocrystalline PV cell material was selected
The selection of the load profile, PV module, and
                                                               because of the quest for higher efficiency and the system
installation types will be carried out using solar PV
                                                               is on a fixed stand type that can adequately power a
potential evaluator and design applications. Based on
                                                               household of a small family. Details of other inputs used
inputs optimisation considerations, the PV*SOL and
                                                               in this study are presented in Table 3.
Solargis software applications will be used to evaluate
various parameters of a solar PV system, such as the                             Table 3: System information
daily, monthly, and yearly irradiations, terrain horizon           Load profile                2-Person household with 2-children
and day length, energy production, annual yield, and               Energy consumption          3500
total system losses. In addition, a tabular comparative            (kWh)
                                                                   System size (kWp)           Installed capacity: 6
analysis of some critical solar system parameters
                                                                   Installation type           Roof mount
overview will be presented.                                        PV module type (%)          c-Si - crystalline silicon (mono),
                                                                                               efficiency 18.9
4. Simulation results and discussion                               Geometry of PV              Azimuth: 0; Tilt: 30
                                                                   modules (°)
This section presents a detailed description of the load           Inverter type (%)           Inverter 95.9 (Euro efficiency)
profile, configuration of the PV system, and the inputted          Transformer type            No transformer
                                                                   Snow and soiling losses     Monthly soiling losses up to 4.5;
parameters. It also includes simulation results                    at PV modules (%)           Monthly snow losses up to 0.0
presentation, analysis, and discussion of solar                    Cabling losses (%)          DC cabling 1; DC mismatch 0.8;
irradiations, energy production, annual yield, and total                                       AC cabling 0.2
system losses.                                                     Albedo                      20
                                                                   System availability (%)     97
4.1. The description of the system
                                                               4.1.1. The potential                 solar    resource       -       solar
The installation type used in this study is a rooftop               irradiation
mount, meaning that the 6 kWp-installed capacity of the
PV system was hypothetically mounted on a tilted roof of       Solar insolation fuels the PV power system, hence, is the
a residential building. The Azimuth and angle of tilt of       most     significant     project-specific   meteorological
the PV panels are harmonised such that the panels do not       parameter that defines or boosts solar electricity
overlap or shade each other. The mounting of PV panels         generation. Solar irradiation was used professionally to
on rails that are attached to a tilted roof gives room for     evaluate the energy yield of a PV system site at Glenmore
backside ventilation. A low-voltage grid connection,           Crescent, Durban North. The estimates of solar monthly
which is in a parallel circuit connection, through an          and yearly variations of GHI, DNI, and DIF of the
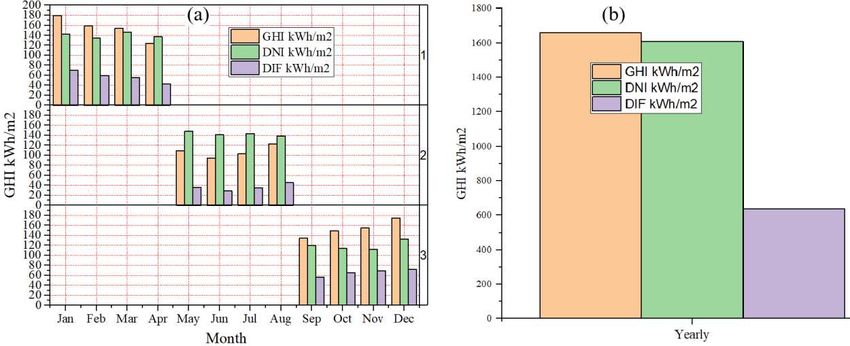
selected site, as obtained from Solargis Prospect, are         to March, and September to December and low for four
depicted in Fig 5 (a) and (b), respectively. Durban North      months – April to August, as shown in Fig 5(a).
has GHI relatively high in seven months - from January

         Fig 5: The estimates of (a) solar monthly and (b) yearly variations of GHI, DNI, and DIF of Durban North
The highest irradiation of the site under consideration is     the year is from 95 to 190 kWh/m2. The pattern of
in January; the results from Solargis Prospect and             irradiance obtained, further strengthened the assertion
PV*SOL show 180 kWh/m2 at 24 °C and 190 kWh/m2 at              that solar energy significantly depends on seasonal
21 °C, respectively, as shown in Fig 6 (a) and (b). The        variation across the year.
range of solar insolation received by the site throughout

   Fig 6: Monthly irradiation and temperature data at Durban North, South Africa obtained from (a) Solargis; and (b)
                                                       PV*SOL
4.1.2.    Terrain horizon and day length                         Fig 7: (a) Path of the sun over a year in Surabaya; (b)
                                                                            Day length and solar zenith angle
The length of a day is determined by the following
factors - geographical latitude of the location, altitude of   4.2. Performance parameters
the sun, hour angle, and the sun declination angle. Fig
                                                               The sustenance of the ongoing development of the solar
7(a) presents the horizon and sun path over a year in
                                                               PV industry depends critically on the accurate PV system
Durban North (the module horizon, terrain horizon, and
                                                               performance. The performance parameters are used to
active area with civil and solar time), which may have a
                                                               make comparisons of systems with different geographic
shading effect on solar radiation. The change of day
                                                               locations, design, and/or technology, and to allow
length and minimum zenith angle during a year are
                                                               operational problems detection. These parameters, which
presented in Fig 7(b). The local day length (the time
                                                               include performance ratio (PR), reference yield, final PV
when the Sun is above the horizon) is shorter compared
                                                               system yield, and Photovoltaics for utility-scale
to the astronomical day length if obstructed by a higher
                                                               applications (PVUSA) rating, define the overall system
terrain horizon.
                                                               performance concerning the solar resource, energy
                                                               production, and total system losses effect (Marion et al.,
                                                               2005). One of the most significant variables for
                                                               estimating the efficiency of a PV plant is PV.
                                                               4.2.1.   Performance ratio (PR)
                                                               The performance ratio is the ratio of the actual energy
                                                               output and the possible theoretical energy output. It is
mainly independent of the positioning of a PV plant and
the incident solar irradiation on the PV plant. It is a
measure of a PV system performance, taking into account
meteorological factors, such as irradiation, climate
changes, relative humidity (RH), and temperature. Hence,
the PR can be used to compare PV plants supplying the
grid at various locations all over the world.
The ratio between specific alternating current (AC)
electricity output of a PV system and global tilted Fig 8: Annual energy production and consumption
irradiation (GTI) obtained by the surface of a PV array, is
termed as performance ratio (PR). For the small household, the projected total energy
consumption from the software is 3500 kWh. The PV
PVOUTspecific system supplied 1502 kWh, about 43%, and the
PR ________________________ (12) remaining energy consumption covered by the grid is
GTI
1998 kWh. The total annual energy produced from solar
Also, PV and consumed are 10854 kWh and 1502 kWh,
respectively. This means that 9,082 kWh (about 86% of
Yf
PR the energy generated) will be connected to the grid, as
Yr shown in Fig 9.
Eout
Po
=
Hi
G
i , ref
______________________________________ (13)
Where PVOUTspecific is the specific photovoltaic power
output (kWh/kWp), Gi is the sum of direct, diffuse, and
ground-reflected irradiance incident upon an inclined
surface parallel to the plane of the modules in the PV Fig 9. Energy feed-in grid and energy consumption
array, Hi is the in-plane irradiation kWh/m2, Eout is the covered by PV and grid
Energy output from PV system (AC), (kWh); Po, is the 4.3. Effects of relative humidity, temperature, and
array power rating, AC, (kW). wind speed
The computation and report of PR are based on monthly The power output of a PV system is significantly affected
or yearly output, although it can be calculated for smaller by the minimum and maximum ambient temperatures
intervals, such as daily or weekly. This may be used to (Temp), wind speed (WS), and relative humidity (RH)
identify the occurrences of component failures. Because (Park, Oh, & Kim, 2013; Shrestha, Thapa, & Gautam,
of losses due to PV module temperature, the values of PR 2019). The rise of cells temperature coupled with
in the winter are greater than in the summer, which mismatch losses, dust accumulation, power-point errors,
usually falls within the range of 0.6 to 0.8. The maximum and shading, account for array capture losses (Lc), which
energy production is 1100 kWh in August, while the is the difference between the reference (YR) yield an array
minimum is 810 kWh in February, as shown in Fig 8. yield (YF) (Atsu, Seres, & Farkas, 2021; Marion et al.,
The reasons behind the high yield in August are the 2005; Shiva Kumar & Sudhakar, 2015). Where YF is also
longest day of sunshine and low ambient temperature. known as the final yield of the system. Mathematically,
The cloudy or rainy season is responsible for the low the array capture losses is computed using this
yield in February. Similarly, heavy electrical load, such expression:
as water geyser, and room heater connected to the system
during winter accounts for the high-energy consumption Lc YR YF ____________________________ (11)
(300 kWh) in July and August.
High humidity, Temp, and WS affect the performance of
the PV module adversely. The humidity condenses and
creates a deposit on the PV panel at the night and this
cause greater deflection of irradiance during the day. The
curves of RH, temperature and WS for the Durban North
site showed a similar pattern, as presented in Fig 10.
Fig 10: RH, Temp, and WS components of meteorological parameters
The testing and rating of solar panels are usually carried
out at about 25 °C and are expected to perform optimally
between 15 °C and 35 °C. However, during the summer,
the temperature of solar panels in some areas may be as
high as 65 °C (BostonSolar, 2021). According to the
meteorological information obtained from Solargis, the
annual average temperature of Durban North is 20.6 °C
while the lowest (16.6 °C) and highest (24.3 °C)
temperatures of Durban North were recorded in July and
February, respectively. Further evaluation and analysis of
the project-specific meteorological parameters, as
presented in Fig 11, shows that the relation between PR                 Fig 11: The graph of RH, Temp and PR
and RH; and PR and temperature are both inverses:
                                                               The efficiency of the PV module is highly affected by the
   i.   The highest PR corresponds to the lowest               sensitivity of the Si-based PV module to cell temperature.
        temperature value. This means that the PV              Consequently, there is a notable solar PV system
        system produces more energy at low                     efficiency loss in locations with long hot seasons, due to
        temperature. It implies that the solar PV system       high temperatures. The negative effects of elevated
        is more efficient at low temperature.                  temperatures on PV system can be minimized in many
  ii.   The months (June and July) are of a very high          ways. These include - leaving few millimetres between
        PR, which corresponds to the months of a               the panel and the roof to allow convectional airflow
        relatively low RH value. This means that the PV        to cool the panels; use of light-coloured materials to
        system produces more energy when humidity is           construct panels to reduce heat absorption; and keep
        low. Low humidity causes little limitation to          components, such as inverters and combiners under a
        electricity production by the solar PV system.         shaded area behind the array. The influence and relation
                                                               of other solar PV parameters are presented in Fig 12.

            Fig 12: Effect of humidity on irradiance (a) reflected irradiance; (b) reflected irradiance and PR
Where Gim is the monthly sum of global irradiation             4.4. Other PV performance determinants
(kWh/m2), Gid is the daily sum of global irradiation
                                                               Many parameters, aside from the ones discussed above,
(kWh/m2), Did is the daily sum of diffuse irradiation
                                                               are used to determine the potential of PV and the level of
(kWh/m2) and Rid is the daily sum of reflected irradiation
                                                               performance of a location and system, respectively. Some
(kWh/m2)
                                                               of these are the ratio of diffuse horizontal irradiation to
                                                               global horizontal irradiation (D2G); Fraction of solar
                                                               irradiance reflected by surface, the ratio of upwelling to
downwelling (GHI) radiative fluxes at the surface, known               the quantification of energy demand needed to heat a
as surface albedo (ALB). Others are soiling losses and                building called heating degree-days (HDD). This study
snow losses; the quantification of energy demand needed               estimated     values   of    these   parameters    are
to cool a building, called cooling degree-days (CDD); and
presented in Table 4.
Table 4: PV performance determinants
 Month                   Jan     Feb     Mar    Apr     May     Jun        Jul     Aug      Sep     Oct         Nov          Dec          Yearly
 D2G                     0.393   0.372   0.36   0.349   0.325   0.312      0.337   0.37     0.417   0.438       0.447        0.415        0.384
 CDD degree days         179     175     172    106     69      37         29      42       44      66          94           143          1155
 HDD degree days         0       0       0      0       3       19         32      20       11      1           0            0            87

 Soiling losses %        4.5     4.5     4.5    4.5     4.5     4.5        4.5     4.5      4.5     4.5         4.5          4.5

 Snow losses %           0.0     0.0     0.0    0.0     0.0     0.0        0.0     0.0      0.0     0.0         0.0          0.0
                                                                                            kWh/         kWh/         %            Partial         Cum
Durban North experiences temperature between 16.6 °C                                        kWp          kWp                       %               ul.
and 24.3 °C, rainfall, spectacular thunderstorms, and high                                                                                         %
humidity that can make muggy days during summer,                      Global in-plane       1873         -            -            100.0           100.
                                                                      irradiation (input)                                                          0
usually from October to March. These conditions hinder
                                                                      Global irradiation    1865         -            -            99.6            99.6
solar PV production performance and that is why the PR                reduced by terrain                 7            0.4
in these months are relatively low. In winter (June-                  shading
August), the condition is different, as the temperature is            Global irradiation    1817         -            -            97.4            97.1
between 0 °C and 20 °C and July is the sunniest month                 reduced by                         4            2.6
                                                                      reflectivity                       8
with an average temperature of 22 °C. The various                     Conversion to DC      1594         -            -            87.7            85.1
weather conditions across the year are shown in Fig                   in the modules                     2            12.
13(a). The southern position in the hemisphere accounts                                                  2            3
for the times of sunrise and sunset in South Africa. Part                                                4
                                                                      Other DC losses       1506         -            -            94.5            80.4
of autumn (May) and winter months (June-August) have                                                     8            5.5
the longest days, while the summer months (December-                                                     8
February) have the shortest days (Worlddata.info, 2021).              Inverters (DC/AC      1469         -            -            97.5            78.4
The Durban average monthly hours of sunshine is                       conversion)                        3            2.5
                                                                                                         8
represented in Fig 13(b).
                                                                      Transformer and       1447         -            -            98.5            77.3
                                                                      AC cabling losses                  2            1.5
                                                                                                         2
                                                                      Reduced               1403         -43          -3.0         97.0            74.9
                                                                      availability
                                                                      Total system          1403         -469         -25.1        -               74.9
                                                                      performance

                                                                      The estimation of the energy conversion and losses steps
                                                                      using Solargis PVplanner can be categorized into two
                                                                      components - losses numerically modelled by pvPlanner
                                                                      and losses that are assessed by the user. The integration
                                                                      of these components gives the theoretical losses due to
                                                                      energy conversion in the PV power system, as depicted in
                                                                      Fig 14.

Fig 13: Durban North average monthly hours of sunshine
              (Weather&Climate, 2021)
Solar PV performance: Energy conversion and system
losses
The evaluation of the long-term average performance
ratio (PR) is important and required for a start-up
production of a PV system. The overview of the
theoretical yearly specific estimate of solar electricity
generation by a PV system, without the long-term ageing
and performance degradation of PV modules and other
system components reflection, are presented in Table 5
and Fig 8.
Table 5: System losses and performance ratio
                                                                        Fig 14: The theoretical losses due to energy conversion in
Energy conversion step Energy output Energy loss Performance                              the PV power system
ratio
Performance comparison shortcomings. The key points obtained from the
The summary of the technical performance simulation of simulation results are as follows:
the solar PV system obtained from the three PV software i. The reported annual energy yield of 1403
applications is reported in Table 6. The results obtained kWh/kWp, shows that the monocrystalline PV
from software applications, PV*SOL, Solargis Prospect, module rooftop grid-connected system
and PVplanner, were similar. The outputs from Solargis installations in Durban North of South Africa are
Prospect and PVplanner were closer, while PV*SOL technically viable green energy alternative for
energy output deviates much more, compared to the other residential areas, government buildings, business
two. Solargis Prospect and PVplanner reported March as centres, etc.
the month with the highest energy output while PV*SOL
shows maximum energy output in August. The rise in ii. Depending on the available rooftop area, the PV
temperature causes a decrease in solar PV output; hence, energy production performance is good with the
the output in March should be less, while the moderate scope of capacity scale up above 6 kWp in the
temperature in August allows energy conversion from the Durban North region.
solar PV system. This was observed in PV*SOL energy iii. The annual energy production of 8419 kWh was
output only and the PR pattern outputs of both Solargis reported and about 86% of this was fed into the
and PVplanner applications. The PR obtained from grid.
PV*SOL is significantly higher than Solargis software
applications. iv. The solar PV system PR of 74.9% obtained is
satisfactory for installation and commissioning
Table 6: summary of results obtained from PV*SOL, and
SolarGIS Prospect and PVplanner v. By using the proposed PV system, an estimated
43% reduction of the annual energy requirement
PV software PV*SOL SolarGI SolarGIS-
application S- PVplanner
from the electrical grid was obtained.
Prospect vi. Comparatively, PV*SOL exhibits easy, fast, and
Meteorological parameter
most reliable trends as a simulation tool for the
Global horizontal 1877 1659.3 1865
irradiation (kWh/m2) solar PV system.
Direct normal 1610.6
irradiation (kWh/m2)
vii. The proposed grid-connected rooftop PV system
Diffuse horizontal 636.6 in Durban North is feasible as the results show
irradiation (kWh/m2) technical viability, with the benefits of clean
Air temperature (°C) 15.5 20.6 20.9 energy provision, CO2 emission reduction, and
Performance parameter energy savings.
Annual PV energy 10583 8639 8419
(kWh) Acknowledgement
Spec. annual yield 1763.88 1439.8 1403 The authors hereby acknowledge the Research and
(kWh/kWp)
Postgraduate Support Directorate, Institute for Systems
Month with max August March March
energy output Science, and the Management of Durban University of
Average PR, (%) 88.89 77.7 74.9 Technology, South Africa, for their continuous support.
Month with max PR Conflict of interest statement
(%)
Avoided CO₂ 5662 The authors declare that there is no conflict of interest
emissions (kg/year)
Solar fraction (%) 42.5 References
Alamoud, A. R. M. (2000). Characterization and
Conclusion Assessment of Spectral Solar Irradiance in
A monocrystalline solar PV system was used to Riyadh, Saudi Arabia. Journal of King Saud
determine the technical performance parameters of a 6 University - Engineering Sciences, 12(2), 245-
kW installed capacity grid-connected rooftop solar PV 254. doi:https://doi.org/10.1016/S1018-
system to supply electricity to a household. The 3639(18)30717-7
parameters include energy yield assessment, energy Aljazeera. (2019). East Africa struggles with heavy rains
consumption, electricity feed-Ingrid, and performance as thousands displaced. Retrieved from
ratio. The study was performed using PV*SOL, https://www.aljazeera.com/news/2019/11/east-
SolarGIS-Prospect, and SolarGIS-pvPlanner. It was africa-struggles-heavy-rains-thousands-
observed that there were variations in the predicted displaced-191129061914721.html
values of annual energy production, PR, Specific annual Almasoud, A. H., & Gandayh, H. M. (2015). Future of
energy yield, and energy yield. These variations were solar energy in Saudi Arabia. Journal of King
attributed to the difference in model equations and source Saud University - Engineering Sciences, 27(2),
of climate data amongst the simulation software 153-157.
applications. However, the absence of checked irradiance doi:https://doi.org/10.1016/j.jksues.2014.03.007
data and PV power output restrains the proof of the Atsu, D., Seres, I., & Farkas, I. (2021). The state of solar
results. The study presents some valuable perceptions PV and performance analysis of different PV
into the rooftop PV system to meet the normal technologies grid-connected installations in
household’s energy needs, irrespective of the noted Hungary. Renewable and Sustainable EnergyReviews, 141, 110808. International Journal of Low-Carbon
doi:https://doi.org/10.1016/j.rser.2021.110808 Technologies, 13(4), cty038-cty038.
BostonSolar (Cartographer). (2021). How do temperature doi:https://doi.org/10.1093/ijlct/cty038
and shade affect solar panel efficiency? Ebhota, W. S., & Tabakov, P. Y. (2019). Power Supply
Retrieved from and the Place Hydropower in sub-Saharan
https://www.bostonsolar.us/solar-blog-resource- Africa’s Modern Energy System and
center/blog/how-do-temperature-and-shade- Socioeconomic Wellbeing. International
affect-solar-panel-efficiency/ Journal of Energy Economics and Policy, 9(2),
Cioban, A., Criveanu, H., Matei, F., Pop, I., & Rotaru, A. 347-363 doi:https://doi.org/10.32479/ijeep.7184
(2013). Aspects of Solar Radiation Analysis Eiden, T. J. (2014 ). Nuclear Energy: The Safe, Clean,
using ArcGis. Bulletin UASVM Horticulture, Cost-Effective Alternative. The Objective
70(2), 437-440. Standard, Fall 2013, 8(3).
Cotfas, D. (N/A). Measurement of Solar Radiation FloodList. (2019a). DR Congo – 600,000 Affected by
Calibration of PV cells. Retrieved from Floods in 12 Provinces, Says UN. Retrieved
https://slidetodoc.com/measurement-of-solar- from http://floodlist.com/africa/dr-congo-floods-
radiation-calibration-of-pv-cells/ december-2019
Dondariya, C., Porwal, D., Awasthi, A., Shukla, A. K., FloodList. (2019b). Uganda – More Fatalities After
Sudhakar, K., S.R, M. M., & Bhimte, A. (2018). Floods in Central and Eastern Regions.
Performance simulation of grid-connected Retrieved from
rooftop solar PV system for small households: A http://floodlist.com/africa/uganda-floods-central-
case study of Ujjain, India. Energy Reports, 4, eastern-region-december-2019
546-553. Fu, P., & Rich, P. M. (2002). A geometric solar radiation
doi:https://doi.org/10.1016/j.egyr.2018.08.002 model with applications in agriculture and
Ebhota, W. S. (2019). Power accessibility, fossil fuel and forestry. Computers and Electronics in
the exploitation of small hydropower technology Agriculture, 37(1), 25-35.
in sub-saharan Africa. International Journal of doi:https://doi.org/10.1016/S0168-
Sustainable Energy Planning and Management, 1699(02)00115-1
19. doi: Fuzen. (2021). List of solar PV design software tools.
https://doi.org/10.5278/ijsepm.2019.19.3 Retrieved from https://www.fuzen.io/solar-
Ebhota, W. S., Eloka-Eboka, A. C., & Inambao, F. L. epc/list-of-solar-pv-design-software-tools/
(2014). Energy sustainability through IEA. (2017). Energy Access Outlook: From Poverty to
domestication of energy technologies in third Prosperity. Retrieved from Paris, France:
world countries in Africa. Paper presented at the http://www.iea.org/publications/freepublications
Industrial and Commercial Use of Energy /publication/WEO2017SpecialReport_EnergyAc
(ICUE) 2014 International Conference. cessOutlook.pdf
https://ieeexplore.ieee.org/document/6904197 Kammen, D. M., & Sunter, D. A. City-Integrated
Ebhota, W. S., & Inambao, F. L. (2015). Domestic Renewable Energy for Urban Sustainability.
Turbine Design, Simulation and Manufacturing Retrieved from
for Sub-Saharan Africa Energy Sustainability. https://gspp.berkeley.edu/research/featured/city-
Paper presented at the 14th International integrated-renewable-energy-for-urban-
Conference on Sustainable Energy Technologies sustainability
– SET 2015, Nottingham, UK. Khatib, T., Mohamed, A., & Sopian, K. (2012). A
Ebhota, W. S., & Inambao, F. L. (2017). Facilitating Software Tool for Optimal Sizing of PV
Greater Energy Access in Rural and Remote Systems in Malaysia. Modelling and Simulation
Areas of Sub-Saharan Africa: Small in Engineering, 2012, 969248.
Hydropower. Energy & Environment, 28(3), doi:10.1155/2012/969248
316-329. Li, C. (2021). Evaluation of the viability potential of four
doi:http://journals.sagepub.com/doi/abs/10.1177/ grid-connected solar photovoltaic power stations
0958305X16686448 in Jiangsu Province, China. Clean Technologies
Ebhota, W. S., & Jen, T.-C. (2018). Efficient Low-cost and Environmental Policy. doi:10.1007/s10098-
Materials for Solar energy applications: Roles of 021-02111-1
nanotechnology Photovoltaic Materials and Marion, B., Adelstein, J., Boyle, K., Hayden, H.,
Solar Panels (1 ed.). United Kingdom: Hammond, B., Fletcher, T., . . . Townsend, T.
IntechOpen. (2005, 3-7 Jan. 2005). Performance parameters
Ebhota, W. S., & Jen, T.-C. (2018). Photovoltaic solar for grid-connected PV systems. Paper presented
energy: potentials and outlooks. Paper presented at the Conference Record of the Thirty-first
at the ASME International Mechanical IEEE Photovoltaic Specialists Conference, 2005.
Engineering Congress and Exposition, Nachmany, M., Fankhauser, S., Townshend, M., Collins,
Pittsburgh, Pennsylvania, USA. T., Landesman, T., Matthews, A., . . . Setzer, J.
http://dx.doi.org/10.1115/IMECE2018-86991 (2014). The Globe Climate Legislation Study: A
Ebhota, W. S., & Tabakov, P. Y. (2018). The place of Review of Climate Change Legislation in 66
small hydropower electrification scheme in Countries. Globe International and the
socioeconomic stimulation of Nigeria.Grantham Research Institute, London School of Roos, C., Nelson, M., & Brockman, K. (2009). Solar
Economics, London. Electric System Design, Operation and
Njoku, H. O., & Omeke, O. M. (2020). Potentials and Installation: An Overview for Builders in the
financial viability of solar photovoltaic power Pacific Northwest. Washington State University
generation in Nigeria for greenhouse gas Extension Energy Program.
emissions mitigation. Clean Technologies and Shiva Kumar, B., & Sudhakar, K. (2015). Performance
Environmental Policy, 22(2), 481-492. evaluation of 10 MW grid connected solar
doi:10.1007/s10098-019-01797-8 photovoltaic power plant in India. Energy
NREL. (2016). Transforming Energy through Science. Reports, 1, 184-192.
Retrieved from National Renewable Energy doi:https://doi.org/10.1016/j.egyr.2015.10.001
Laboratory, Office of Energy Efficiency and Shrestha, A. K., Thapa, A., & Gautam, H. (2019). Solar
Renewable Energy, USA: Radiation, Air Temperature, Relative Humidity,
Park, N. C., Oh, W. W., & Kim, D. H. (2013). Effect of and Dew Point Study: Damak, Jhapa, Nepal.
Temperature and Humidity on the Degradation International Journal of Photoenergy, 2019,
Rate of Multicrystalline Silicon Photovoltaic 8369231. doi:10.1155/2019/8369231
Module. International Journal of Photoenergy, UN. (2015). Resolution adopted by the General Assembly
2013, 925280. doi:10.1155/2013/925280 on 25 September 2015. Paper presented at the
Rich, P. M., Dubayah, R., Hetrick, W. A., & Saving, S. United Nations New York. http://daccess-
C. (1994). Using viewshed models to calculate ods.un.org/access.nsf/GetFile?OpenAgent&DS=
intercepted solar radiation: applications in A/RES/70/1&Lang=E&Type=DOC
ecology. American Society for Photogrammetry Weather&Climate. (2021). Climate in Durban (KwaZulu-
and Remote Sensing Technical Papers, 524-529. Natal), South Africa. Retrieved from
Rinaldi, F., Moghaddampoor, F., Najafi, B., & Marchesi, https://weather-and-climate.com/average-
R. (2021). Economic feasibility analysis and monthly-Rainfall-Temperature-
optimization of hybrid renewable energy Sunshine,durban,South-Africa
systems for rural electrification in Peru. Clean World Energy Council. ( 2013, 15/01/2018). World
Technologies and Environmental Policy, 23(3), Energy Resources: Solar Retrieved from
731-748. doi:10.1007/s10098-020-01906-y https://www.worldenergy.org/wp-
Roadmap. (2020). Technology-Roadmap: Solar content/uploads/2013/10/WER_2013_8_Solar_r
Photovoltaic (PV) Roadmap for Singapore. evised.pdf
Retrieved from Worlddata.info. (2021). Sunrise and sunset in South
https://www.nccs.gov.sg/media/publications/tec Africa. Retrieved from
hnology-roadmap https://www.worlddata.info/africa/south-
africa/sunset.phpSupplementary Files
This is a list of supplementary les associated with this preprint. Click to download.
Graphicabstract.docYou can also read


