Automation in Construction
←
→
Page content transcription
If your browser does not render page correctly, please read the page content below
Automation in Construction 135 (2022) 104117
Contents lists available at ScienceDirect
Automation in Construction
journal homepage: www.elsevier.com/locate/autcon
BIM-based decision support for building condition assessment
Hamidreza Alavi a, *, Rafaela Bortolini a, b, Nuria Forcada a
a
Department of Project and Construction Engineering (DPCE), Group of Construction Research and Innovation (GRIC), Universitat Politècnica de Catalunya (UPC),
Colom, 11, Ed. TR5, 08222 Terrassa, Barcelona, Spain
b
School of Architecture and Urbanism, Universidade Federal de Pelotas, Pelotas, Brazil
A R T I C L E I N F O A B S T R A C T
Keywords: Building condition assessment requires the integration of various types of data such as building characteristics,
Building information modelling the properties of elements/systems and maintenance records. Previous research has focused on identifying these
Data model data and developing a building condition risk assessment model based on Bayesian networks (BN). However, due
Unified modelling language
to interoperability issues, the process of transferring the data is performed manually, which requires considerable
Bayesian networks
Building condition
time and effort. To address this issue, this paper presents a data model to integrate the building condition risk
Facility management assessment model into BIM. The proposed data model is implemented in existing software as a case study and
Decision support tested and evaluated on three scenarios. Addressing interoperability will leverage the BIM tool as a data re
Visualization pository to automate the data transfer process and improve its consistency and reliability. It will also enable BIM
to be a more effective tool for building condition and causality analysis visualization.
1. Introduction that is needed, which is detected during an inspection, and to produce
consistent, relevant, useful information [8].
In the life cycle of a project, the operation and maintenance (O&M) A Bayesian network (BN) method can be used to simulate cause-
phases are as important as the planning and construction of the project effect relationships of uncertain factors that impact building condi
itself. Compared with other phases, the highest costs occur during the tions. The BN is a probabilistic graphical model that offers a framework
O&M phase [1], which shows the importance of Facility Management for reasoning about partial beliefs in uncertain situations [9]. It is
(FM) activities. In the broad context of FM, building maintenance is regarded as a strong technique for modelling risks, based on uncertain
generally recognized as the main activity, since more than 65% of the data [10–12]. In a reasoning process, the BN can represent complicated
total cost of FM comes from facility maintenance management [2]. linkages among building elements and systems, and qualitatively and
There are some challenges in current FM practices that have required a quantitatively characterize variable dependencies. In addition, it can
paradigm shift in the sector in recent years. Clients are demanding model a building’s condition as a probabilistic process, contrary to
strategies for predicting events instead of responding to problems [3]. deterministic models [13]. Bortolini and Forcada [13] developed a
This shift marks the transition from corrective or planned strategies to probabilistic model based on a BN that covers several interconnected
preventive and predictive strategies. The failure of building elements elements for assisting decision-making on building maintenance and
can be predicted by preventive maintenance through an analysis of retrofitting measures to improve building conditions. Although the
condition data and historical maintenance records. This increases their model can handle uncertainty and make predictions, the data that is
efficiency, reliability and safety [4]. required is dispersed among platforms. What is worse, the data is
Buildings tend to deteriorate unless they are properly maintained. transferred manually, which is a laborious, inefficient process [14–16].
The lack of a preventive maintenance plan and the building’s natural Building Information Modelling (BIM) can be a unit of the overall
aging accelerates the degradation of existing buildings [5,6]. The system architecture to solve the issues of information reliability for
application of maintenance actions is imperative to prevent defects and maintenance operations [15] and help decision-makers to address
failure of building elements and to extent the service life of the materials building maintenance concerns. BIM is “an approach to design, con
[7]. A condition assessment system is used primarily to facilitate the struction, and facilities management, in which a digital representation
ranking of all the elements of the asset according to the amount of repair of the building process is used to facilitate the exchange and
* Corresponding author.
E-mail address: seyed.hamidreza.alavi@upc.edu (H. Alavi).
https://doi.org/10.1016/j.autcon.2021.104117
Received 6 July 2021; Received in revised form 28 November 2021; Accepted 23 December 2021
Available online 31 December 2021
0926-5805/© 2021 The Authors. Published by Elsevier B.V. This is an open access article under the CC BY license (http://creativecommons.org/licenses/by/4.0/).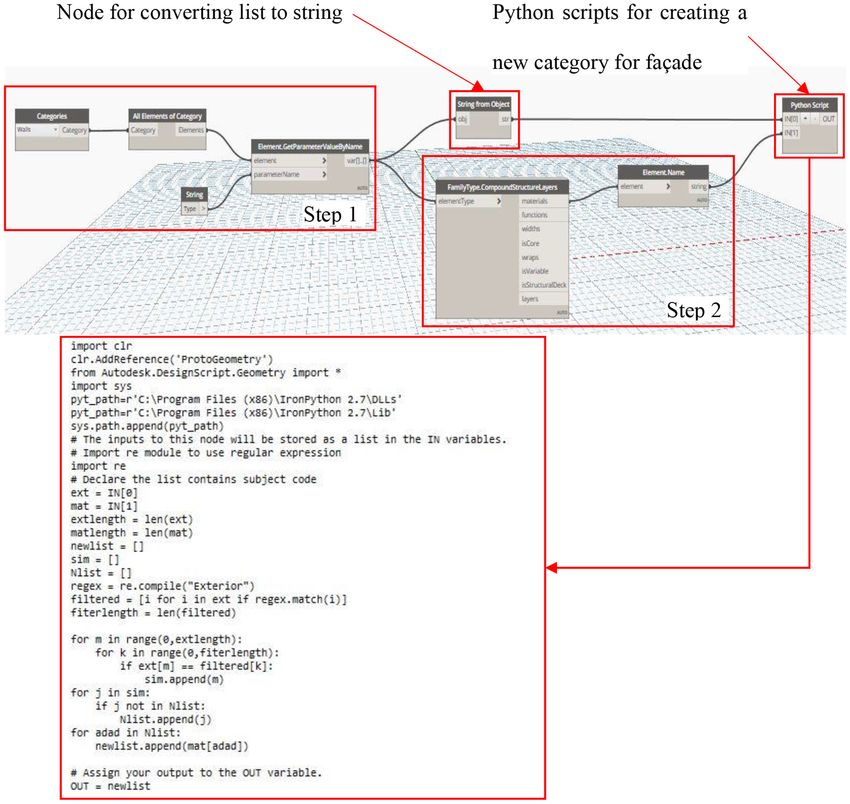
H. Alavi et al. Automation in Construction 135 (2022) 104117
interoperability of information in digital format” [1]. BIM, integrated as a means to building operation [33]. Becerik-Gerber et al. [34] showed
with a Decision Support System (DSS), may constitute a powerful that each FM activity is data-intensive and requires specific data re
methodology to support the selection of strategic management activities quirements. Kim et al. [35] focused on identifying specific data for FM
[17,18]. Nevertheless, the greatest obstacle of this integration is the lack maintenance activity and proposed a data management approach to
of interoperability in the O&M context [19,20]. integrate IFC objects, COBie data, and maintenance work information
To tackle this issue, this research presents a data model to enable from the FM system database.
interoperability between BIM models and the building condition risk
assessment model based on BN. The research provides the system ar 2.3. BIM interoperability for O&M
chitecture to implement the data model in a case study. The integration
of BIM with BN models facilitates data transfer and reduces the time and Efforts to address BIM interoperability for O&M have been made by
effort that the FM team spends on manual input. It also allows BIM tools many researchers. Ahmed Gouda et al. developed a framework by
to visualize the building elements/systems in an integrated, interactive employing semantic web technology to store maintenance information
way for decision-makers. Moreover, it helps the FM team to optimize and BIM data using COBie [36]. Cheng et al. [37] determined FM in
building operation strategies and supports decision-making on FM ac formation requirements referring to the Information Delivery Manual
tivities (e.g., predictive maintenance) to improve building performance. (IDM) and developed an integrated data-driven system based on BIM
The first step of this paper was to identify the required data for the BN and IoT technologies for predictive maintenance of building facilities
model. Then, BIM and BN models were integrated, based on the pro using COBie and the IFC extension. To enhance decision-making in FM,
posed data model to assess building condition and visualize the current Chen et al. [2] proposed a system for automated maintenance work
condition of the building elements and systems, established within Revit order scheduling, based on BIM and FM software using COBie and the
Software and employing a color scale. Finally, a case study was used to IFC extension. Marmo et al. developed a framework to address the
test and validate the proposed data model on three scenarios. interoperability issue by mapping the IFC into a relational database for
maintenance and performance management [29]. Other researchers
2. Literature review developed applications on BIM by integrating various systems to execute
maintainability analysis [38–41], indoor localization [42], fire emer
2.1. Decision support system for O&M gency simulation and analysis [43–45], fault detection and diagnosis
[46,47], sustainability assessment [48,49], and energy simulation and
A DSS can be used to make decisions in an early design development forecast [50–52].
stage and during the O&M phase. The former helps designers to identify The variety of standards and technologies available (i.e., building
multiple technical and commercial options that are compliant with pre- automation protocols such as BACnet, Modbus, ZigBee and C-Bus) is one
determined specifications and the latter help facility managers to opti of the BIM–O&M interoperability problems [19]. Hence, many re
mize building operations techniques [21]. To support decision-making searchers have focused on system-based approaches to address the
on building condition assessment, Matos et al. [22] prioritized mainte specific interoperability issue between BIM and software systems,
nance actions, using Key Performance Indicators (KPI) and a support standards or protocols in the O&M phase [51,53–55]. The system-based
tool. During the O&M phase, existing studies utilized probabilistic approaches propose a systematic architecture for data integration [56].
models to make decisions on improving building condition. Frederik Such approaches make full use of open libraries, components and
et al. [23] created a probabilistic model that learns from user feedback commercial software tools, and implement data integration architecture
and adapts to the users’ specific preferences over time to analyze [56]. Kang and Hong [56] proposed system architecture to effectively
building conditions. Yang et al. [24] developed a probabilistic model integrate BIM into geographic information system (GIS)-based FM
based on a comprehensive survey of air handling unit (AHU) fault software. Such approaches make full use of open libraries, components
detection and diagnosis methods. Lee et al. [11] developed a Bayesian and commercial software tools, and implement data integration archi
method for probabilistic occupant thermal preference categorization tecture [56]. Motawa et al. [57] developed system architecture to collect
and prediction in office buildings, to provide predictions for personal data and knowledge about building maintenance activities while and
ized thermal preference profiles. Bortolini and Forcada [13] developed a after they are performed. Lee and Cheng et al. [44,58] presented a
model for assessing the condition of a building using a Bayesian network system architecture to integrate BIM with Barcodes and Radio-
(BN) method. Despite the fact that these researchers have made a sig Frequency Identification (RFID) tags to enable timely data access.
nificant contribution, none of them automatized the data transfer pro Quinn et al. [59] proposed system architecture to extract data from a
cess or integrated BIM into their probabilistic models, which would Building Automation System (BAS) and incorporate it in BIM using a
facilitate data transfer due to the interoperability issues [25]. linked data structure. However, research on the integration of building
condition assessment and BIM is scarce. Only Ani et al. [60] integrated
2.2. Information standards for O&M information from a survey on a water ponding defect on a flat roof to the
BIM model to identify the flat roof condition.
BuildingSMART, the worldwide industry body, has developed a With respect to visualization, Tashakkori et al. [61] integrated BIM-
standard data format, the Industry Foundation Classes (IFC). The IFC based 3D indoor navigation functions with the proposed emergency
data model is intended to describe architectural, building and con management systems. Moreover, Wang et al. [43] applied the same
struction industry data and has been mostly used as the data exchange approach to find the escape route to support fire safety management of
schema between BIM and other systems such as Computerized Mainte buildings. Oti et al. [62] utilized color scheme visualization in BIM to
nance Management Systems (CMMS) and electrical instrumentation visualize data related to the energy management systems, to reflect
control (EIC) [3,26–29]. time-dependent energy consumption information. Regarding mainte
The Construction Operations Building Information Exchange nance activities, some researchers utilized BIM 3D visualizations to
(COBie), a subset of IFC data, is an international standard for exchanging locate building components and support troubleshooting in proposed
data from the design phase to the O&M phase using a formal spread maintenance systems [43,63]. In conclusion, although many studies
sheet. The version of COBie for the FM handover Model View Definition address BIM interoperability, none of them focus on interoperability
(MVD), [30] is the MVD delivered in a file format that can be viewed and between BIM and building condition assessment.
edited in Microsoft Office Excel [31]. However, it allows for the storage
of a large volume of different kinds of data, which results in overloading
[32]. Accordingly, COBie needs to be customized for facility information
2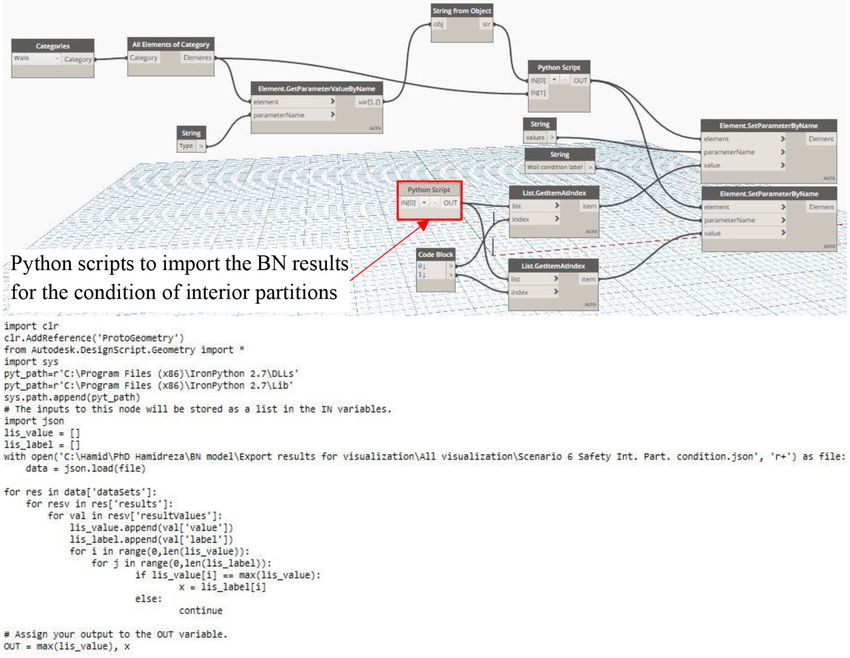
H. Alavi et al. Automation in Construction 135 (2022) 104117
3. BN model for building condition assessment building operation and maintenance; defects in building elements/sys
tems; environmental agents; and building properties including age, type
With the aim of assessing the entire condition of a building, Bortolini of elements, and whether or not preventive maintenance actions are
and Forcada [13] developed a BN model for building condition assess planned. Weather conditions, the surrounding environment, the danger
ment. This model was created using cause-and-effect relationships be of natural catastrophes and geological conditions are examples of
tween uncertain elements that impact building conditions. The environmental agents.
condition of building elements and systems was categorized as high, In the BN model, variables that impact the condition of building el
medium or low. For example, the term “high condition” refers to a piece ements and systems were represented as nodes. Depending on the data
of equipment that is in high working order and can be used to its type, they were defined as discrete (labeled, Boolean, discrete real or
maximum potential for its intended function. The BN model to assess ranked) or continuous [64]. Some nodes were defined as ranked and had
building conditions is presented in Fig. 1. Hierarchical levels could be various states such as ‘High’, ‘Medium’, and ‘Low’. Others were specified
visualized in the model that include all the general civil and architec as Boolean, with binary states like ‘Yes’ and ‘No’. For whatever element
tural elements, as well as MEP (mechanical, electrical, and plumbing) or system condition, the model can be queried by inserting evidence in
systems. the BN model and setting its state (i.e., low condition). Then, the BN
The development of the model required several cycles of analysis, calculates the probability function of the parent nodes by conducting
implementation and verification. Once the variables that have the most backward propagation, and estimates the most likely causes (e.g., age of
impact on building condition had been identified, several methods were the equipment, lack of preventive maintenance and design errors).
used in these steps. These included obtaining quantitative (real data In this study, the TNormal distribution was utilized to determine the
from existing buildings, statistical analysis and literature reviews) and probability distribution. When the mean (μ) and variance (σ2) are
qualitative evidence (a survey with domain experts). To legitimate the determined, TNormal is a suitable distribution since it allows for the
inference of cause-effect relationships between nodes, a database on creation of many distribution forms [64]. Unlike the regular Normal
1974 building defects and 5373 maintenance requests from 40 buildings distribution, TNormal has finite endpoints that range from 0 to 1 in
was used. Finally, to check and improve the model structure, experts in equal intervals. The variance parameter reflects the influence of parent
the field of building performance and facility management were inter nodes’ uncertainties. In the simplest case, the parameter mean is
viewed. The model was then refined after rounds of questions with determined as a weighted mean of the parent nodes with the following
feedback and consensus between experts. For this purpose, nine experts expression:
were interviewed in the field of building pathology and facility man
Σi = 1…n wiXi
agement. All interviewees had over ten years of experience in facility Wmean = (1)
n
management, consultation and maintenance activities. The detailed
process of the model development can be consulted in [13]. where wi ≥ 0 are weights, and n is the number of parent nodes.
The BN model was divided into building elements and systems. The The BN structure was constructed by identifying the causal relation
building elements were classified as: 1) structure, 2) façade, 3) roofing, between the variables based on the data available and expert judgment.
4) flooring, 5) interior partitions and 6) doors/windows. The building A panel of experts provided feedback on the causal relations constructed
systems were also defined as follows: 1) electrical systems, 2) plumbing by data, which helped to identify key variables or processes that were
systems, 3) HVAC systems, 4) elevator and 5) fire systems. overlooked and fix potential errors of the model. Conditional probability
Variables that impact the performance of building elements and tables for the variables can be consulted in [13]. AgenaRisk was chosen
systems were classified as: design and construction errors; policy for to construct the BN model for building condition assessment, due to its
Fig. 1. BN model for assessing a building’s condition assessment [13].
3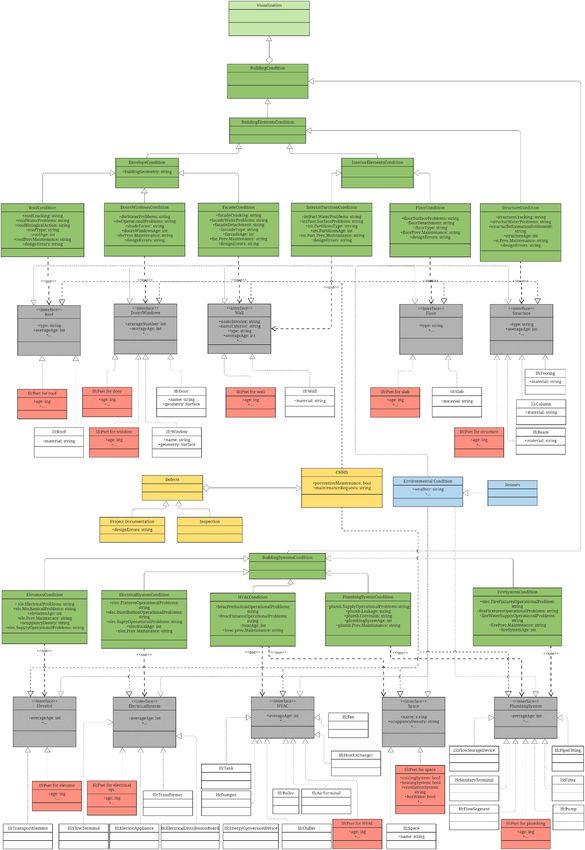
H. Alavi et al. Automation in Construction 135 (2022) 104117
Fig. 2. Conceptual design of the UML diagram for the proposed data model.
Fig. 3. UML diagram of (a) “CMMS” class and (d) “EnvironmentalCondition” class.
power, versatility and user-friendly interface [65]. It can visualize the depicted in different colors, considering different data sources. The
sensitivity analysis for the BN model to represent the importance of “CMMS” class (in yellow, [a]) includes maintenance requests and pre
causal factors. ventive maintenance records, which play an important role in identi
fying defects in building elements/systems. The
4. Methodological approach “EnvironmentalCondition” class contains a sensor to obtain the weather
conditions (in blue, [d]). Fig. 3 shows the UML diagram for “CMMS” and
A data model was designed to integrate risk condition assessment “EnvironmentalCondition” classes.
into BIM. Then, the data model was implemented into existing BIM tools The “IfcBuilding” class (in white, [c]) is considered a major data
and finally it was validated in three scenarios. The data model consisted exchange schema standard for BIM [67]. The IFC Property Set known as
of seven thematic classes, namely: “BuildingCondition”, “CMMS”, “IfcPset” is a class (in red, [b]) that contains required data on building
“EnvironmentalCondition”, “IfcBuilding”, “IfcPset”, “Interface” and condition assessments. These data are assigned to an IFC model object
“Visualization”. A Unified Modelling Language (UML) class diagram, and their class names are preceded by the prefix IfcPset.
which is a worldwide industry standard [66], was employed to present The “BuildingCondition” classes (in green, [f]) were divided into
the data model. A class diagram in the UML is a type of static structure building system condition and building element condition for ease of
diagram that describes the structure of a system by showing its classes, reading, as shown in Fig. 4 and Fig. 5. Due to the complexity of the
attributes and behavior (e.g., operations). Fig. 2 highlights the concep model and limitations of space, the attributes are not illustrated in the
tual design of the proposed data model for BIM and BN model integra class diagrams (see the Appendix A for the complete data model).
tion. In Fig. 2, the “interface” class for building elements/systems The “BuildingCondition” classes that are based on causality analysis
merged all data sources and transformed data into the appropriate use “interface” class (in grey, [e]) to assess a building’s condition. This
format by creating new attributes to support compatibility of a BIM requires the acquisition of data from various sources such as “CMMS”,
model and a BN model. To create new attributes, algorithms for various “IfcBuilding”, “IfcPset” and “EnvironmentalCondition” classes, followed
data types such as Number, Boolean and String were created. These by the transformation of these data into an appropriate format.
attributes were then required by the “BuildingCondition” class, using an UML diagrams for building system condition and building element
interface to assess a building’s condition. condition differ according to their characteristics. For instance, the
To enhance the readability of the UML diagrams, classes were “IfcBuilding” class for building element condition is comprised of IFC for
4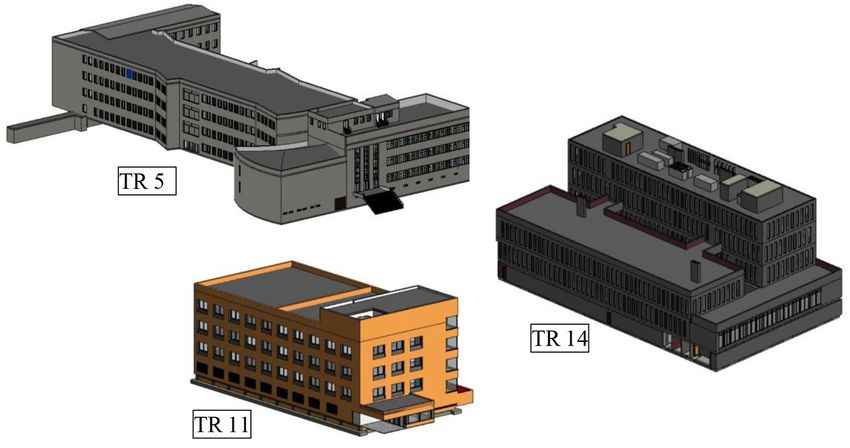
H. Alavi et al. Automation in Construction 135 (2022) 104117
Fig. 4. UML diagram of the data model on the building element condition.
elements such as IfcDoor, IfcWindow, Ifcwall and IfcRoof, while for 5.1. Parameter creation
building system condition it consists of various IFC with respect to
systems (e.g., IfcChiller, IfcDamper and IfcBoiler). To allow BIM models to contain the required data on building con
Finally, among all the thematic classes, the “Visualization” class dition assessments, a Dynamo script was used to create parameters for
(light green, [g]) represents a link through which the results of the data that could not be obtained from the BIM model, such as the age of
building condition assessments can be imported into any possible data each building element and system. All variables of the BN model were
visualization tool. considered parameters in Dynamo. Fig. 7 shows the process of creating
parameters to host relevant data in BIM using a Dynamo script.
5. Case study implementation In this study, the parameter name of the required data was exported
from the BN model as an .XML file converted into Microsoft Excel (.xls),
The data model was implemented in Autodesk Revit, which is one of an intermediate format, before mapping it to the BIM model. Then,
the most popular BIM tools in the AEC sector. The system architecture of authors manually defined the parameter types and families to assign the
implementing the data model into Autodesk Revit (i.e., a BIM tool) to required data into their relevant families in BIM. There were different
facilitate the assessment of building conditions consisted of three main kinds of parameter types, including Numbers, Strings and Yes/No
steps, illustrated in Fig. 6. (1) The parameters for the Revit model were Boolean. For example, the “HVAC age” parameter requires a numeric
created as IfcPset, based on the required data for building condition value since it contains the age of equipment. Therefore, its type was
assessment. (2) The Revit model was integrated with the BN model to considered as “Numbers” and its corresponding family was defined as
evaluate building condition using Dynamo, a visual programming “Mechanical Equipment” in the BIM model. Next, the .xls file containing
extension for Autodesk Revit, and Python programming language. (3) the parameter’s name, type (i.e., data type) and family for each item of
The BN results of the building condition assessment were exported to data, was imported into the Dynamo through a Data.ImportExcel node.
local storage and visualized in Revit in a way that the FM team can easily Eventually, all the parameters were created in the BIM model based on
understand the data. the required data from the BN model to host relevant data using a
ParameterCreateSharedParameter node in Dynamo.
5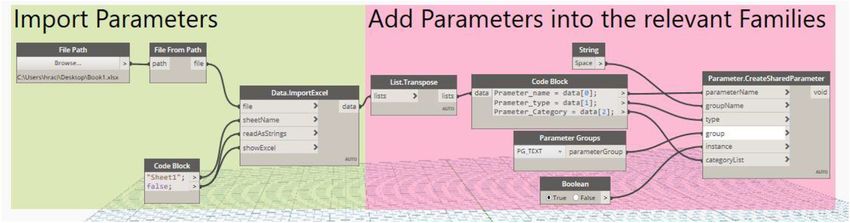
H. Alavi et al.                                                                             Automation in Construction 135 (2022) 104117

                  Fig. 5. UML diagram of the data model on the building system condition.

                              Fig. 6. System architecture for the integration.

                                                     6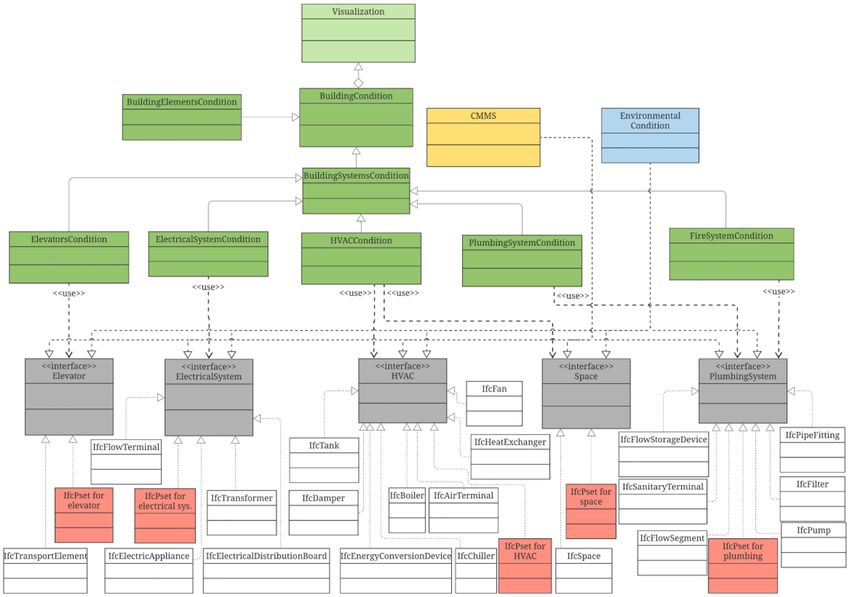
H. Alavi et al. Automation in Construction 135 (2022) 104117
Fig. 7. Dynamo scripts to create parameters.
Table 1 Table 2
Parameters in the BN model for building condition assessments. Examples of Python code blocks for transforming data.
Type Parameters States in the BN model Nodes Type States in Locate in Python code block
BN BIM in Dynamo
Boolean Façade prev. Elevators prev. Yes, No
maintenance maintenance Floor preventive Boolean Yes / No Spaces Yes_Count = list.
Roof prev. Structure prev. maintenance count(data, ‘Yes’)
maintenance maintenance No_Count = list.
Doors/windows Floor prev. count(data, ‘No’)
prev. maintenance maintenance if Yes_Count >
Cooling Interior partitions No_Count:
Heating prev. maintenance result = “Yes”
HVAC prev. Plumbing–hot water else:
maintenance Plumbing prev. result = “No”
Electrical prev. maintenance Floor age Numbers 30 if average < 10:
String Façade type Concrete panels/ result = “< 10”
masonry, metal panels, elif average > 20:
glazed, others result = “> 20”
Roof type Flat concrete, flat metal else:
panels, glazed, others result = “10 to 20”
Ventilation Forced, natural Ventilation String Forced/ Spaces if data == Forced
Structure type Concrete, masonry, steel, Natural result = “Forced”
others else:
Floor type Continuous, result = “Natural”
discontinuous, others
Interior partition Masonry walls, light
type partition walls, others transformed into an appropriate format so as to be compatible with the
Number Façade age Elevator’s age 20 BN model. To achieve this, a bunch of Python scripts was designed in
Roof age Electrical age
Doors/windows
Dynamo to transform data from the BIM into the appropriate format.
age Dynamo is a scalable way to extract data from centralized spreadsheets
Structure age Interior partitions 30 and update common parameters with a range of data types including
Floor age age Boolean, Strings and Numbers. Table 1 shows all the parameters that
Plumbing age Fire system age 10
need to be transformed to be utilized in the BN model.
HVAC age
For those data expressed in numbers (e.g., roof age, floor age), a
Python code block was used to calculate the average age of all elements
5.2. BIM-BN data integration in BIM since the BN model evaluated the condition of entire buildings
rather than a single element. For example, when one floor of a building
To transfer data between BIM and BN models bidirectionally, firstly is renovated, the “floor age” is determined by the Python code block
the required data was extracted from the BIM model using Dynamo and calculating the average age of all floors in a building and transforming
Python scripts, by creating a dataset in a JavaScript Object Notation (. the results into an appropriate format for the BN model which is “30” if the average age is greater than
into the BN tool, AgenaRisk, which utilized the data as ‘evidence’. Then, 30 years.
the FM team could run the BN model straightaway to acquire the results For data expressed in a Boolean form (e.g., “Yes” having or “No” not
of analyzing the condition of a building. Secondly, the assessment results having preventive maintenance, cooling or heating), a Python code
of a building’s condition were extracted from the AgenaRisk tool into a block was designed to enumerate all the “Yes” and “No” for each Bool
Json format and imported into the BIM model using Dynamo and Python ean to determine which one was repeated more than the other. For
to visualize the results in a 3D model. instance, for data on Having or not having heating in a room, all the
rooms were considered in a Python code block and all “Yes” and “No”
5.2.1. BIM data transfer processes were enumerated to find out whether the building had heating or not.
The options of whether or not to have preventive maintenance, The most repeated answer was considered the result for the question of
cooling, heating and different kinds of data such as building properties whether or not there was heating in the building. If the number of “Yes”
(e.g., age, type of elements) can be obtained from the BIM model. and “No” were equal, the result would be considered “No”.
However, before extracting these data from the BIM model, they must be A similar approach to Boolean and numbers can be used for strings
7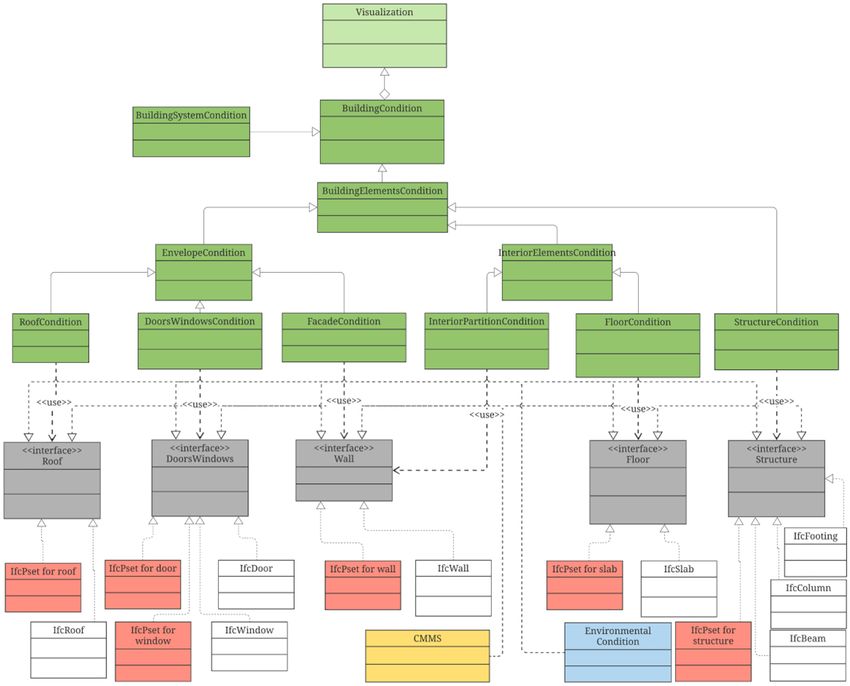
H. Alavi et al. Automation in Construction 135 (2022) 104117
Fig. 8. Dynamo scripts to create a new category in BIM for façade, as an example.
(e.g., ventilation). For example, the ventilation type in the BN model for were used to create a new category for BIM to be compatible with the BN
buildings was either forced or natural. A Python code block recognized results. For instance, the BN model assessed the condition of either
whether the building had forced ventilation or not. If not, the type of façade or interior partitions individually, both of which have the same
ventilation was considered natural. If there were more than two options category in the BIM model called “wall category”. In this example,
(e.g., façade type), the “if…elif…else” statement could be used (i.e., the regular expressions, a sequence of characters that specifies a search
same as floor age). Table 2 shows an example of Python code blocks for pattern in a Python code block were designed to distinguish the wall
floor age as numbers, floor preventive maintenance as Boolean, and category between the interior partitions and façade, to create new cat
ventilation as strings. egories in BIM for both of them. Regular expressions utilize text to
conduct pattern matching and “search-and-replace” operations. Fig. 8
5.2.2. Mapping BN results into BIM illustrates an example of creating a new category in BIM for façade.
In accordance with the BN model, the BN results assessed conditions Three steps were imperative to create a new category for façade as an
of entire buildings, comprising various groups of elements. For example, example. Firstly, a list of all wall elements for the building was created in
all windows and floors (i.e., different elements) in the building had to be the first step. Then, this list was converted to string using the “String from
taken into account to evaluate the condition of the window and floor Object” node as a regular expression supports strings. A regular
respectively. Therefore, various categories were designed using the expression was used to find the “exterior walls” among the list by string-
“Categories” node in Dynamo to match the results of the building con searching algorithms. Secondly, the material of all walls was obtained
dition assessment with the corresponding groups of elements in the BIM using FamilyType.CompoundStructureLayers and Element.Name nodes in
model. Dynamo, creating a list of material (Step 2). Thirdly, the list of all wall
Even though categories in BIM provide various groups of elements, elements was connected to the Python code block as input#0, and the
some categories on building condition assessments based on the BN list of material was connected as input#1. Next, a Python code block
model still cannot be represented. Hence, Dynamo and Python scripts queried input#0 to filter a list by exterior walls (i.e., façade). Then, it
8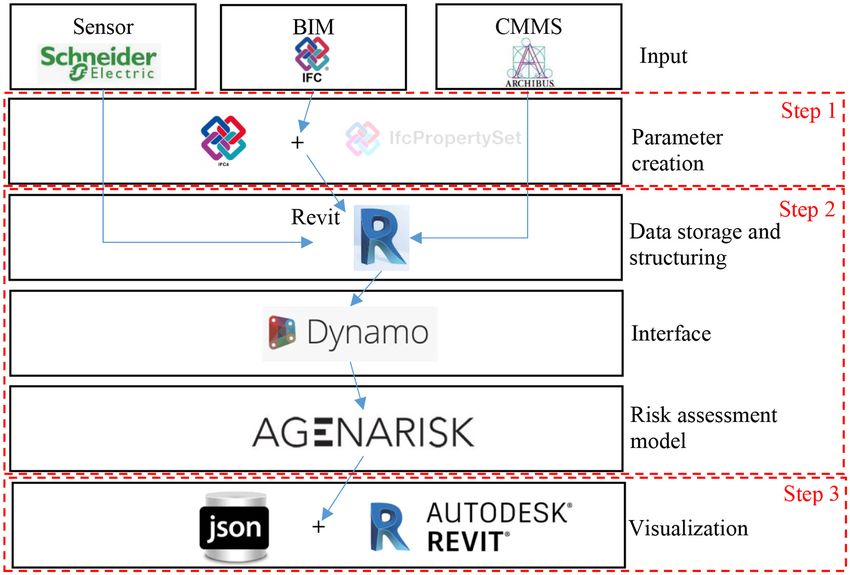
H. Alavi et al. Automation in Construction 135 (2022) 104117
Fig. 9. Dynamo scripts to map the BN results for interior partitions as an example.
low. Then, the condition for each element was mapped to its corre
sponding elements in the BIM model using GetItemAtIndex and SetPar
ameterByName nodes. Fig. 9 illustrates the process of mapping the BN
results for interior partitions as an example.
Lastly, the BIM model visualizes the results with different colors to
vary from ‘High’ to ‘Low’. The tabulated data taken from Revit’s
schedule were visualized in a 3D format in the BIM model by applying
view filters. For a given element, the relevant results of the building
condition assessment were identified. Fig. 10 illustrates the BIM visu
alization of the building’s condition as an example.
BIM visualization allows the FM team and owners to evaluate
building and system elements based on the causality analysis using
different color codes, where red represents a low performance condition,
yellow a medium performance condition, and green a high-performance
condition. The FM team would be able to filter the elements in the BIM
Fig. 10. The visualization of a building’s condition in BIM.
model to view the color associated with their condition. It is also
possible to compare building elements between different buildings.
queried input#1 to find materials that matched those from the exterior
walls (input#0) and create a new list with the exterior walls and their 6. Model evaluation
corresponding material. Eventually, the category for façade was created
to be consistent with the BN results of building condition assessments. In this study, two types of evaluation were carried out as follows: (1)
scientific data model validation and (2) software verification.
5.3. Data visualization
6.1. Scientific data model validation
The results of the building condition assessments were extracted
from the AgenaRisk tool into Json format and imported into Revit using The data model was validated by implementing it in three buildings
a Python programming language in Dynamo to be matched with cor (TR5, TR11 and TR14) of the Terrassa campus from the Universitat
responding building elements. A Python code block queried the BN re Politècnica de Catalunya (UPC), (Fig. 11). The campus includes 25
sults to find the condition of elements categorized as high, medium or buildings with classrooms, offices, laboratories, dining rooms,
9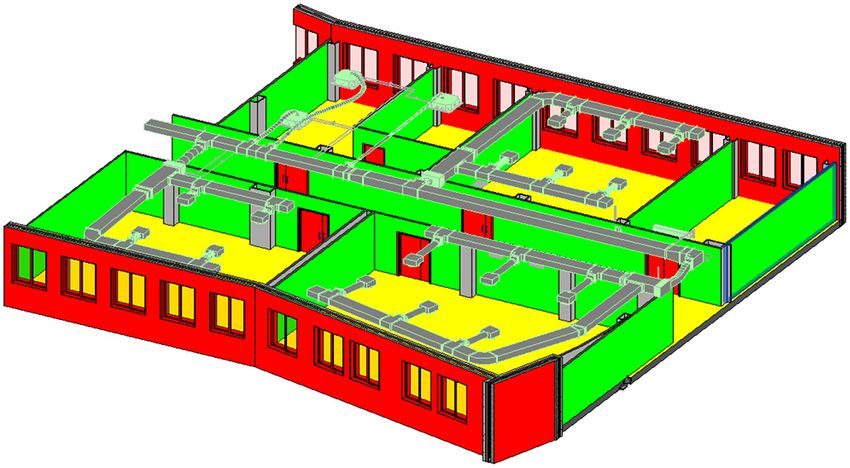
H. Alavi et al. Automation in Construction 135 (2022) 104117
Fig. 11. Case study projects.
restrooms, common areas and study areas. created, such as the age of elements and whether or not they have
The consistency of the data model was validated by running the preventive maintenance or ventilation. The Python code blocks were
proposed system architecture in TR5, TR11 and TR14 and comparing the used to calculate the data required by the BN (square meters, average
condition assessment results with those obtained from the existing age, etc.). Other parameters were created to adapt the classification of
manual method (e.g., AgenaRisk) in which the FM is required to perform the elements obtained from the BIM model to those required by the BN
the data transfer process manually. Furthermore, 18 scenarios per model. For example, the façade type was classified as “concrete panels/
building were simulated and compared with the results obtained from masonry”, “metal panels”, “glazed” and “others”.
the existing manual method. As an example, to allow data integration and interoperability
The completeness of the data model was validated by [68]: a) regarding the ventilation system, the algorithm for “HVAC interface”
checking the Json data formatting, b) checking either an empty or null created new attributes to be compatible with the BN model considering
value for each data item in the Json file. the entire buildings. In TR5, for instance, since most rooms (e.g., offices,
The first step validates the Json data for correctness and provides a classrooms and corridors) have an air-water system, the new “Forced”
list of missing data in the validation report one after another, until all the attribute was created while in TR11 the new attribute was “Natural”. For
required data is complete. In this study, a Json validator (e.g., TR14, it was also considered as “Forced” on account of having air
http://jsonlint.com/) was used to validate Json data for formatting. If handling units (AHU) and fan coils in all rooms.
the data in the Json file is incorrect or incomplete, the validation will With respect to flooring, the algorithm for floor “interface” created
report a failure to assist in the debugging of Json data [69]. new attributes for buildings. In TR14, the floor is “discontinuous” as it
The second step ensures that all data have their value, demonstrating was constructed in various phases. For other buildings (TR5, TR11), the
the data completeness. Once the Json data formatting had been evalu attribute is “continuous”.
ated, the value of the transferred data is checked to meet data The BN results (condition of the building elements and systems) were
completeness. If the value for data is missing, it should be presented visualized in the BIM model (Fig. 12) by the proposed system architec
either as empty (“”) or a null value in the Json file. Therefore, the Json ture and compared with those obtained using the AgenaRisk in which
file is parsed using the json.load() method in Spyder [70]. The Python data are introduced manually. The system architecture showed the same
script is then used to check whether the value for each data is empty results as the existing manual method but in a user-friendly way,
(null) or not. allowing the FM team to quickly identify problems in buildings. Besides,
The benefits of using the proposed system architecture (task effi 54 different scenarios for all three buildings (i.e., 18 scenarios for each
ciency analysis) were analyzed in terms of time reduction in comparison building) were simulated in the proposed system architecture and the
with the manual method. The advantages of the visualization in terms of existing manual method. After running all these scenarios, the results in
intuitiveness were discussed. both methods were the same and thus confirmed the data consistency.
All buildings were maintained by the same Facility Management Regarding the task efficiency analysis, the same approach as Kang
company. Therefore, all have the same maintenance protocols. TR5 was and Hong [56] was used in this study. To achieve this, two tasks were
constructed in 1960, it has five floors with 11,492 m2; TR11 was built in classified as follows. (1) BIM Data Transfer Process (BDTP), which
1997 and has 4 floors with a total area of 2779 m2; and TR 14 was built transfers data from the BIM into the BN model. (2) Mapping BN results
in 2011 and is a six-story building with one parking lot and 7378 m2. into BIM (MBB), which imports the BN assessment results into the BIM
Both TR5 and TR11 have a reinforced concrete structure, flat roofs model to visualize a building’s condition. Then, each task was timed and
and masonry façades, while TR14 has a metal panel façade. Regarding compared with the others listed in Table 3.
HVAC in TR5, most classrooms and offices have radiators, air-water The time for performing the “BDTP” task, which is known as the most
systems and multi splits while TR14 is heated and cooled by fan coils, time-consuming, decreased nearly 100% in all buildings when the pro
one chiller and two boilers. In TR11, there is no cooling system at all, posed system architecture was used. This shows the importance of
and the ventilation is only natural, by opening windows. automation of data transfer. In general, using the existing manual
To run the proposed system architecture, many parameters were method, it took 39.5 h for TR5, 31.7 h for TR11 and 24.8 h for TR14 to
10H. Alavi et al. Automation in Construction 135 (2022) 104117
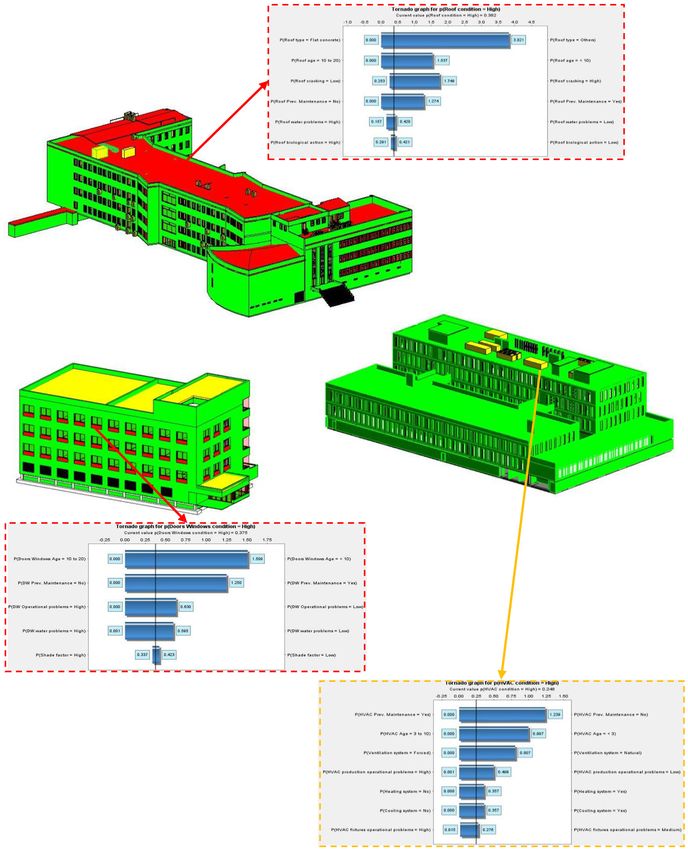
Fig. 12. The visualization of building conditions and causality analysis results.
perform “BDTP” and “MBB” tasks. When the system architecture was
Table 3
used, the same task took 0.95 h, 0.9 h and 0.8 h for each building
Task efficiency analysis.
respectively to check that all algorithms were running correctly.
Building Task Time to perform each task (minutes [hours]) Regarding data completeness, the results from a Json validator
AgenaRisk Proposed system architecture showed that the Json data (containing BIM data) formatting was correct
(manual) (automated) and there was no incorrect Json syntax or missing data. Once the Json
TR5 BDTP 1845 (30.7) 44 (0.7) data formatting was found to be correct, the value of the transferred data
MBB 530 (8.8) 15 (0.25) was checked to meet the data completeness criterion. To achieve this,
TR11 BDTP 1390 (23.2) 40 (0.7) the Python script was used for all 54 scenarios. The results demonstrated
MBB 510 (8.5) 13 (0.2)
TR14 BDTP 1000 (16.6) 37 (0.6)
that there were 1728 data items, all of which had a specific value,
MBB 495 (8.2) 10 (0.2) explaining that data from the BIM model were transferred to the BN
model completely without losing data.
11H. Alavi et al. Automation in Construction 135 (2022) 104117
With regard to the transfer of the assessment results of a building’s to improve maintenance activities and support decision-making, extend
condition to the BIM model, the same approach was applied. Firstly, the the lifespan of building elements or systems and increase building
Json data formatting was checked for the Json file containing the results durability. Besides, it enables the FM team to address the challenges of
of the building condition assessments, which were correct. Secondly, the information reliability, interoperability, usability and minimization of
Python script revealed that none of the values were empty (null). Be labor time. The data model can be applied to any building typology and
sides, if a value is missing, the Dynamo will report an error while it runs is very relevant because its application allows the assessment of building
for the visualization. Hence, it was concluded that the process of data conditions in a semi-automated way.
transfer from the BN model to the BIM model was also performed The method of visualization in this approach focuses on the condi
properly and showed no data loss. tion of building elements and systems, which is demonstrated on a color
The visualization of the condition of the elements and systems from scale where red indicates urgency in building elements and systems
the campus buildings facilitated prioritization of investments in build intervention, yellow indicates deteriorating performance condition, and
ings. In the case of the three campus buildings, the roof from TR5 was green indicates satisfactory condition of the building elements and
found to require renovation and thus prioritization. Furthermore, the BN systems. This visualization makes it possible to detect the condition of
results allowed an evaluation of the causal factors of the condition of the current building elements and systems more intuitively, and potentially
elements, using sensitivity analysis. The length of the bars is a measure makes it easier to deal with the problem. This will result in a consider
of the influence of parameters on the building condition assessment. able improvement in building performance. Overall, the workflow for
Therefore, the FM team can evaluate the most probable cause of those the FM team to use the system architecture is:
building elements/systems associated with poor condition to implement
corrective actions and plan future preventive measures. • Run the system architecture in all buildings managed by the FM
From a sensitivity analysis of the TR5 roof, cracks in the tiles due to company
age and a lack of preventive actions were found to be the main causes of • Visualize the condition of the building elements/systems for those
this poor condition. Substituting tiles, painting them with a waterproof buildings
coating to avoid efflorescence and sealing them were found to be • Check sensitivity analysis to determine the most probable causes for
appropriate corrective actions for the poor roof condition, while peri the building elements/systems with low-performance condition
odic inspections of roof tiles (cracked or chipped tiles) and replacement • Make corrective action plans
when necessary were implemented as preventive maintenance actions. • Propose preventive maintenance plans
There are some limitations: (1) the condition risk assessment model
6.2. Software verification
based on BN was developed to evaluate and prioritize building reno
vations managed by big facility management companies. The approach
Based on the case study results, the technical efforts were evaluated
of this condition risk assessment considers different elements (façade,
using the six criteria developed by Tang et al. [71]. (1) Degree of
interior partitions, etc.) and systems (plumbing, HVAC, etc.) in each
automation: the process of integrating BIM and BN is semi-automated.
building as entities. Therefore, the data model to integrate the BIM and
The first step of parameter creation, assigning the type of parameters
the BN was based on these assumptions. Further analysis can adapt this
and their families, was done manually, while the rest of the process was
condition risk assessment model to other functionalities. (2) The meth
automated. (2) Required input & output assumptions: the required in
odology is semi-automated. Hence, an end-user is recommended be
puts are stored in the BIM model. These can be semantic information
tween each step of extraction to ensure that the exported files are stored
that is necessary for the BN model to run and assess building condition.
in the right location with the correct names. For instance, the Python
(3) Computational complexity: the computational complexity of the
scripts used in the BIM model can only read the exported file (e.g., BN
model is low and the process can be executed on standard performance
results), which is matched with its name and location.
computers. The model is highly adaptable and requires only some
Future work could extend the model further using industry 4.0
modification if the size of the data or the number of element types in
technologies, sensor-based systems, AI, IoT, BIM, and other technologies
creases. (4) Extensibility to new environments: the data model can be
together to create a fully integrated and automated solution. It could
applied to different types of environments and is not specific to one or a
also move further still towards dark factory environments where a
certain class of spaces. (5) Learning capabilities: although the BN model
building is controlled by robots without any human intervention.
can learn from data to improve its performance when it develops, there
is no learning element in it. (6) Uncertainty modelling: one of the ad
vantages of integrating the BIM and BN model is that the BN model can Declaration of Competing Interest
deal with uncertainty. Due to the wide range of elements that may
impact a building’s condition, there are varying degrees of uncertainty. The authors declare that they have no known competing financial
As a result, evaluating the performance of a building’s condition re interests or personal relationships that could have appeared to influence
quires the examination of many factors in the presence of uncertainty. the work reported in this paper.
7. Conclusions Acknowledgments
The data model allows interoperability between the BIM and BN This work was supported by Agència de Gestió d’Ajuts Universitaris i
model to evaluate building elements and systems. The proposed system de Recerca (AGAUR) from Generalitat de Catalunya under Grant 2019
architecture automatizes the data workflows to increase the use effi FI_B00064.
ciency of the BN model, reducing the time and effort that the FM team
spends on manual input. Enabling interoperability between BIM and the Appendix A. Appendix
BN model allows transformation of the data into an appropriate format
automatically to run the BN model. Automating data transfer enables the
FM team to take advantage of the BN model in favor. Thus, the FM team
could use the proposed system architecture to prioritize the work order
12H. Alavi et al. Automation in Construction 135 (2022) 104117
13H. Alavi et al. Automation in Construction 135 (2022) 104117
References [26] B. Dong, Z. O’Neill, Z. Li, A BIM-enabled information infrastructure for building
energy fault detection and diagnostics, Autom. Constr. 44 (2014) 197–211,
https://doi.org/10.1016/j.autcon.2014.04.007.
[1] R. Sacks, C. Eastman, G. Lee, P. Teicholz, BIM Handbook, John Wiley & Sons, Inc,
[27] Ö. Göçer, Y. Hua, K. Göçer, A BIM-GIS integrated pre-retrofit model for building
Hoboken, New Jersey, 2018, https://doi.org/10.1002/9781119287568 (ISBN:
data mapping, Build. Simul. 9 (2016) 513–527, https://doi.org/10.1007/s12273-
9781119287568).
016-0293-4.
[2] W. Chen, K. Chen, J.C.P. Cheng, Q. Wang, V.J.L. Gan, BIM-based framework for
[28] J. Zhou, P.E.D. Love, J. Matthews, B. Carey, C.P. Sing, Object-oriented model for
automatic scheduling of facility maintenance work orders, Autom. Constr. 91
life cycle management of electrical instrumentation control projects, Autom.
(2018) 15–30, https://doi.org/10.1016/j.autcon.2018.03.007.
Constr. 49 (2015) 142–151, https://doi.org/10.1016/j.autcon.2014.10.008.
[3] J.K.W. Wong, J. Ge, S.X. He, Digitisation in facilities management: a literature
[29] R. Marmo, F. Polverino, M. Nicolella, A. Tibaut, Building performance and
review and future research directions, Autom. Constr. 92 (2018) 312–326, https://
maintenance information model based on IFC schema, Autom. Constr. 118 (2020),
doi.org/10.1016/j.autcon.2018.04.006.
103275, https://doi.org/10.1016/j.autcon.2020.103275.
[4] H.B. Gunay, W. Shen, C. Yang, Text-mining building maintenance work orders for
[30] BuildingSMART Team, Model View Definitions (MVD) - buildingSMART
component fault frequency, Build. Res. Inf. 47 (2019) 518–533, https://doi.org/
International. https://www.buildingsmartusa.org/standards/bsi-standards/mod
10.1080/09613218.2018.1459004.
el-view-definitions-mvd/, 2020 (accessed November 22, 2021).
[5] N.A. Garyaev, F. Ayoub, Towards building information modelling for diagnosis,
[31] E. William East, N. Nisbet, T. Liebich, Facility management handover model view,
assessment and rehabilitation automation for existing buildings, in: Journal of
J. Comput. Civ. Eng. 27 (2013) 61–67, https://doi.org/10.1061/(asce)cp.1943-
Physics: Conference Series, Institute of Physics Publishing, 2020, p. 12121, https://
5487.0000196.
doi.org/10.1088/1742-6596/1425/1/012121.
[32] W. Thabet, J. Lucas, S. Johnston, A case study for improving BIM-FM handover for
[6] R. Bortolini, N. Forcada, Analysis of building maintenance requests using a text
a large educational institution, in: Construction Research Congress 2016: Old and
mining approach: building services evaluation, Build. Res. Inf. 48 (2020) 207–217,
New Construction Technologies Converge in Historic San Juan - Proceedings of the
https://doi.org/10.1080/09613218.2019.1609291.
2016 Construction Research Congress, CRC 2016, 2016, pp. 2177–2186, https://
[7] I. Flores-Colen, J. De Brito, A systematic approach for maintenance budgeting of
doi.org/10.1061/9780784479827.217.
buildings facades based on predictive and preventive strategies, Constr. Build.
[33] P. Dias, S. Ergan, The need for representing facility information with customized
Mater. 24 (2010) 1718–1729, https://doi.org/10.1016/j.
LOD for specific FM tasks, in: Construction Research Congress 2016: Old and New
conbuildmat.2010.02.017.
Construction Technologies Converge in Historic San Juan - Proceedings of the 2016
[8] S. Yacob, A.S. Ali, A.Y.C. Peng, Building condition assessment: Lesson learnt from
Construction Research Congress, CRC 2016, 2016, pp. 2563–2572, https://doi.
pilot projects, in: MATEC Web of Conferences, EDP Sciences, 2016, p. 00072,
org/10.1061/9780784479827.255.
https://doi.org/10.1051/matecconf/20166600072.
[34] B. Becerik-Gerber, F. Jazizadeh, N. Li, G. Calis, Application areas and data
[9] L.G. Neuberg, in: Judea Pearl (Ed.), Causality: Models, Reasoning, and Inference
requirements for BIM-enabled facilities management, J. Constr. Eng. Manag. 138
19, Cambridge University Press, 2003, pp. 675–685, https://doi.org/10.1017/
(2012) 431–442, https://doi.org/10.1061/(ASCE)CO.1943-7862.0000433.
s0266466603004109, 2000, Econometric Theory.
[35] K. Kim, H. Kim, W. Kim, C. Kim, J. Kim, J. Yu, Integration of ifc objects and facility
[10] L.D. Nguyen, D.Q. Tran, M.P. Chandrawinata, Predicting safety risk of working at
management work information using Semantic Web, Autom. Constr. 87 (2018)
heights using Bayesian networks, J. Constr. Eng. Manag. 142 (2016) 04016041,
173–187, https://doi.org/10.1016/j.autcon.2017.12.019.
https://doi.org/10.1061/(ASCE)CO.1943-7862.0001154.
[36] A. Gouda Mohamed, M.R. Abdallah, M. Marzouk, BIM and semantic web-based
[11] S. Lee, I. Bilionis, P. Karava, A. Tzempelikos, A Bayesian approach for probabilistic
maintenance information for existing buildings, Autom. Constr. 116 (2020),
classification and inference of occupant thermal preferences in office buildings,
103209, https://doi.org/10.1016/j.autcon.2020.103209.
Build. Environ. 118 (2017) 323–343, https://doi.org/10.1016/j.
[37] J.C.P. Cheng, W. Chen, K. Chen, Q. Wang, Data-driven predictive maintenance
buildenv.2017.03.009.
planning framework for MEP components based on BIM and IoT using machine
[12] J. Langevin, J. Wen, P.L. Gurian, Modeling thermal comfort holistically: Bayesian
learning algorithms, Autom. Constr. 112 (2020), 103087, https://doi.org/
estimation of thermal sensation, acceptability, and preference distributions for
10.1016/j.autcon.2020.103087.
office building occupants, Build. Environ. 69 (2013) 206–226, https://doi.org/
[38] W. Shen, Q. Hao, Y. Xue, A loosely coupled system integration approach for
10.1016/j.buildenv.2013.07.017.
decision support in facility management and maintenance, Autom. Constr. 25
[13] R. Bortolini, N. Forcada, A probabilistic performance evaluation for buildings and
(2012) 41–48, https://doi.org/10.1016/j.autcon.2012.04.003.
constructed assets, Build. Res. Inf. 0 (2019) 1–18, https://doi.org/10.1080/
[39] A. Motamedi, A. Hammad, Y. Asen, Knowledge-assisted BIM-based visual analytics
09613218.2019.1704208.
for failure root cause detection in facilities management, Autom. Constr. 43 (2014)
[14] C.J. Roberts, D.J. Edwards, M.R. Hosseini, M. Mateo-Garcia, D.G. Owusu-Manu,
73–83, https://doi.org/10.1016/j.autcon.2014.03.012.
Post-occupancy evaluation: a review of literature, Eng. Constr. Archit. Manag. 26
[40] A. Golabchi, M. Akula, V. Kamat, Automated building information modeling for
(2019) 2084–2106, https://doi.org/10.1108/ECAM-09-2018-0390.
fault detection and diagnostics in commercial HVAC systems, Facilities 34 (2016)
[15] H.B. Cavka, S. Staub-French, E.A. Poirier, Developing owner information
233–246, https://doi.org/10.1108/F-06-2014-0050.
requirements for BIM-enabled project delivery and asset management, Autom.
[41] F. Shalabi, Y. Turkan, IFC BIM-based facility management approach to optimize
Constr. 83 (2017) 169–183, https://doi.org/10.1016/j.autcon.2017.08.006.
data collection for corrective maintenance, J. Perform. Constr. Facil. 31 (2017)
[16] H. Alavi, N. Forcada, R. Bortolini, D.J. Edwards, Enhancing occupants’ comfort
04016081, https://doi.org/10.1061/(asce)cf.1943-5509.0000941.
through BIM-based probabilistic approach, Autom. Constr. 123 (2021), 103528,
[42] A. Papapostolou, H. Chaouchi, RFID-assisted indoor localization and the impact of
https://doi.org/10.1016/j.autcon.2020.103528.
interference on its performance, J. Netw. Comput. Appl. 34 (2011) 902–913,
[17] A. Carbonari, A. Corneli, G.M. Di Giuda, L. Ridolfi, V. Villa, A decision support
https://doi.org/10.1016/j.jnca.2010.04.009.
system for multi-criteria assessment of large building stocks, J. Civ. Eng. Manag. 25
[43] S.H. Wang, W.C. Wang, K.C. Wang, S.Y. Shih, Applying building information
(2019) 477–494, https://doi.org/10.3846/jcem.2019.9872.
modeling to support fire safety management, Autom. Constr. 59 (2015) 158–167,
[18] A. Carbonari, A. Giretti, A. Corneli, V. Villa, G. Di Giuda, Decision support tool for
https://doi.org/10.1016/j.autcon.2015.02.001.
multi-criteria analyses of the quality of large building stock, in: ISARC 2017 -
[44] M.Y. Cheng, K.C. Chiu, Y.M. Hsieh, I.T. Yang, J.S. Chou, Y.W. Wu, BIM integrated
Proceedings of the 34th International Symposium on Automation and Robotics in
smart monitoring technique for building fire prevention and disaster relief, Autom.
Construction, International Association for Automation and Robotics in
Constr. 84 (2017) 14–30, https://doi.org/10.1016/j.autcon.2017.08.027.
Construction I.A.A.R.C, 2017, pp. 22–29, https://doi.org/10.22260/isarc2017/
[45] Y.J. Chen, Y.S. Lai, Y.H. Lin, BIM-based augmented reality inspection and
0003.
maintenance of fire safety equipment, Autom. Constr. 110 (2020), 103041, https://
[19] X. Gao, P. Pishdad-Bozorgi, BIM-enabled facilities operation and maintenance: a
doi.org/10.1016/j.autcon.2019.103041.
review, Adv. Eng. Inform. 39 (2019) 227–247, https://doi.org/10.1016/j.
[46] G. Zimmermann, Y. Lu, G. Lo, Automatic HVAC fault detection and diagnosis
aei.2019.01.005.
system generation based on heat flow models, in: HVAC and R Research, 2012,
[20] S.H. Alavi, N. Forcada, BIM LOD for facility management tasks, in: Proceedings of
pp. 112–125, https://doi.org/10.1080/10789669.2011.610427.
the 2019 European Conference for Computing in Construction, University College
[47] X. Yang, S. Ergan, Leveraging BIM to provide automated support for efficient
Dublin, 2019, pp. 154–163, https://doi.org/10.35490/ec3.2019.187.
troubleshooting of HVAC-related problems, J. Comput. Civ. Eng. 30 (2016)
[21] A. Corneli, S. Meschini, V. Villa, G.M. Di Giuda, A. Carbonari, A decision support
04015023, https://doi.org/10.1061/(asce)cp.1943-5487.0000492.
system for the multicriteria analysis of existing stock, in: Procedia Engineering,
[48] H. Wang, Y. Pan, X. Luo, Integration of BIM and GIS in sustainable built
Elsevier Ltd, 2017, pp. 682–689, https://doi.org/10.1016/j.proeng.2017.08.058.
environment: a review and bibliometric analysis, Autom. Constr. 103 (2019)
[22] R. Matos, F. Rodrigues, H. Rodrigues, A. Costa, Building condition assessment
41–52, https://doi.org/10.1016/j.autcon.2019.03.005.
supported by building information modelling, J. Build. Eng. 38 (2021), 102186,
[49] J.J. McArthur, A building information management (BIM) framework and
https://doi.org/10.1016/j.jobe.2021.102186.
supporting case study for existing building operations, maintenance and
[23] F. Auffenberg, S. Snow, S. Stein, A. Rogers, A comfort-based approach to smart
sustainability, Proc. Eng. 118 (2015) 1104–1111, https://doi.org/10.1016/j.
heating and air conditioning, ACM Trans. Intell. Syst. Technol. 9 (2017) 1–20,
proeng.2015.08.450.
https://doi.org/10.1145/3057730.
[50] T. Gerrish, K. Ruikar, M. Cook, M. Johnson, M. Phillip, C. Lowry, BIM application
[24] Y. Zhao, J. Wen, F. Xiao, X. Yang, S. Wang, Diagnostic Bayesian networks for
to building energy performance visualisation and management challenges and
diagnosing air handling units faults – part I: faults in dampers, fans, filters and
potential, Energ. Build. 144 (2017) 218–228, https://doi.org/10.1016/j.
sensors, Appl. Therm. Eng. 111 (2017) 1272–1286, https://doi.org/10.1016/j.
enbuild.2017.03.032.
applthermaleng.2015.09.121.
[51] A. Galiano-Garrigós, A. García-Figueroa, C. Rizo-Maestre, Á. González-Avilés,
[25] R. Jang, W. Collinge, Improving BIM asset and facilities management processes: a
Evaluation of BIM energy performance and CO2 emissions assessment tools: a case
Mechanical and Electrical (M&E) contractor perspective, J. Build. Eng. 32 (2020)
study in warm weather, Build. Res. Inf. 47 (2019) 787–812, https://doi.org/
101540, https://doi.org/10.1016/j.jobe.2020.101540.
10.1080/09613218.2019.1620093.
14You can also read