Back-to-School (BTS) insights for the fall of 2021 - Microsoft Advertising Insights
←
→
Page content transcription
If your browser does not render page correctly, please read the page content below
Microsoft Advertising Insights

Back-to-School
(BTS) insights for
the fall of 2021

Microsoft Advertising. Intelligent connections.

1   Market news

Agenda   2   Shopper outlooks

         3   Categorical trends

         4   Audience trends

         5   Checklist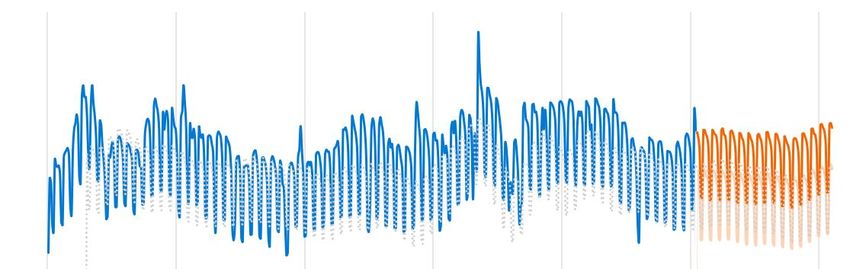
Market news
COVID’s impact on U.S. schools is beginning to lessen

                    Early            • 8/17 – only 4 states (TX, FL, IA,                                          • 5/13 – CDC announced that
                                       AR) mandated in-person                                                       fully vaccinated individuals do
                    2020                                                                Early
                                       learning at start of fall                                                    not have to wear a mask
                                       semester or new 2020-2021                        2021                        indoors or outdoors.
                                       school year.                                                               • 5/30 – 51% of U.S. adults and
                                     • 10/5 – hybrid learning                                                       40% of entire U.S.
• 3/11 – World Health
                                       dominated.                                                                   population fully vaccinated.
  Organization declared COVID-                                             • 2/27 – FDA gave J&J
                                     • 12/11 – FDA gave Pfizer                                                    • 6/4– Big box retail stores shift
  19 a pandemic.                                                             emergency use authorization.
                                       emergency use authorization.                                                 their promotional dates.
• 3/16 – more than half of all                                             • 3/2 – declaration of educators
                                     • 12/14 – vaccine distribution
  students in the U.S. had been                                              as essential service to prioritize
                                       began.
  impacted by school closures.                                               them getting vaccinated.
                                     • 12/18 – FDA gave Moderna
• 3/25 – All U.S. public school                                            • 4/19 – vaccine eligibility
                                       emergency use authorization.
  buildings closed.                                                          opened to 16-years-old & up.
• 5/6 – All but 2 states, WY and                                           • 5/10 – FDA expanded Pfizer
  MT, closed their schools for the                                           vaccine’s emergency use                           Most
  remainder of the 2019-2020                                                 authorization to include 12–
  school year.                                     Late                      15-year-olds.
                                                                                                                              Recent
                                                   2020
  Source: Multiple news sources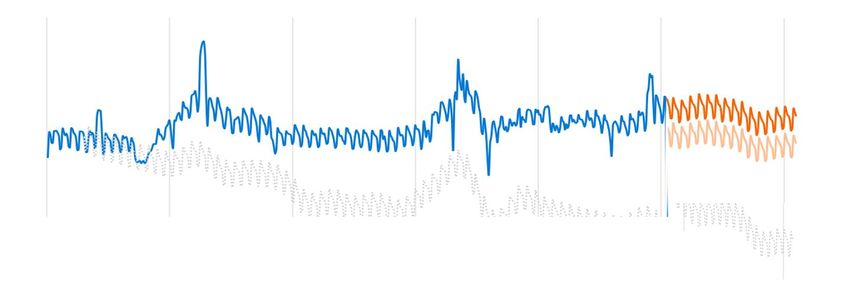
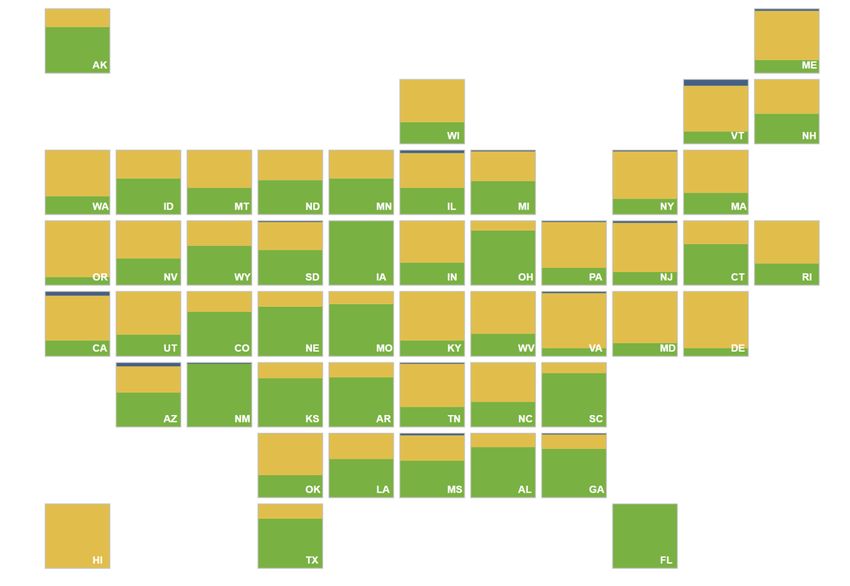
With encouraging COVID-19 numbers, schools are
       planning to return to in-person this fall
       % of schools by state by current operating status (fully remote, hybrid, fully in-
       person)₁

                                                                                                                                   K – 12 public schools:
                                                                                                                                   Expected to go back to in-person
                                                                                                                                   learning for the 2021-2022 academic
                                                                                                                                   year, following the announcement of
                                                                                                                                   plans for two of the largest K-12
                                                                                                                                   public school districts in the country
                                                                                                                                   (LA and NYC) to return full-time to in-
                                                                                                                                   person learning this August.₂

                                                                                                                                   **Due to the paid nature of daycares,
                                                                                                                                   colleges, universities, and private
                                                                                                                                   institutions, nearly all had already resumed
                                                                                                                                   in-person operations in early 2021 and plan
                                                                                                                                   to continue to do so.

Sources: ₁ www.returntolearntracker.com from 5/10/2021
        ₂ Washington Post ‘America’s largest school systems announce full-time return to in-person learning this fall’ 5.24.2021
Expect a bigger college crowd post COVID-19

       % of high school seniors who applied to college for the 2020-21 school year

                                                                                                                                              Admissions stop requiring SAT or ACT:
                                                                                                                                              More college students are expected to
                                        Did not enroll,                                                                                       enroll this fall, which may be partially due
                                             22%
                                                                                                                                              to standardized testing becoming
                                                                                                                                              optional. The University of Texas reported
                                                                                                                                              a 23% YoY increase from 2019-2020
                                                                                                                                              compared to 2021-2022 in the number of
                                                                                           Kept plans,                                        applications received for the
                                                                                              55%                                             upcoming school year.₂
                                  Enrolled but
                                 changed plans,
                                     23%
                                                                                                                                              Start requiring COVID-19 vaccinations:
                                                                                                                                              At of 5/22/2021, 10% of the nation’s
                                                                                                                                              colleges and universities are requiring
                                                                                                                                              COVID-19 vaccinations.₃

Sources: ₁ National Association for College Admission Counseling
         ₂ National Student clearinghouse/community impact newspaper, May 2021
         ₃ For Colleges, Coronavirus Vaccine Mandates Often Depend on Which Party Is in Power - The New York Times (nytimes.com), 5.22.2021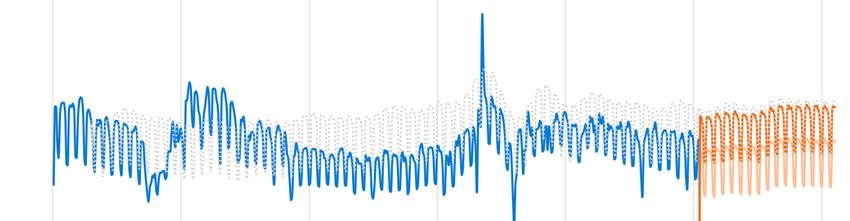
Popularity and convenience of eCommerce and “buy-
       online-pickup-in-store” (BOPIS) to continue for BTS

                         Retail eCommerce BTS U.S. Sales₁                        BOPIS Retail Sales in the U.S.₂

  2016                                      $20B                          2018              $23B

  2017                                         $22B                       2019                     $37B

                                                                         2020                                 $59B
  2018                                             $26B

                                                                        2021**                                     $65B
  2019                                                    $30B

                                                                        2022**                                            $74B
  2020                                                           $38B

Sources: ₁ eMarketer September 2020
         ₂ eMarketer May 2021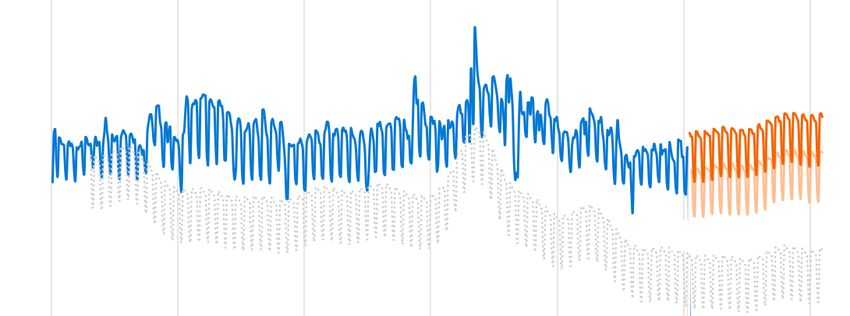
BTS shopper outlooks
Elevated BTS activity is evident as
students, teachers, and parents/
guardians have resumed, or plan to
start the 2021-2022 academic year,
in-person.1

Our relevant 1st party audiences
collectively grew 6.7% MoM.2

Audience Network click volume for BTS
categories increased 21.1% MoM.2

Sources:
1.  “Return to Learn Tracker” Change in Instructional Status, 10 May 2021, www.returntolearntracker.net. Accessed 10 May 2021
2.  Microsoft internal data; Mar. 2021 vs. Feb. 2021 (MoM= month-over-month)
Almost half of BTS shoppers plan to shop earlier this year

       % of surveyed respondents on when they intend to start                                                                        % of surveyed respondents on when they plan to start
       BTS shopping compared to previous years                                                                                       BTS shopping this year

          Haven't shopped before                        2%                                                                                            Don't know yet    2%

                                                                                                                                                  More than 2 months    4%
     Significantly or slightly later                       5%                                                                                                                            26% > 1 month
                                                                                                                                                   1-2 months before              22%
             Around the same time                                                                               50%
                                                                                                                                                    2-4 weeks before                        40%

                          Slightly earlier                                       24%
                                                                                                                                                     1-2 weeks before              24%
                                                                                                  42%
                   Significantly earlier                                  18%                                                            Week before school starts           8%

Source: Microsoft commissioned online survey taken 5.4-5.10.2021 of 1,021 U.S. respondents who are back-to-school shopping as a parent/guardian
Anticipate promotions and out-of-stock concerns to
drive BTS sales for those shopping earlier
% of surveyed respondents on when they intend to start
BTS shopping compared to previous years
Haven't shopped before 2%
Significantly or slightly later 5%
“Because last year I started to close to school starting and
everything I needed was almost out of stock or gone
Around the same time 50% already”
Slightly earlier 24%
“I am planning on shopping earlier because there is a
Significantly earlier 18% pandemic”
Source: Microsoft commissioned online survey taken 5.4-5.10.2021 of 1,021 U.S. respondents who are back-to-school shopping as a parent/guardian44% of BTS shoppers intend to spend more than last year
% of surveyed respondents on what they intend to % of surveyed respondents on how much they plan to
spend on BTS shopping compared to previous years spend on BTS shopping this year
Significantly higher 13% $1,000 or more 19%
44%
Slightly higher 31% $700-$1,000 12%
About the same 51% $500-$700 19%
Slightly lower 4% $300-$500 27%
Significantly lower 1% Under $300 23%
Source: Microsoft commissioned online survey taken 5.4-5.10.2021 of 1,021 U.S. respondents who are back-to-school shopping as a parent/guardianThe increase in spending is likely due to a longer-than-
usual shopping list of BTS items
Almost all shoppers intend to buy
% of surveyed respondents on what BTS items they intend to buy this year
wearables such as clothing, shoes,
backpacks, and hygiene products.
Writing materials 85%
Clothing and/or shoes 85% Majority of shoppers will also be
Backpacks 75% buying general office materials items
like pens, paints, lunch boxes, and
Hygiene products 73%
water bottles.
Art/craft supplies 70%
Lunch boxes/water bottles 62% Education’s digital dependency seen
Headphones/earphones/headsets 40% as multiple devices like computers
Computers/electronics 33%
and phones make the list.
Virtual/online learning resources 25%
1 in 4 looking for learning resources.
Locker décor 24%
Office/learning space furniture 21% Over 20% need furnishings for their
Cell phone 12% own learning spaces.
Other 1%
Source: Microsoft commissioned online survey taken 5.4-5.10.2021 of 1,021 U.S. respondents who are back-to-school shopping as a parent/guardianBTS categorical trends
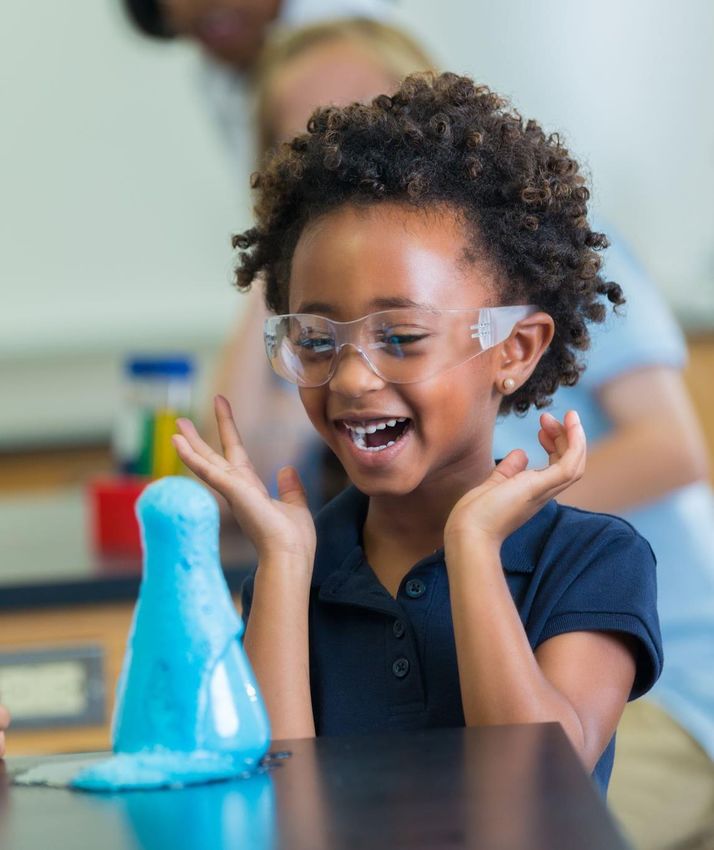
Personal care and beauty products demand to
       rebound back to normal this BTS season

       Beauty & Personal Care

                                                                                                                                                                                 YoY May-
                                                                                                                                                                                   Sept     Least Most
                                                                                                                                                                                   clicks
                                                                                                                                                                                vs No COVID -28% -30%
                                                                                                                                                                                  vs 2020   41%   55%
                                                                                                                                                                                  vs 2019   21%   34%

               Blue solid line shows actual click volume.
               Grey dotted line is our click volume forecast without the effect of COVID-19 and what would have been “normal” seasonality.
               Dark orange solid line is our most optimistic forecast of click volume factoring in COVID-19 case data and sensitivity to its past relationship with volume.
               Light orange solid line is our least optimistic forecast of click volume factoring in COVID-19 case data and sensitivity to its past relationship with volume.

Source: Microsoft internal data from 2018-2021; U.S. only
No matter grade level, computers vastly needed
amongst shoppers
Computers
YoY May-
Sept Least Most
Clicks
vs No COVID 35% 66%
vs 2020 -1% 23%
vs 2019 -6% 15%
Blue solid line shows actual click volume.
Grey dotted line is our click volume forecast without the effect of COVID-19 and what would have been “normal” seasonality.
Dark orange solid line is our most optimistic forecast of click volume factoring in COVID-19 case data and sensitivity to its past relationship with volume.
Light orange solid line is our least optimistic forecast of click volume factoring in COVID-19 case data and sensitivity to its past relationship with volume.
Source: Microsoft internal data from 2018-2021; U.S. onlyTablet devices are an item which BTS shoppers will be
more likely to buy this year
Consumer Electronics
YoY May-
Sept Least Most
Clicks
vs No COVID 57% 92%
vs 2020 -12% 41%
vs 2019 10% 29%
Blue solid line shows actual click volume.
Grey dotted line is our click volume forecast without the effect of COVID-19 and what would have been “normal” seasonality.
Dark orange solid line is our most optimistic forecast of click volume factoring in COVID-19 case data and sensitivity to its past relationship with volume.
Light orange solid line is our least optimistic forecast of click volume factoring in COVID-19 case data and sensitivity to its past relationship with volume.
Source: Microsoft internal data from 2018-2021; U.S. onlyFurniture from desks to chairs continue to have high demand
Furniture
YoY May-
Sept Least Most
Clicks
No COVID 111% 130%
vs 2020 87% 96%
vs 2019 61% 70%
Blue solid line shows actual click volume.
Grey dotted line is our click volume forecast without the effect of COVID-19 and what would have been “normal” seasonality.
Dark orange solid line is our most optimistic forecast of click volume factoring in COVID-19 case data and sensitivity to its past relationship with volume.
Light orange solid line is our least optimistic forecast of click volume factoring in COVID-19 case data and sensitivity to its past relationship with volume.
Source: Microsoft internal data from 2018-2021; U.S. onlyWhether decorating for dorms or home school, décor
continues to outpace pre-COVID levels
Home Décor
YoY May-
Sept Least Most
Clicks
vs No COVID 103% 132%
vs 2020 82% 79%
vs 2019 34% 41%
Blue solid line shows actual click volume.
Grey dotted line is our click volume forecast without the effect of COVID-19 and what would have been “normal” seasonality.
Dark orange solid line is our most optimistic forecast of click volume factoring in COVID-19 case data and sensitivity to its past relationship with volume.
Light orange solid line is our least optimistic forecast of click volume factoring in COVID-19 case data and sensitivity to its past relationship with volume.
Source: Microsoft internal data from 2018-2021; U.S. onlyMaximizing space concerns among students in dorms and hybrid or
full-time home schoolers raise organization needs
Home Storage & Organization
YoY May-
Sept Least Most
Clicks
vs No COVID 93% 110%
vs 2020 70% 77%
vs 2019 54% 63%
Blue solid line shows actual click volume.
Grey dotted line is our click volume forecast without the effect of COVID-19 and what would have been “normal” seasonality.
Dark orange solid line is our most optimistic forecast of click volume factoring in COVID-19 case data and sensitivity to its past relationship with volume.
Light orange solid line is our least optimistic forecast of click volume factoring in COVID-19 case data and sensitivity to its past relationship with volume.
Source: Microsoft internal data from 2018-2021; U.S. onlyClothing should rise as schools resumes with uniforms
and jeans becoming more essential
Clothing
YoY May-
Sept Least Most
clicks
vs No COVID -39% -44%
vs 2020 -3% -13%
vs 2019 11% 36%
Blue solid line shows actual click volume.
Grey dotted line is our click volume forecast without the effect of COVID-19 and what would have been “normal” seasonality.
Dark orange solid line is our most optimistic forecast of click volume factoring in COVID-19 case data and sensitivity to its past relationship with volume.
Light orange solid line is our least optimistic forecast of click volume factoring in COVID-19 case data and sensitivity to its past relationship with volume.
Source: Microsoft internal data from 2018-2021; U.S. onlyShoppers look to Apparel & Accessories to return to
school as backpacks and bags are popular items
Apparel & Accessories
YoY May-
Sept Least Most
clicks
vs No COVID -8% -17%
vs 2020 -12% 9%
vs 2019 14% 22%
Blue solid line shows actual click volume.
Grey dotted line is our click volume forecast without the effect of COVID-19 and what would have been “normal” seasonality.
Dark orange solid line is our most optimistic forecast of click volume factoring in COVID-19 case data and sensitivity to its past relationship with volume.
Light orange solid line is our least optimistic forecast of click volume factoring in COVID-19 case data and sensitivity to its past relationship with volume.
Source: Microsoft internal data from 2018-2021; U.S. onlyAudience Trends
Microsoft Audience Network clicks vs. cost-per-click
Audience Network
numbers will climb
further as they have
seen elevated volume.

Click volume across BTS
categories on our Audience
Network has been trending
hot as we enter BTS season.

                              Source: Microsoft internal data; US, Mar. 2020 – Apr. 2021
Audience Network ads drive a lift in performance across
awareness, consideration, and purchase behavior Audience Network
Retail – Department Store/Big Box Ad Effectiveness Study
+3.2x
+3.4x
+4.6x
AWARENESS
CONSIDERATION
CONVERSION
Source: Microsoft internal data; results may vary for each advertiser based on campaign settings, targeted audiences, and other factors. Lift metrics represent an average of all advertisers with completed lift
studies to date (Mar. 2021). These advertisers may be a non-representative sample of all advertisers on the marketplace. Lift measured between exposed users and a control group of eligible unexposed
users, with lift represented on a per-user basis. Average user count per advertiser study = 4.7M.Maximize performance by combining Microsoft Search
and Audience Network strategies Audience Network
Retail – Department Store/Big Box Ad Effectiveness Study
Search
Search Native
Only & Only
Native
2.4x 4.6x
Higher visitation rate Higher conversion rate
Source: Microsoft internal data; results may vary for each advertiser based on campaign settings, targeted audiences, and other factors. Lift metrics represent an average of all advertisers with completed lift
studies to date (Mar. 2021). These advertisers may be a non-representative sample of all advertisers on the marketplace. Lift measured between exposed users and a control group of eligible unexposed
users, with lift represented on a per-user basis. Average user count per advertiser study = 4.7M.BTS summary and checklist
Nationwide, schools have either already reopened or plan to commence the new academic
year in August fully in-person.
     ❑ Budget and plan for eCommerce and BOPIS to be bigger than ever this BTS season as
        these behavioral shifts will endure restrictions easing.

BTS shoppers not only plan to shop earlier this year, they also intend to spend more this year
on BTS items.
    ❑ Anticipate BTS demand to pick up in June and shift promotional timings accordingly.

Audience Network click volume for BTS continues to grow as more users engage with our
premium placements.
    ❑ Target users across both the Audience and Search network to maximize investment.
    ❑ Activate and optimize BTS In-Market audiences for a more targeted reach.

Across the board, BTS forecast trends are positive from footwear to home décor to electronics
to furniture.
     ❑ Optimize by BTS product category trends and continue to remarket throughout the season.
Summary
• Spend on back-to-school shopping could be much different than last year, with 44%
planning to spend more than they did previously. Timings might see a shift as well with 42%
planning to shop earlier than they did previously, likely because of pandemic.
• Shoppers are most influenced by the school provided lists and are focusing mostly on items
such as writing materials, clothing's, backpacks. Hygiene products are also one of the most
sought-after item likely because of the pandemic
• Elementary school shoppers are more likely to shop for bulky furniture items such as sofa,
bookshelves, desk/chairs for their child(ren)’s learning space set-up than others. They are
also significantly more likely to buy tablets than other tablet intenders
• Click volume across BTS categories on our Audience Network has been trending upward as
we enter BTS season, giving advertisers a prime opportunity to the right people in-market
for BTS products.To get actionable data, insights and best practices to help make decisions and grow your business, visit MicrosoftAdvertising.com/Insights
© Copyright Microsoft Corporation. All rights reserved.
You can also read