British Columbia Forage Fish Spawning Survey Methodology for Academics and Qualified Environmental Professionals - Prepared by: Mount Arrowsmith ...
←
→
Page content transcription
If your browser does not render page correctly, please read the page content below
British Columbia Forage Fish Spawning Survey
Methodology for Academics and Qualified
Environmental Professionals

Prepared by: Mount Arrowsmith Biosphere Region Research Institute

May 2018
Revised: July 2021

                                           Page 1 of 86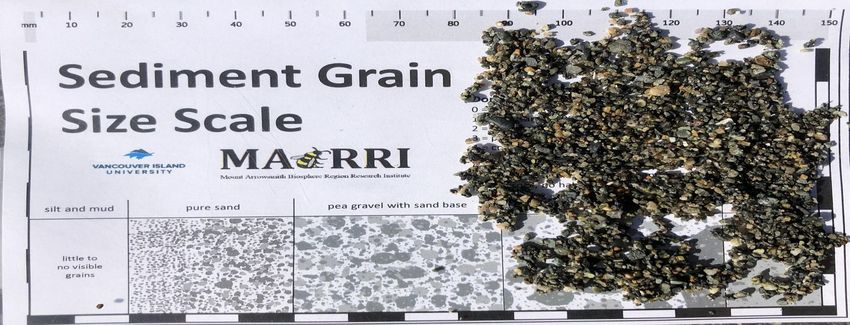
British Columbia Forage Fish Spawning Survey Methodology for Academics and QEPs

TABLE OF CONTENTS

1.0 Material Checklist                                                            4
       1.1 Fieldwork Checklist                                                    4
       1.2 Laboratory Checklist                                                   4
2.0 How to Sample – Step by Step                                                  5 – 12
       2.1 Field Preparation                                                      5
               2.1.1 Determining When to Sample                                   5
               2.1.2 Determining the Mean Low Low Water Mark                      5
       2.2 Site Assessment                                                        5
       2.3 Calculating Tidal Elevation                                            5
       2.4 Filling Out the Forage Fish Habitat Beach Survey Datasheet             6
               2.4.1 Location & High Tide Events                                  6
               2.4.2 Samplers                                                     6
               2.4.3 Current Conditions                                           7
               2.4.4 Episodic Events                                              7
               2.4.5 Site Attributes                                              7
               2.4.6 Sediment Sample Collection                                   8
       2.5 Sample Collection                                                      9
       2.6 Sample Processing                                                      10
               2.6.1 Sieving in the Field                                         10
               2.6.2 Sieving at the Office/Laboratory                             11
               2.6.3 Vortex Method                                                11
3.0 Laboratory Analysis                                                           12 – 17
       3.1 Species                                                                13
               3.1.1 Pacific Sand Lance (Ammodytes personatus)                    13
               3.1.2 Surf Smelts (Hypomesus pretiosus)                            13
               3.1.3 Rock Sole (Lepidopsetta bilinear)                            13
               3.1.4 Pacific Herring (Clupea pallasii)                            14
       3.2 Alive-to-Dead Ratio                                                    14
       3.3 Development Stages                                                     14
               3.3.1 Pacific Herring                                              15
               3.3.2 Surf Smelts                                                  16
       3.4 Embryo Validation Process                                              17
4.0 Data Management                                                               17
5.0 Building a Vortex Method Unit                                                 17 – 19
       5.1 Materials Required                                                     17
               5.1.1 For Construction                                             18
       5.2 Material Preparation                                                   18
               5.2.1 Body of the Vortex                                           18
               5.2.2 Bilge Pump Preparation                                       18
               5.2.3 Blue Bowl Concentrator Preparation                           19
       5.3 Assembly                                                               19
6.0 How to Use a Clinometer                                                       20
7.0 Best Practices                                                                21 – 27
       7.1 Identifying Suitable Sediment                                          21
               7.1.1 Suitable Sediment: Pacific sand lance                        22
                                                Page 2 of 86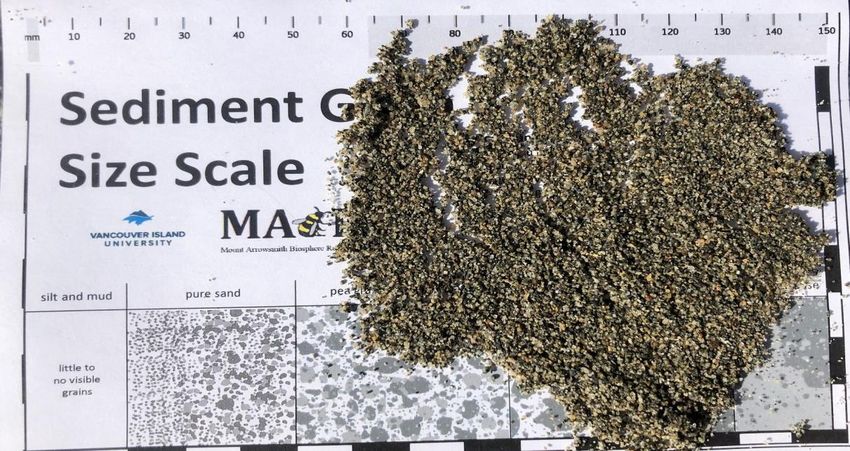
British Columbia Forage Fish Spawning Survey Methodology for Academics and QEPs

              7.1.2 Suitable Sediments: Surf Smelt                                23
              7.1.3 Unsuitable Sediments                                          24
       7.2 Forage Fish Sampling Methods                                           25
       7.3 Sample Processing                                                      25
       7.4 Laboratory Analysis                                                    26
       7.5 How to Safely Use Stockard’s Solution                                  27
8.0 References                                                                    28

Appendix I – Forage Fish Sampling: Location Codes                                 29 – 63
Appendix II – Fisheries and Oceans Canada (DFO) Management Areas                  64 – 86

                                             Page 3 of 86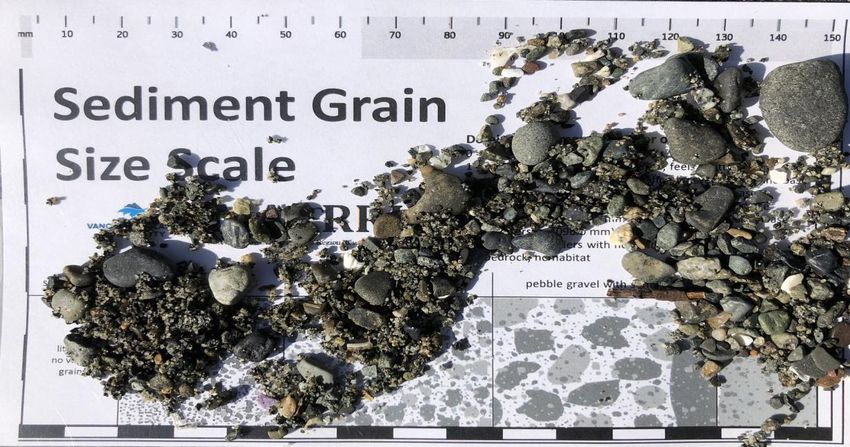
British Columbia Forage Fish Spawning Survey Methodology for Academics and QEPs

1.0 MATERIAL CHECKLIST

1.1 Fieldwork Checklist                               Sample Processing Continued
Sample Collection                                     Vortex Process
□ Data sheets/clipboard                               □ 68 litre tote
□ Location codes document                             □ Bilge pump with hose and quick connectors
□ CHS map of sample area                              □ Nylon stocking and an elastic
□ Pencils                                             □ Blue Bowl with stands
□ Tide tables (current and previous day)              □ 0.5 mm sieve
□ Camera                                              □ 12 V marine battery
□ Thermometer                                         □ Shims
□ Measuring tape x2                                   □ Turkey baster
□ Telescoping leveling rod                            □ Big plastic spoon
□ 1 metre stick                                       □ Small plastic spoon
□ Clinometer/hand site level                          □ Rubber spatula
□ Compass                                             □ Wash bottle (optional)
□ GPS unit                                            □ Stockard’s solution
□ Scoop (500mL)                                       □ MSDS Sheet for Stockard’s solution
□ 4 litre Sample containers
□ Sample tags
□ Sediment Grain Card

Sample Processing
Sieving Process
□ 5 gallon bucket with holes in the bottom
□ Sieves – 4.0 mm, 2.0 mm, 0.5 mm
□ Water buckets
□ Water pitcher (optional)
□ Plastic tub(s)
□ Sample jar(s)
□ Nylon brush
□ Hose for water

1.2 Laboratory Checklist
□ Dissecting microscope
□ Petri dishes
□ Small spoon
□ Pipette
□ Fine point forceps
□ Corresponding datasheets
□ Vials
□ Stockard’s solution
□ MSDS Sheet for Stockard’s solution
                                             Page 4 of 86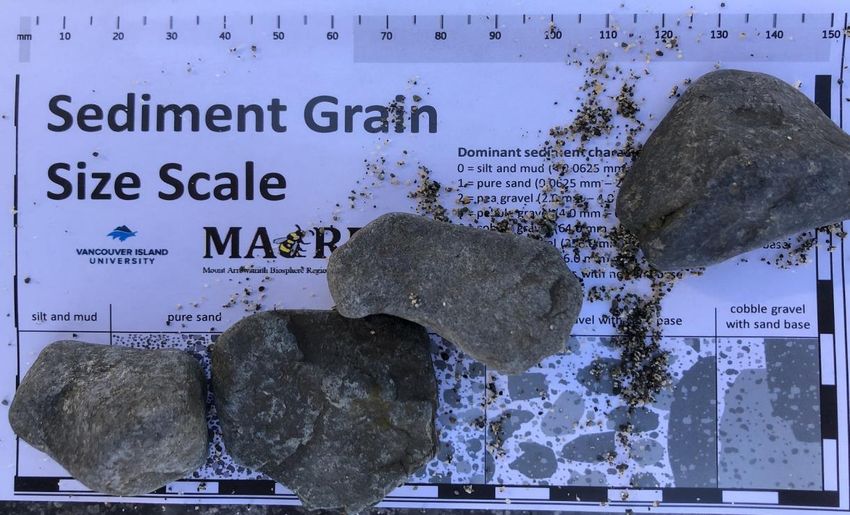
British Columbia Forage Fish Spawning Survey Methodology for Academics and QEPs

2.0 HOW TO SAMPLE – STEP BY STEP

2.1 Field Preparation
2.1.1 Determining When to Sample
    1. Sampling occurs in the upper third of the intertidal zone, selecting areas that contain the
       preferable sediment composition. This section must be exposed in order to sample.
    2. The ‘ideal sampling zone’ is 2 m to 3 m above the Mean Low Low Water (MLLW) mark, which will
       vary based on area. It is good practice to plan your sampling at times when your ‘ideal sampling
       zone’ is exposed. For example, if your MLLW mark is 1.2 m, the ‘ideal sampling zone’ would be 3.2
       m to 4.2 m; therefore, you would not want to go to the beach until the water level is at 3.2 m or
       lower.

2.1.2 Determining the Mean Low Low Water Mark
    3. A Canadian Hydrographic Service (CHS) map for the area of interest will be required.
    4. Each map has a variety of tidal information recorded on the front of the map in a box, under the
       map’s title. It is in this box that you will find the “Mean Tide/LLW” measurement, which can then
       be used to determine the ‘ideal sampling zone’ for the region.

2.2 Site Assessment
   5. Assess the area based on sediment type, with Pacific sand lance preferring medium sandy
       sediments 0.25 mm to 0.5 mm, with spawning also documented in coarse sand and fine pebble
       sediments 1.0 mm to 7.0 mm in diameter. Surf smelt prefer a sand and pea gravel combination, 1.0
       mm to 7.0 mm. The landward boundary of the spawning area is the ‘high tide mark’, typically
       identified by a wrack (seaweed) line, and the seaward boundary is where there is a change in
       sediment type, becoming larger in size, or is simply at a lower elevation if there is no change in
       sediment type. Note: See section 7.0, Best Practices, for images of preferable sediment types.
   6. Lay out the 30 m measuring tape through the middle of the suitable substrate for forage fish
       spawning habitat/activities.

2.3 Calculating Tidal Elevation
   1. Using the ‘Calculating Tidal Elevation’ portion of your data sheet, work through the following
       steps.
   2. Record your beach station number.
   3. Using your leveling rod and clinometer/hand site level, you will determine the elevation change.
           a. One sampler holds the leveling rod at the edge of the water while the other stands at the
              measuring tape and looks through the clinometer at the leveling rod.
           b. When looking through the clinometer, determine where the zero value (percentage or
              degrees) aligns with the leveling rod – this will be your elevation change. Note: Depending
              on the slope of the beach and the distance of the water from your 30 m measuring tape, you
              may need to take multiple measurements to determine the total elevation change; therefore,
              you would fill out A, B, C, and D on your datasheet, as needed.
   4. Record the time at the waterline! In other words, record the time when you are taking your last
       elevation change measurement, as this will be the time you use to determine height of water
       relative to chart datum from the tide chart.
   5. In the ‘Subtract Eye Height’ column, record the height in which you used the clinometer (i.e., did
       you use the 1 m post or stand and measure from eye height). You must subtract the height at
       which you recorded from for every elevation change measurement that you took.
                                                 Page 5 of 86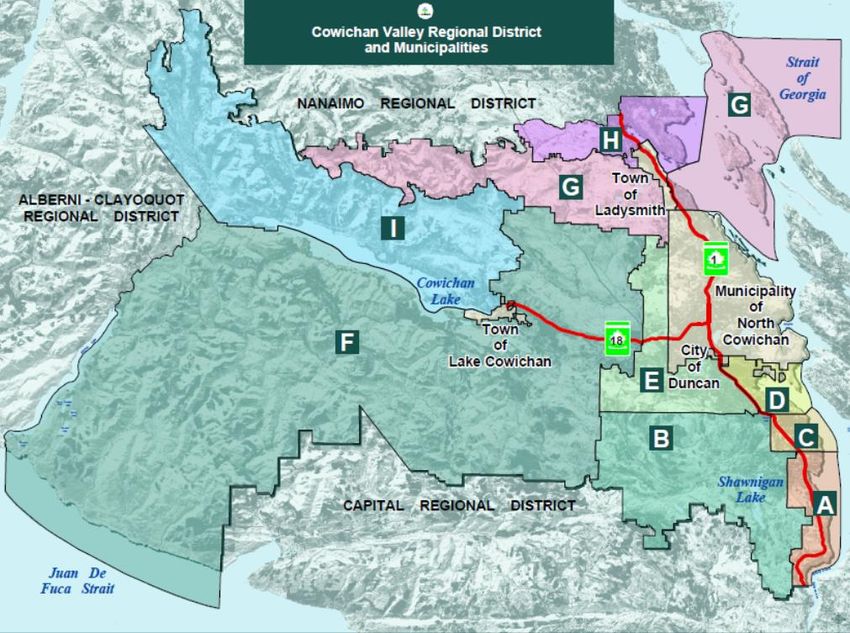
British Columbia Forage Fish Spawning Survey Methodology for Academics and QEPs

   6. Subtract the eye height from the elevation change and record in the ‘Elevation Difference’ column.
      Each calculated difference should be recorded and totaled at the bottom of the column.
   7. Record the elevation of the tide under the ‘Tide Level (Tide Table)’ column at the time the last
      elevation change was recorded. Note: Use Environment Canada’s tide charts for the area nearest
      your sample site (www.tides.gc.ca).
   8. Finally, calculate and record the ‘Elevation Relative to Chart Datum’ value by adding the ‘Tide
      Level (Tide Table)’ and the total ‘Elevation Difference’ values. This calculation determines where
      the 30 m measuring tape is in elevation relative to Chart Datum.
   9. If the tidal elevation is 2 m to 3 m above the Mean Low Low Water (check your CHS map) for the
      region, then you are within the ‘ideal sampling zone’ for Pacific sand lance and surf smelt
      spawning. If not, adjust your 30 m measuring tape as is required, ensuring that you move it based
      on vertical elevation and not a horizontal distance. Note: The 2 m to 3 m above Mean Low Low
      Water is not the principal determinant of a sample site. If the sediment appears favourable
      outside of the ‘ideal sampling zone’, feel free to sample just make note of the elevation and
      surrounding characteristics under the “Comments” section on your data sheet.

2.4 Filling out the Forage Fish Spawning Beach Survey Datasheet
2.4.1 Location & High Tide Events
    1. Use the Location Code document for Vancouver Island to fill out the regional district, as well as the
        municipality and/or electoral area that the sample site falls within. For the beach code use the first
        letter of each word in the name of the beach or the first two letters of the beach’s name if it is only
        one word. For example, the code for ‘Community Park Beach’ would be ‘CPB’, whereas the code for
        ‘Morningside Beach’ could be ‘MOR’.
    2. Then review Fisheries and Oceans Canada (DFO) Management Areas to note the fisheries
        management area in which you are sampling in.
    3. Finally, use the tide tables that you have printed off for that day and region to identify the “Last
        High Tide,” referring to the most recent high tide event, and “Second Effective High Tide,” which
        refers to a high tide that occurred the previous day that reached an elevation greater than or equal
        to the last high tide. Record the date, time, and elevation of each respective event, if applicable.

   (1a)                                                    (1b)

Figure 1. Explanation of tides that occurred prior to the time of sampling: (1a) last high tide, and (1b) second
effective high tide (MABRRI, 2018).

2.4.2 Samplers
    4. Record the sampler’s name(s) and affiliated organization, if applicable.

                                                    Page 6 of 86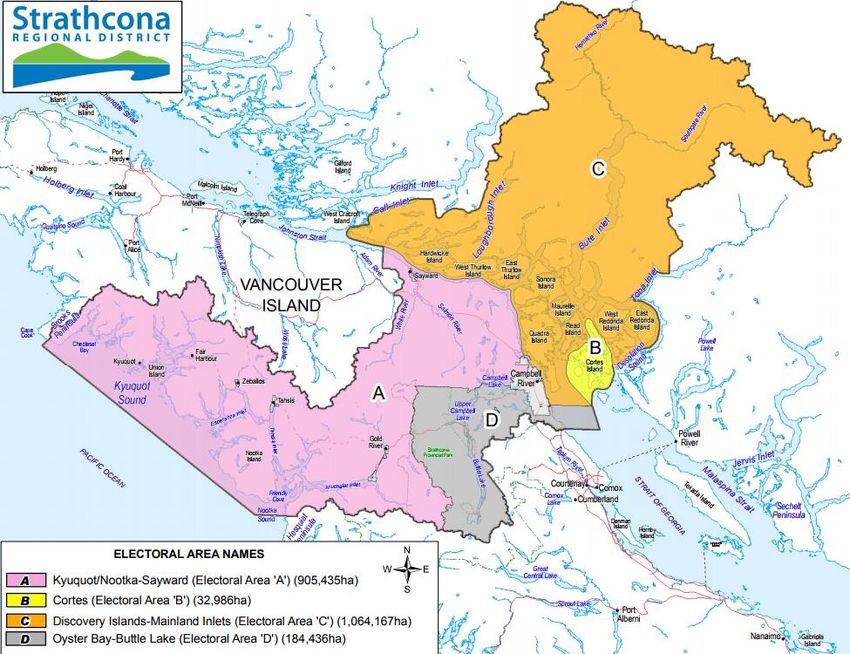
British Columbia Forage Fish Spawning Survey Methodology for Academics and QEPs

   5. Record the date and time of the sample collection, as well as the identification number/name of
      the camera that you are using to take photos.

2.4.3 Current Conditions
    6. Record the current weather conditions including the clouds, wind, and wave conditions.
    7. Use the closest weather station to your location to record the air temperature, wind direction, and
       wind speed. Remember that winds are named after the direction they are coming from. Note:
       Weather Underground (wunderground.com) is a useful website/app to use. Additionally, any locally
       accurate weather stations for your area can be used to record the current conditions.
    8. Using the thermometer, record the temperature of the water at the deepest depth you are able to
       reach safely.

2.4.4 Episodic Events
    9. Prior to or after the sample collection, determine if there has been a storm event in the last week.
        Note: Weather Underground (wunderground.com) is a useful website/app to use. Additionally, any
        locally accurate weather stations or buoys for your area can be used to record the conditions
        experienced in the last week.
    10. If there has been a storm event, record the duration of the event, including the dates and times at
        which it occurred, as well as the maximum wind speed and total precipitation that resulted from
        the event. Note: Storm events can quickly alter a beach and may impact the dispersal of spawning
        events.
    11. Identify if there is evidence of beach wrack harvesting occurring at the sample site (i.e., all-terrain
        vehicle tracks on the beach, beach wrack found on the road parallel to the beach, etc.). Note: This is
        only relevant when it is large-scale removal, meaning large vehicles are being brought onto the
        beach, which could disturb the embryos in the sediment if work was being conducted at the same
        time the forage fish were spawning.

2.4.5 Site Attributes
    12. Using a compass, determine the aspect of the beach (direction the beach is facing) and record both
        the cardinal direction and bearing (in degrees).
    13. Beach slope is determined using a clinometer.
            a. Each sampler stands 2.5 m on either side (landward and seaward) of the 30 m measuring
                tape to determine the slope. Record the slope of the beach (in degrees) on the data sheet.
                Note: Refer to section 6.0 for how to use a clinometer.
    14. The maximum fetch distance is the longest horizontal distance over which wave-generating winds
        blow. This distance is more accurately determined using georeferenced CHS maps or Google Earth.
            a. Input the GPS location of the sample site into the map of choice (a georeferenced CHS map
                or Google Earth).
            b. Use the measuring tool, determine the greatest distance over which wind can travel
                undisturbed.
            c. Record the determined distance.
    15. A beach’s exposure to wind and waves is reduced if there are landmasses or obstacles in the way.
        A beach’s exposure is directly correlated to the fetch and can range from very protected, having
        landmasses in front of it, at less than 1 km, to very exposed and having nothing in front of it for
        more than 1000 km.
            a. Refer to the back of the datasheet to determine the exposure that corresponds to the
                maximum fetch distance determined in step 14.
                                                   Page 7 of 86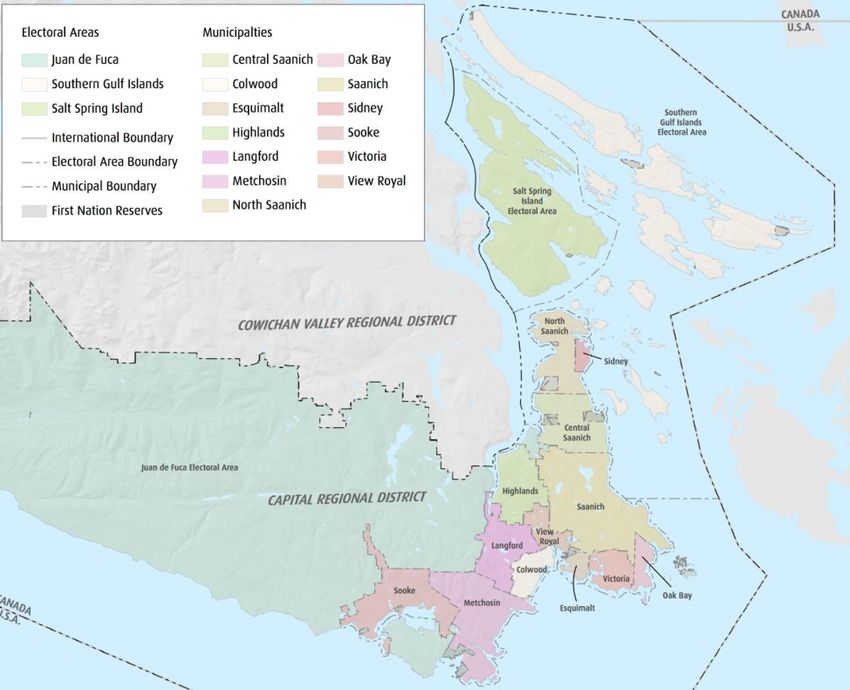
British Columbia Forage Fish Spawning Survey Methodology for Academics and QEPs

2.4.6 Sediment Sample Collection
    16. Record your beach station number and time at which you are sampling. Note: Each beach station
        represents up to 300 m of beach. Therefore, if a beach has suitable sediment expanding greater than
        300 m in length, it may be necessary to establish additional beach stations.
    17. Record the UTM coordinates at the 15 m mark of the 30 m measuring tape using a GPS unit.
    18. Using the ‘Field Observation Sampling Codes’, found on the back of the datasheet, choose the
        dominant beach sediment type. If there is a mix of sediments on the beach, identify which
        sediment type is dominant in the 30 m by 5 m sampling area. It can be noted in the comments
        section at the bottom of the datasheet if there was a mix of sediment sizes. The sediment type
        should be approximated using the sediment grain size card.
    19. Using the ‘Field Observation Sampling Codes’, identify the character of the backshore, which refers
        to how impacted the area above the beach station is as a result of human development.
    20. With the second tape measure, measure the width of the potential forage fish spawning habitat.
        The width typically stretches from the highest tide mark (either last high tide or second effective
        high tide), usually determined by a wrack line, approximately 0.5 m in vertical elevation below the
        foreshore features (log line, dune grass, etc.), down to the area that has a notable change in
        sediment. Note: If the beach has completely uniform sediment from top to bottom, the width will
        extend only a few metres in vertical elevation.

     Figure 2. Identifying the ‘width’ of the beach that is suitable for forage fish spawning activities in
     the upper intertidal zone.
                                                Page 8 of 86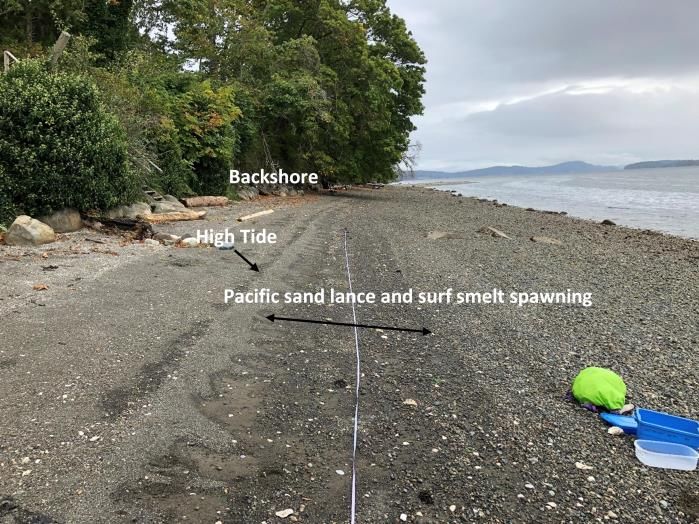
British Columbia Forage Fish Spawning Survey Methodology for Academics and QEPs

   21. The length of the potential forage fish spawning habitat is referring to the distance along the beach
       that contains the suitable sediment. Use a GPS unit to mark a waypoint at either end of the
       potential spawning habitat and using a georeferenced map or Google Earth, measure the distance
       between them to get the length value. Note: If the length of potential spawning beach is greater
       than 300 m it is ideal to establish a second beach station.
   22. Record the sample number. An individual beach station can have multiple samples if different
       beach elevations or sections appear to be suitable for spawning habitat. Note: Sample areas are
       only 30 m x 5 m; therefore, there is a possibility that more than one sample can be taken.
   23. Record the “Landmark Object” that you have chosen to measure your 30 m measuring tape from.
       The object must be a permanent, unmovable object at the top of the beach, along the backshore.
   24. You will measure the distance between the 30 m measuring tape, at the 15 m mark, and the
       chosen landmark. Be sure that the measurement is perpendicular to the measuring tape. Record
       this measurement in the ‘Landmark Distance (m)’ column. Note: Sometimes the landmark does not
       line up with the 15 m mark. Therefore, be sure to measure the distance of the landmark to the
       measuring tape perpendicularly. Record in the comment section where on the measuring tape the
       landmark was measured from and what end of the beach the 0 m mark is located. For example, ‘the
       landmark was measured from the 24 m mark and the 0 m mark was at the west end of the beach.’
   25. Fill in the tidal elevation of your 30 m measuring tape that was determined at the beginning of this
       process, if it has not changed. If you have moved the measuring tape from the original position be
       sure to record the accurate elevation.
   26. Using the ‘Field Observation Sampling Codes’, record how shaded the sample site is. Note: This
       measurement considers a seasonal and daily average for the site.
   27. There are two sediment samples that can be collected:
            a. A ‘Bulk’ (“B”) sample is a 4 L sediment sample that is collected when no embryos are
                evidently present at the site. This is the most common type of sample to be collected.
            b. A ‘Scoop’ (“S”) sample requires the collection of approximately 500 mL of sediment. This
                method is used when embryo masses are visible on the beach. This will ensure species
                identification and minimal collection of embryos, reducing the overall impact.
   28. The ‘Smelt’ and ‘Sand Lance’ columns require you to pick up a handful of sediment and look
       through it carefully to see if you are able to visualize any embryos before collection.
   29. Each site requires six photos to be taken, including one of the completed sample tag, one of the
       sediment next to an object for size comparison (use the sediment grain card), one of the beach
       backshore, beach right, beach foreshore, and beach left. Ensure that you move, as necessary, to get
       representative photos of the foreshore and backshore. If multiple samples are collected at a single
       beach station only the photo of the sample tag and sediment are required for each subsequent
       sample. See section 2.5 for how to complete a sample tag.
   30. Finally, include any additional comments regarding the site(s) or objects/wildlife you observed at
       the site in the “Comments” section at the bottom.

2.5 Sample Collection
   1. Fill out a sample tag, including the date, location (beach code), sample
      station, and sample number.
   2. You will need a 4 L plastic container, a filled out sample tag, and the
      500 mL scoop.
   3. Your sample area is 30 m by 5 m – therefore, it runs down the entire       Figure 3. Sample tag.
      length of your 30 m measuring tape and 2.5 m on either side of it,
      towards the foreshore and backshore.
                                                Page 9 of 86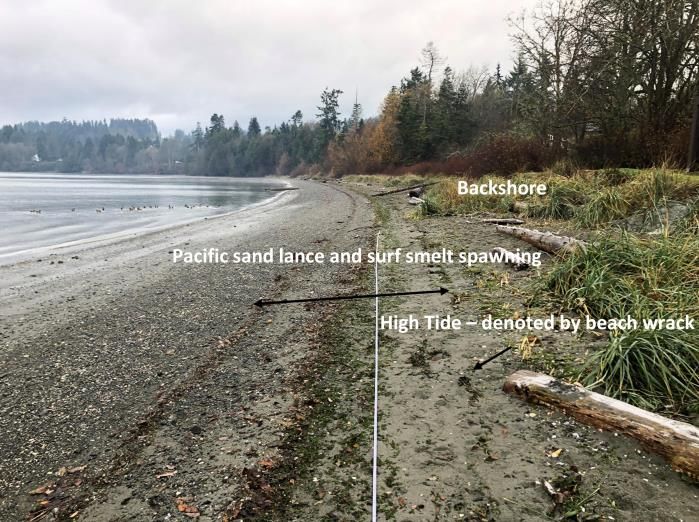
British Columbia Forage Fish Spawning Survey Methodology for Academics and QEPs

   4. Place the sample tag into the 4 L sample container. The sample tag will follow the sample from this
      point forward, all the way to the lab analysis.
   5. Using the scoop and container, you will collect 4 L of sediment from the sample area, identifying
      the most ideal sediments along the measuring tape to collect. Be sure to collect a representative
      sample, spreading out along the measuring tape where the sediment is being collected; collect
      approximately half of the sample from above the measuring tape and the other half from below.
      Note: This is biased sampling. Density counts are not being determined from this sampling method,
      simply presence and non-detection.
                     (4a)                        (4b)                        (4c)                          (4d)

                     )                                                       ))                            )
                                                                                    )
                                                                                                           )

  Figure 4. Sampling requires the collection of a 4 L sediment sample: (4a) and (4b) depict a sample
  container that is not filled to 4 L, while (4c) and (4d) show what a full sample container should look like.

   6. Rinse the scoop after every sample you collect to avoid cross contamination between samples.

Note: If bulk samples cannot be processed immediately, they should be stored in 0.5 °C to 7 °C, such as a
fridge, for up to 7 days; this will aid in reducing the rate of decomposition and embryo mortality.

2.6 Sample Processing
It is possible to complete the next steps either in the field or back at the office and/or laboratory, each
requiring specific equipment:

2.6.1 Sieving in the Field
    1. You will need a 5-gallon bucket with holes drilled in the bottom, three stackable sieves (4.0 mm,
        2.0 mm, and 0.5 mm), a water bucket, a wash bucket, and a sample
        jar.
    2. First, ensure that the sieves are stacked in the appropriate order
        from largest to smallest with the smallest being on the bottom. Then
        place the sieves on top of the 5-gallon bucket and pour your sample
        into the top sieve. Transfer the sample tag into the sample jar and
        ensure that this stays with the sample throughout the rest of the
        processing.
    3. This is a two-person job – the first person will be collecting water to
        pour over the sample while the second person is responsible for
        shaking the sediment through the sieves.
    4. Once the sample is fully washed through the sieves, transfer the
        sample from the 0.5 mm sieve into the wash bucket, this is the
        sample that you will process using the vortex method. Note: The
        sediment left in the 4.0 mm and 2.0 mm sieves can be disposed.         Figure 5. Research assistants
                                                                                    processing sieving sediment
                                                                                    samples.

                                                Page 10 of 86
British Columbia Forage Fish Spawning Survey Methodology for Academics and QEPs
5. Ensure you clean the sieves using the nylon brushes, and rinse out the buckets after each sample,
to avoid cross contamination between samples.
2.6.2 Sieving at the Office/Laboratory
6. Follow the same method as stated above in “Sieving in the Field,” but instead of one person
collecting water to pour over the sample, a hose can be used to wash the sample through while the
other person shakes the sieves.
7. Ensure that you have collected the sample from the 0.5 mm sieve in a wash bucket, as well as clean
the sieves and 5-gallon bucket between each of the sieving events.
2.6.3 Vortex Method
(6a)
Note: Vortex method instruction discussed below is adapted from
WDFW’s published methods (Dionne, 2015), which can be found
here: https://wdfw.wa.gov/publications/02022.
8. Ensure the nylon stocking is secured around the bilge
pump using an elastic.
9. Fill the 68 L tote with 3 to 4 buckets of water, the hose,
or until it is half full.
10. Put the tote lid back on and feed the bilge pump through
the smaller hole, ensuring that the alligator clips and
the flex hose stick out and the pump is fully submerged.
11. Rest the 0.5 mm sieve over the larger hole and place the
blue bowl on top of that. Make sure that the sieve and blue
bowl are as level as possible – use shims to level it if
necessary.
12. Connect the bilge pump’s hose to the blue bowl. Before (6b)
you attach the battery clamps to the 12 V battery, ensure
Figure 6. Vortex method explanation:
that the valve on the blue bowl is open – it should never (6a) vortex kit set-up and (6b) how the
be closed when the pump is running, it will cause the vortex is generated (Dionne, 2015).
hose to burst. Refer to section 5.0 to build a vortex kit of
your own if you do not have one.
13. Attach the battery clamps to the battery and allow the blue bowl to fill with water. Note: Always
connect the positive cable first, followed by the negative cable.
14. Add the sediment sample to the blue bowl. The water should be approximately 1 to 2 cm from the
top of the bowl after the sediment has been added.
15. Add the entire sample to the blue bowl, ensuring that you rinse out the wash bucket as well. Note:
If you have a very large sample that will over flow the raised centre be sure to process the sample in
multiple portions.
16. Once the sample is in the bowl, use the spatula and small spoons to agitate the sediment starting at
the centre and moving the sediment towards the outer rim, for 3 minutes – this will release the
lighter materials, such as embryos and organic matter. These lighter materials will be carried by
the water vortex through the raised centre and be collected in the sieve below.
17. After agitation, let the water run for another minute, allowing the vortex to collect any of the last
material.
Page 11 of 86British Columbia Forage Fish Spawning Survey Methodology for Academics and QEPs
18. When you are ready to shut off the bilge
pump, you will need to close the valve
attached to the blue bowl and disconnect the
battery clamp simultaneously. Closing the
valve will ensure that sediment doesn’t get
sucked back into the bilge pump. Note:
Always remove the negative cable first, then
the positive cable.
19. Using the baster, collect the sediment that is
directly beside the raised centre of the blue
bowl. This action will ensure that any final
organic materials that didn’t make it over the
rim will be included in the sample. Figure 7. Depicting how to agitate the sediment in
20. Wash the final sample that was collected in the blue bowl.
the 0.5 mm sieve, into a sample jar. Note: Try
to limit the amount of water entering into the sample jar.
21. Add the Stockard’s solution:
a. Using a pipette, do your best to remove the top layer of water in the sample jar.
b. In a well ventilated area and wearing gloves and safety glasses, add enough Stockard’s
solution to cover the sediment sample.
c. The sample can then be stored at room temperature until it can be analyzed. Note: It is up
to your group if you will be adding Stockard’s solution to the sample; it will likely depend on
the group’s access to the appropriate equipment and disposal facilities. If you are not able to
use Stockard’s solution, it is best to have the samples looked at within seven days of
processing.
22. Don’t forget to wash your sieve with the nylon brush and wash out all of your buckets. Finally,
clean the nylon stocking that is covering the pump to ensure that all the sediment is washed off.
Note: If you are processing on the beach with salt water be sure to flush your bilge pump with
fresh water as soon as possible, as salty, marine water will take a toll on the equipment over
time.
3.0 LABORATORY ANALYSIS
1. Each sample should be analyzed separately, ensuring no cross contamination.
2. Using a small spoon, take a very small amount of your sample and spread it thinly in a petri dish.
Creating a single layer, rather than a thick layer of sediment, along the bottom of the petri dish is
the best technique and will reduce the possibility of missing embryos.
3. Examine the entire sample using the dissecting microscope.
4. Whenever you think that you have found an embryo, use a pipette to transfer it gently into
another petri dish.
5. Be sure to separate all of the embryos that you find from the sediment for further analysis. If there
are embryos present, you will document:
[1] the species,
[2] the number of each species, and
[3] the alive to dead ratio of each species.
If there are more than 100 embryos, you are only required to stage the first 100. All of this data is
to be documented on the data sheet.
Page 12 of 86British Columbia Forage Fish Spawning Survey Methodology for Academics and QEPs
6. After analysis, the embryos that are found will be preserved in Stockard’s Solution. Be sure you
are in a ventilated area and are wearing the appropriate safety gear. You will pipette the solution
from the bottle into the sample vial with the embryos; you only need enough solution to cover the
embryos.
3.1 Species
There are four potential fish species that you are likely to see when sampling, including:
3.1.1 Pacific Sand Lance (Ammodytes personatus)
• Embryos are 0.8 mm to 1.0 mm in diameter
• Have multiple sand grains attached
• Not completely round
• Milky colour
• There is 1 large oil droplet in the yolk
Figure 8. Pacific sand lance embryos.
3.1.2 Surf Smelt (Hypomesus pretiosus)
• Embryos are 1.0 mm to 1.2 mm in diameter
• The embryo will only be attached to the sediment at a single
point, where the membrane has ruptured and folded back,
exposing an adhesive attachment point, called the ‘peduncle’
• Non-self-adhesive – do not attach to other embryos
Figure 9. Surf smelt embryos
(Brian Koval, Peninsula Stream
Society, 2019).
3.1.3 Rock Sole (Lepidopsetta bilinear)
• Perfect sphere
• Very transparent
• Does not attach to sediment – no attachment sites
• Non-adhesive
Figure 10. Rock sole embryos
(Moulton & Penttila, 2006).
Page 13 of 86British Columbia Forage Fish Spawning Survey Methodology for Academics and QEPs
3.1.4 Pacific Herring (Clupea pallasii)
• Embryos are 1.3 mm to 1.5 mm in diameter
• Almost entirely spawn on marine vegetation
• They have a distinct shell attachment sites
• Often found in layers or clumps
Figure 11. Pacific herring
embryos (Moulton & Penttila,
2006).
3.2 Alive-to-Dead Ratio
Forage fish embryos that are alive will have a discernable embryo in a life stage event that can be
determined by comparing it to your “Embryological-Stage Categories” sheet (refer to “Development
Stages”).
Forage fish embryos that are dead will appear opaque-white, lack a discernable embryo, be covered in
fungus, collapsed, or appear empty (refer to image below).
Figure 12. Depiction of forage fish embryos in dead or damaged states (Moulton & Penttila, 2006).
(13a) (13b) (13c) (13d)
) ) ) )
Figure 13. Embryos that are alive vs hatched/dead. Figures (13a) and (13b) show surf smelt
embryos alive and hatched, respectively (Brian Koval, Peninsula Stream Society, 2019). Figures
(13c) and (13d) show Pacific sand lance embryos alive and hatched, respectively.
3.3 Development Stages
Developmental stage drawings have been provided for two of the four potential species, with the Pacific
sand lance being very similar to the Pacific herring developmental stages.
Page 14 of 86British Columbia Forage Fish Spawning Survey Methodology for Academics and QEPs
3.3.1 Pacific Herring
As there are no composites for Pacific sand lance embryos, the Pacific herring diagrams are to be used as
a guide when identifying development stages, as they have been noted to be similar to the Pacific sand
lance development.
Figure 14. Pacific herring developmental stages (Moulton & Penttila, 2006).
Page 15 of 86British Columbia Forage Fish Spawning Survey Methodology for Academics and QEPs
3.3.2 Surf Smelt
Figure 15. Surf smelt developmental stages (Moulton & Penttila, 2006).
Page 16 of 86British Columbia Forage Fish Spawning Survey Methodology for Academics and QEPs
3.4 Embryo Validation Process
Whenever embryos are detected in samples, they will need to be confirmed by an expert prior to
submission of results to the database.
1. Using a dissecting microscope, take photos of the embryos that were found. Note: Be sure that the
photos are very clear, otherwise they are very difficult to confirm.
2. Email the photos to an expert in either British Columbia or Washington State to confirm the
species of embryos. Note: If you are unclear who to contact, reach out to one of the main
coordinating groups (MABRRI, Peninsula Stream Society, etc.) to determine the appropriate person
to contact.
3. Once confirmation has been received, this data can be uploaded into the Strait of Georgia Data
Centre or be used in reporting.
4. Save/file a copy of the email with the datasheets to ensure that you have the confirmation on
hand, if it is ever requested.
4.0 DATA MANAGEMENT
All forage fish data should be submitted to the Pacific Salmon Foundation’s Strait of Georgia Data Centre,
an open-access database hosted by the University of British Columbia. All data with regards to forage fish
in the Salish Sea will be stored in this database, allowing for anyone interested in the data to access it.
You can access the database from this link: http://sogdatacentre.ca/.
If you are unsure who to contact with regards to data submission or formatting, contact one of the main
coordinating groups (MABRRI, Peninsula Stream Society, etc.) to determine the appropriate person to
contact.
5.0 BUILDING A VORTEX METHOD UNIT
5.1 Materials Required
□ 68 litre tote with lid
□ Water bucket
□ Blue bowl concentrator
□ An adjustable hose valve
□ 750 to 1000 GPH submersible electric water pump
□ Alligator clips
□ Nylon stockings and an elastic
□ 60 cm length of ¾” corrugated hose
□ ¾” male hose fitting
□ 2 x ¾” hose clamps
□ Quick connect hose fittings
□ 0.5 mm Sieve
□ Wash tub
□ Shims
□ Rubber spatula
□ Large plastic spoon
Page 17 of 86British Columbia Forage Fish Spawning Survey Methodology for Academics and QEPs
□ Small plastic spoons
□ Baster
□ Nylon brush
□ Wash bottle (optional)
□ Metal hangers (optional)
□ 12 V marine battery
5.1.1 For construction
□ Box cutter
□ Permanent marker
□ Electrical tape
5.2 Material Preparation
5.2.1 Body of the Vortex
1. Cut two holes in the tote’s lid: one smaller one in the
top corner for the flex hose and battery clamps to
come out of and one larger round one that the 0.5 mm
sieve will sit on. You will have to customize this hole
to ensure that your sieve will not fall through. Note: It
is suggested you draw the holes with a marker prior to Figure 16. Depicting how to cut the holes
cutting, ensuring that the holes will not be too big. in to vortex kit lid (Dionne, 2015).
5.2.2 Bilge Pump Preparation
2. Connect the bilge pump to one end of the corrugated hose using one of the hose clamps.
3. Insert the ¾” male hose fitting into the other end of the corrugated hose and secure it with the
second hose clamp.
4. Add one of the quick connector fittings to the male hose fitting on the corrugated hose.
5. Using pliers, attach the alligator clamps to the bilge pump cables. Be sure to connect the clamps to
the appropriate cables.
6. Stretch the nylon stocking over the pump’s water intake and secure in place with an elastic. The
stocking ensures that if any embryos are lost in the tote, they will not pass through the pump and
into the blue bowl, potentially cross contaminating samples if multiple are being processed. Note:
Be sure the nylon stocking is tight so the stocking does not get sucked in when the pump is turned on.
(17a) (17b)
) )
Figure 17. Bilge pump preparation: (17a) identifies the materials that will be required to prep
the bilge pump and (17b) depicts how the bilge pump should look when put together.
Page 18 of 86British Columbia Forage Fish Spawning Survey Methodology for Academics and QEPs
5.2.3 Blue Bowl Concentrator Preparation
7. Add the second quick connector fitting to the blue bowl concentrator.
8. Prepare ‘legs’ for the blue bowl by cutting the metal hangers with wire cutters and folding the
ends of the metal hangers back. Note: The blue bowl concentrators come with ‘legs’, however they
are typically too small and result in the blue bowl slipping off of the sieve. Therefore, it is
recommended to build these longer ‘legs’ to ensure the sample being processed does not slip off.
(18a) (18b)
) )
Figure 18. Blue bowl concentrator preparation: (18a) identifies the materials that will be required to
prep the blue bowl and (18b) depicts how the blue bowl should look when put together.
5.3 Assembly
9. On a level surface, fill the tote half
full of water, place the bilge pump in
the tote, and secure the tote’s lid,
feeding the alligator clamps and
corrugated hose through the “pump
hole.”
10. Set the 0.5 mm sieve over top of the
“water return hole” and stack the
blue bowl on top of the sieve,
extending the ‘legs’ so it sits level.
11. Attach the corrugated hose to the
blue bowl using the quick connector
fittings. The final product should
appear like Figure 19.
12. Follow the sediment processing
details in section 2.6 ‘Sample
Processing – Vortex Method’. Figure 19. How to set up a vortex kit set-up (Dionne, 2015).
Page 19 of 86British Columbia Forage Fish Spawning Survey Methodology for Academics and QEPs
6.0 HOW TO USE A CLINOMETER
1. Partner up and stand at the same elevation a few metres
apart and facing each other.
2. Hold the clinometer up to your dominant eye. Keep both
eyes open and look through the sight lens.
3. While holding the clinometer up to your eye, line the
crosshair up with the zero. When aligned, use your other
eye to note what part of your partners body the crosshair
intersects (i.e., chin, nose, etc.).
4. Now have the taller partner stand 2.5 m on the seaward
side of the 30 m measuring tape.
5. Look through the clinometer at your partner and locate the Figure 20. Clinometer (TrekkInn, n.d.).
same reference point (i.e., chin, nose, etc.) that was
designated in step 3.
6. At this point you can either determine the slope in degrees (using the left side), or in percent
(using the right side).
Page 20 of 867.0 BEST PRACTICES
7.1 Identifying Suitable Sediment
When selecting spawning habitat, different species of forage fish have different preferences for different sediment types. It is not uncommon
that there is a lot of broken shell material mixed in with the sand and gravel. Do not try to avoid the shell materials as forage fish embryos
can attach to the shells, as they are the same size as their favourable sediments.
Mud & Silt Pure Sand Pea Gravel Pebble Gravel Cobble Gravel
Pacific sand lance Spawning Beaches
Surf smelt Spawning Beaches
Figure 21. Identifying which beaches are preferable for Pacific sand lance and surf smelt to use for spawning.
Page 21 of 86British Columbia Forage Fish Spawning Survey Methodology for Academics and QEPs
7.1.1 Suitable Sediment: Pacific Sand Lance (PSL)
Pacific sand lance spawn from November to mid-
February and prefer medium sand 0.25 mm to 0.5
mm in diameter, with spawning also documented in
coarse sand and fine pebble sediments from 1.0 mm
to 7.0 mm in diameter.
Figure 22. Pure sand: preferable sediment for PSL spawning (to scale).
Figure 23. Pea gravel with sand base: preferable sediment for PSL spawning (to scale).
Page 22 of 86British Columbia Forage Fish Spawning Survey Methodology for Academics and QEPs
7.1.2 Suitable Sediment: Surf Smelt (SS)
Surf smelt spawn have been found to spawn year-
round in coarse sand to fine pebble sediment mixes
ranging from 1.0 mm to 7.0 mm in diameter.
Figure 24. Pea gravel with sand base: preferable sediment for SS spawning (to scale).
Figure 25. Pebble gravel with sand base: preferable sediment for SS spawning (to scale).
Page 23 of 86British Columbia Forage Fish Spawning Survey Methodology for Academics and QEPs
7.1.3 Unsuitable Sediments
Some of the sediments that beaches consist of are not
suitable for Pacific sand lance and surf smelt to spawn
on. Large cobble not ideal; although forage fish
embryos can attach to this larger sediment, they are
less likely to survive. Additionally, mud and silt is too
fine and compact, making it difficult for respiration to
occur and increasing the likelihood of embryo
smothering.
Figure 26. Cobble gravel with a sand base: unsuitable sediment for PSL and SS
spawning (to scale).
Page 24 of 867.2 Forage Fish Sampling Methods
A few things to consider when sampling:
• Select the most ideal looking sediment, sampling those sediments that are approximately 0.2 mm
to 7.0 mm in diameter will provide you with the greatest potential of capturing a spawning event.
This is biased sampling, but these protocols are used to determine where and when surf smelt
and/or Pacific sand lance are spawning in British Columbia. Therefore, the data collected will
indicate spawning presence or non-detection.
• When investigating a beach’s sediment composition, be sure to move some of the top layer of
larger sediment or seaweed out of the way to determine if:
o the ideal sediment identified on the surface is a few centimeters thick and not just a small
layer situated overtop of larger cobble sediments; or,
o the not ideal sediment (i.e., larger cobble) identified does not have a layer of ideal sediment
below it before moving on to the next beach. Note: When sampling you can move the top
layer of sediment and scoop the ideal sediment below. This can be done because when
spawning occurs, the wave action moves the embryos around, allowing them to settle down
under the larger sediment.
• When collecting the sediment, do your best to get a representative sample of the entire sample
area (30 m by 5 m). A simple way to do this is to mark the 15 m mark along the 30 m measuring
tape and envision that your area is divided into 4 equal quadrats, each 15 m by 2.5 m (see below).
By doing this you can collect approximately 25% of your sample from each section.
(27a) (27b)
Figure 27. An example of how to visualize the sampling area to collect the representative sample: (27a)
breaking the 30 m by 5 m into quadrats, and (27b) the quadrats drawn out on a beach.
Note: If a portion of your sample area has non-ideal sediment (bedrock, large cobble, mud, or silt), do your
best to get an equal amount of sediment from each of the ideal sections.
7.3 Sample Processing
A few things to consider when processing your sample(s):
• When transferring the sample from the sieve to the wash tub in the field, pour the water through
the back of the sieve and slowly rotate the sieve to ensure the entire sample has been transferred.
Page 25 of 86British Columbia Forage Fish Spawning Survey Methodology for Academics and QEPs
Note: When using a hose, it is still easiest to spray the sieve from the backside to transfer the entirety
of the sample into the wash tub.
• When sieving in the field, you can use a water pitcher instead of a large water bucket to reduce
physical ailments, as well as have better control of the water flow.
• If you still retain a very large sample after you have processed your sample through the sieves, it is
best to process the sample in multiple ‘batches’ through the vortex kit; this will enable the greatest
amount of the preferential sediments to be collected.
• When you have completed both processing steps, sieves and the vortex kit, and you are
transferring your sample into a jar, it is best to first scoop the bulk of the sediment into the jar
with a small spoon (rather than using water to coerce your sample into the jar). If you use water
from the start, there is the potential that your jar will overflow, which may result in losing some of
your sample.
• Be sure to clean all your gear between samples (i.e., sieves, blue bowl, buckets, baster, spoons,
etc.) to prevent cross contamination.
• If you use salt water to process your sample, be sure to rinse all of your gear with fresh water as
soon as possible, including flushing the bilge pump.
7.4 Laboratory Analysis
A few things to consider when analyzing your sample(s):
• Drawing grid lines or a set of circles on the bottom of the petri dish can aid in distinguishing
where in the petri-dish you have already looked
• When putting sediment into
the petri dish to analyze, be
sure to only put in a very small
amount to make a single layer
of sediment. If sediments are
stacked on top of one another,
processing them takes longer
and it is less likely that you will
see the embryos mixed in
amongst the sediment.
• Look for movement in the petri
dish when moving it around.
The embryos sway in the
water when the dish is moved Figure 28. Petri dishes with grid lines and circles to aid in
around, whereas the sediment analysis process.
will remain steady.
• When you think you have found an embryo, use the forceps to gently squeeze it – this will ensure
that it is not a rock or a piece of plastic.
• If the sample is not in preservative, be sure to keep it in a cool place (i.e., fridge) and analyze your
samples within seven days.
Page 26 of 86British Columbia Forage Fish Spawning Survey Methodology for Academics and QEPs
7.5 How to Safely Use Stockard’s Solution
Although Stockard’s solution is more potent than ethanol, there are some benefits to using it. It is
recommended that Stockard’s solution be used because ethanol can bleach and desiccate the embryos,
making species identification difficult. Additionally, when the embryos are preserved in Stockard’s
solution than can be stored for years and can be used for educational purposes.
Therefore, there are a few things to consider when using it:
• Ensure to have the MSDS sheet on hand
• Recommended to have WHMIS training
• Be sure to be in a well ventilated space (i.e., outside, fume hood) and wearing gloves and safety
glasses when using
• Use a pipette to transfer the Stockard’s solution into the jar or vial in a controlled fashion
• When filling the sediment or embryos, only add enough solution to fully cover them
• Ensure disposal of Stockard’s solution in the appropriate location according to the MSDS sheet
Page 27 of 86British Columbia Forage Fish Spawning Survey Methodology for Academics and QEPs
8.0 REFERENCES
A variety of documents and resources were used to produce this manual, including:
Dionne, P. (2020). Personal communication.
Dionne, P. (2015). Vortex method for separation of forage fish eggs from beach sediment. Washington
Department of Fish and Wildlife, 1-14.
Fisheries and Oceans Canada (DFO). (2002). Surf smelt: Stock status report B6-09(2002). Retrieved from
https://waves-vagues.dfo-mpo.gc.ca/Library/345799.pdf
Koval, B. (2019). Images of embryos.
Meisel Rock Products. (2015). Sand and gravel uses. Retrieved from
http://www.meiselrockproducts.com/sand-and-gravel-uses/
Moulton, L.L. & Penttila, D.E. (2006). San Juan County forage fish assessment project: Field manual for
sampling forage fish spawn in intertidal shore regions. Retrieved from the Washington
Department of Fish & Wildlife.
Robards, M.D., Piatt, J.F., & Rose, G.A. (1999). Maturation, fecundity, and intertidal spawning of Pacific
sand lance in the northern Gulf of Alaska. Journal of Fish Biology, 54, 1050-1068.
Robinson, C. (2020). Personal communication.
Swanpark. (2019). White pea gravel. Retrieved from http://swanpark.site/white-pea-gravel/
Thuringer, P. (2003). Documenting Pacific sand lance (Ammodytes hexapterus) spawning habitat in
Baynes Sound and the potential interactions with intertidal shellfish aquaculture. Retrieved from
https://www.for.gov.bc.ca/tasb/slrp/marine/south_island/baynes/docs/sandlance/baynes_sand
lance_%20draftreport.pdf
Thuringer, P. (2017). Personal communication.
Thuringer, P. (2020). Personal communication.
TrekkInn. (n.d.). Suunto. Retrieved from https://www.trekkinn.com/berg/suunto-pm-5-66-pc-opti-
clinometer/22183/p
Page 28 of 86Appendix I: Forage Fish Sampling: Location Codes Developed by: Mount Arrowsmith Biosphere Region Research Institute (MABRRI) May 2018 Revised: August 2019
Forage Fish Sampling: Location Codes

TABLE OF CONTENTS

1.0 Intro                                                                 34
2.0 Regional District of Mount Waddington (RDMW)                          35 – 36
        2.1 Municipalities                                                35
        2.2 Electoral Areas                                               36
3.0 Strathcona Regional District (SRD)                                    37 – 38
        3.1 Municipalities                                                37
        3.2 Electoral Areas                                               38
4.0 Comox Valley Regional District (CMVRD)                                39 – 40
        4.1 Municipalities                                                39
        4.2 Electoral Areas                                               40
5.0 Alberni-Clayoquot Regional District (ACRD)                            41 – 42
        5.1 Municipalities                                                41
        5.2 Electoral Areas                                               42
6.0 Regional District of Nanaimo                                          43 – 44
        6.1 Municipalities                                                43
        6.2 Electoral Areas                                               44
7.0 Cowichan Valley Regional District (CWVRD)                             45 – 46
        7.1 Municipalities                                                45
        7.2 Electoral Areas                                               46
8.0 Capital Regional District (CRD)                                       47 – 50
        8.1 Municipalities                                                47
        8.2 Electoral Areas                                               50
9.0 Gulf Islands (GI)                                                     51
10.0 Powell River Regional District (PRRD)                                52
        10.1 Municipalities                                               52
        10.2 Electoral Areas                                              52
11.0 Sunshine Coast Regional District (SCRD)                              53
        11.1 Municipalities                                               53
        11.2 Electoral Areas                                              53
12.0 Metro Vancouver Regional District (MVRD)                             54 – 58
        12.1 Municipalities                                               54
        12.2 Electoral Areas                                              58
13.0 References                                                           59

Appendix A: Quick Summary of Location Codes                               60 – 62
Appendix B: Forage Fish Spawning Beach Survey – Habitat Characteristics   63

                                       Page 30 of 86
Forage Fish Sampling: Location Codes
FIGURES
Figure 1: Location data as seen on data sheet (Appendix B) 6
Figure 2: District of Port Hardy 7
Figure 3: District of Port Hardy 7
Figure 4: District of Port Hardy 7
Figure 5: Town of Port McNeill 7
Figure 6: Village of Port Alice 8
Figure 7: Village of Alert Bay 8
Figure 8: Electoral Areas of the Regional District of Mount Waddington 8
Figure 9: Village of Zeballos 9
Figure 10: Village of Tahsis 9
Figure 11: Village of Gold River 9
Figure 12: Village of Sayward 9
Figure 13: City of Campbell River 10
Figure 14: City of Campbell River 10
Figure 15: City of Campbell River 10
Figure 16: Electoral Areas of Strathcona Regional District 10
Figure 17: Village of Cumberland 11
Figure 18: Town of Comox 11
Figure 19: City of Courtenay 11
Figure 20: Electoral Areas of Comox Valley Regional District 12
Figure 21: District of Tofino 13
Figure 22: District of Ucluelet 13
Figure 23: City of Port Alberni 13
Figure 24: Electoral Areas of the Alberni-Clayoquot Regional District 14
Figure 25: City of Nanaimo 15
Figure 26: City of Parksville 15
Figure 27: Town of Qualicum Beach 15
Figure 28: District of Lantzville 16
Figure 29: Electoral Areas of the Regional District of Nanaimo 16
Figure 30: Town of Ladysmith 17
Figure 31: Municipality of North Cowichan 17
Figure 32: Town of Lake Cowichan 17
Page 31 of 86Forage Fish Sampling: Location Codes
Figure 33: City of Duncan 18
Figure 34: Electoral Areas of the Cowichan Valley Regional District 18
Figure 35: Town of Sidney 19
Figure 36: District of Central Saanich 19
Figure 37: District of North Saanich 19
Figure 38: District of Highlands 19
Figure 39: District of Saanich 20
Figure 40: District of Sooke 20
Figure 41: District of Metchosin 20
Figure 42: City of Langford 20
Figure 43: Town of View Royal 21
Figure 44: City of Colwood 21
Figure 45: Township of Esquimalt 21
Figure 46: District of Oak Bay 21
Figure 47: City of Victoria 22
Figure 48: Electoral Areas of the Capital Regional District 22
Figure 49: Salt Spring Island Electoral Area 23
Figure 50: Southern Gulf Islands Electoral Area 23
Figure 51: Southern Gulf Islands Electoral Area 23
Figure 52: City of Powell River 24
Figure 53: Electoral Areas of the Powell River Regional District 24
Figure 54: Town of Gibsons 25
Figure 55: District of Sechelt 25
Figure 56: Electoral areas of the Sunshine Coast Regional District 25
Figure 57: Village of Anmore 26
Figure 58: Village of Belcarra 26
Figure 59: Bowen Island Municipality 26
Figure 60: City of Burnaby 26
Figure 61: City of Delta 27
Figure 62: District of North Vancouver 27
Figure 63: Village of Lion’s Bay 27
Figure 64: City of Maple Ridge 27
Figure 65: City of North Vancouver 28
Page 32 of 86Forage Fish Sampling: Location Codes
Figure 66: City of Port Moody 28
Figure 67: City of Richmond 28
Figure 68: City of Surrey 28
Figure 69: Tsawwassen First Nation land 29
Figure 70: City of Vancouver 29
Figure 71: City of White Rock 29
Figure 72: District of West Vancouver 29
Figure 73: Electoral Area A in Metro Vancouver Regional District 30
Figure 74: Forage Fish Spawning Beach Survey – Habitat Characteristics Data Sheet 35
Page 33 of 86Forage Fish Sampling: Location Codes
1.0 INTRODUCTION
‘Forage fishes’ is a term referring to species of small, schooling fishes that are an
important food source for larger mammals, seabirds, and fish (Penttila, 2007). According to
the BC Ministry of Environment, forage fish, also known as pelagic fishes, consist of
numerous species, including: herring, anchovies, smelts, capelin, sardines, eulachon and
sand lance (BC Ministry of Environment, 2014). These species are classified based on their
ecological role in the marine ecosystem, rather than their taxonomy. Forage fish
populations are declining globally, subsequently increasing adverse impacts culturally,
ecologically, and economically (Mckechnie et al., 2014).
Although forage fish habitats are identified as critical fish habitat under the
Canadian Fisheries Act, making them protected, BC has little data regarding the location
and timing associated with these habitats (de Graaf, 2010). In response to this data gap, the
Sea Watch Society developed the Forage Fish Program (FFP), which involves potential
spawning site identification, as well as site surveying, mapping, and monitoring of two
forage fish species within BC, surf smelt and Pacific sand lance (de Graaf, 2013). The FFP
involves training volunteers and community groups along the coast of BC to identify
potential spawning sites of these two species and offer monitoring of these locations (de
Graaf, 2013).
In 2017, the Mount Arrowsmith Biosphere Region Research Institute (MABRRI) at
Vancouver Island University was trained to use the “vortex method” by a Nearshore and
Forage Fish Specialist from the Washington State Department of Fish and Wildlife. The
MABRRI team monitors beaches along the coast, as well as trains citizen scientists to do the
same in order to build the capacity of this project. Since 2017, other groups, including
Peninsula Stream Society, have begun monitoring and training citizen science groups to
further expand this initiative’s capacity and range. By regularly monitoring the beaches,
this initiative aims to reduce the current data gap that exists regarding forage fish
spawning habitat along the Vancouver Island and Gulf Island coastlines.
MABRRI created this quick reference document, in addition to the “Fisheries and
Oceans (DFO) Canada Management Areas: Vancouver Island” document, in order to aid in
the standardization of data collection and data referencing. Codes for locations across the
entirety of Vancouver Island and the Gulf Islands were created in order to retrieve site
specific data in a timely fashion. Each site that is sampled will have a corresponding code
that includes the regional district of Vancouver Island, the municipality and/or electoral
area, and the beach (Figure 1). This document includes the codes that were assigned to
each regional district, municipality, and electoral area.
Region Municipality Beach DFO Mngt Area
Figure 1. Location data as seen on data sheet (Appendix B)
Page 34 of 86Forage Fish Sampling: Location Codes
2.0 REGIONAL DISTRICT OF MOUNT WADDINGTON (RDMW)
2.1 Municipalities
PH - District of Port Hardy
Figure 3. District of Port Hardy.
Source: Google Maps Imagery (2017)
Figure 2: District of Port Hardy. Source: Google
Maps Imagery (2017) Figure 4: District of Port Hardy.
Source: Google Maps Imagery (2017)
PM – Town of Port McNeill
Figure 5: Town of Port McNeill. Source: Google Maps Imagery (2017)
Page 35 of 86Forage Fish Sampling: Location Codes
PO – Village of Port Alice AB – Village of Alert Bay
Figure 6: Village of Port Alice. Figure 7: Village of Alert Bay.
Source: Google Maps Imagery (2017) Source: Google Maps Imagery (2017)
2.2 Electoral Areas
RA
RB
RC
RD
Figure 8: Electoral Areas of the Regional District of Mount Waddington.
Source: Regional District of Mount Waddington Website (2017)
Page 36 of 86Forage Fish Sampling: Location Codes
3.0 STRATHCONA REGIONAL DISTRICT (SRD)
3.1 Municipalities
ZE – Village of Zeballos TA – Village of Tahsis
Figure 9: Village of Zeballos. Figure 10: Village of Tahsis.
Source: Google Maps Imagery (2017) Source: Google Maps Imagery (2017)
GR – Village of Gold River SA – Village of Sayward
Figure 11: Village of Gold River. Figure 12: Village of Sayward.
Source: Google Maps Imagery (2017) Source: Google Maps Imagery (2017)
Page 37 of 86Forage Fish Sampling: Location Codes
CR – City of Campbell River
Figure 15
Figures 13 – 15: City of Campbell River. Figure 14
Source: City of Campbell River Website (2017)
3.2 Electoral Areas
KN
CI
DM
BL
Figure 16: Electoral Areas of Strathcona Regional District. Source: Strathcona Regional District
Website (2013)
Page 38 of 86Forage Fish Sampling: Location Codes
4.0 COMOX VALLEY REGIONAL DISTRICT (CMVRD)
4.1 Municipalities
CU – Village of Cumberland CM – Town of Comox
Figure 17: Village of Cumberland. Figure 18: Town of Comox.
Source: Google Maps Imagery (2017) Source: Google Maps Imagery (2017)
CT – City of Courtenay
Figure 19: City of Courtenay.
Source: City of Courtenay Website (2015)
Page 39 of 86Forage Fish Sampling: Location Codes
4.2 Electoral Areas
BS
LN
PU
Figure 20: Electoral Areas of Comox Valley Regional District.
Source: Comox Valley Regional District Website (2017)
Page 40 of 86Forage Fish Sampling: Location Codes
5.0 ALBERNI-CLAYOQUOT REGIONAL DISTRICT (ACRD)
5.1 Municipalities
TO – District of Tofino UC – District of Ucluelet
Figure 21: District of Tofino. Figure 22: District of Ucluelet.
Source: Google Maps Imagery (2017) Source: University of British Columbia’s Department
of Geography (2005)
CP – City of Port Alberni
Figure 23: City of Port Alberni.
Source: Google Maps Imagery (2017)
Page 41 of 86Forage Fish Sampling: Location Codes
5.2 Electoral Areas
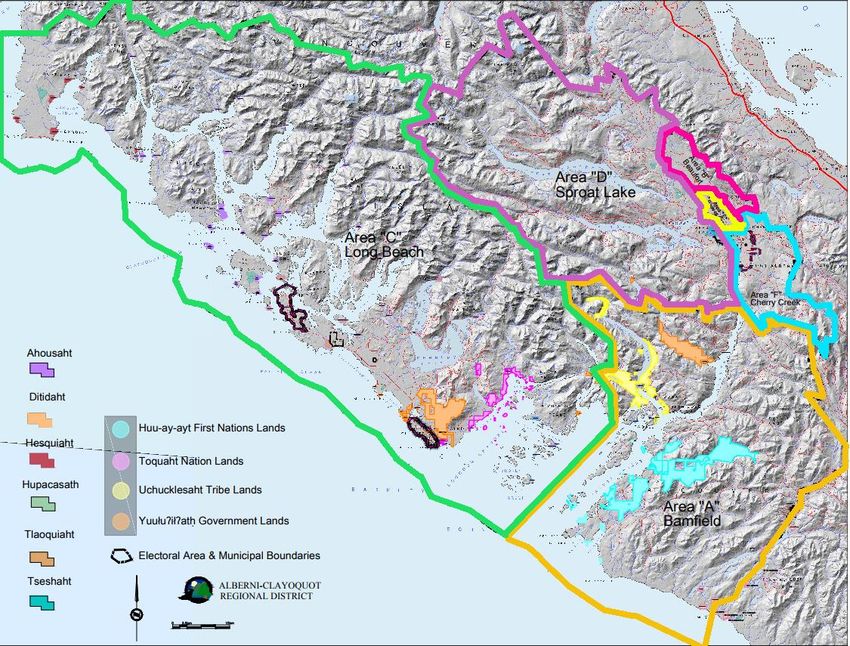
Figure 24: Electoral Areas of the Alberni-Clayoquot Regional District.
Source: Alberni-Clayoquot Regional District Website (2017)
BF LO
Page 42 of 86Forage Fish Sampling: Location Codes
6.0 REGIONAL DISTRICT OF NANAIMO (RDN)
6.1 Municipalities
NA – City of Nanaimo PK – City of Parksville
Figure 26: City of Parksville.
Source: Google Maps Imagery (2017)
Figure 25: City of Nanaimo.
Source: Google Maps Imagery (2017)
QB – Town of Qualicum Beach
Figure 27: Town of Qualicum Beach. Source: Google Maps Imagery (2017)
Page 43 of 86You can also read