Cécile Favre (IPAG, Grenoble) - Detection of weak transitions in forests of lines
←
→
Page content transcription
If your browser does not render page correctly, please read the page content below
Detection of weak transitions
      in forests of lines

             Cécile Favre
           (IPAG, Grenoble)

      Atelier « Spectro Bordeaux » – June 23, 2015   1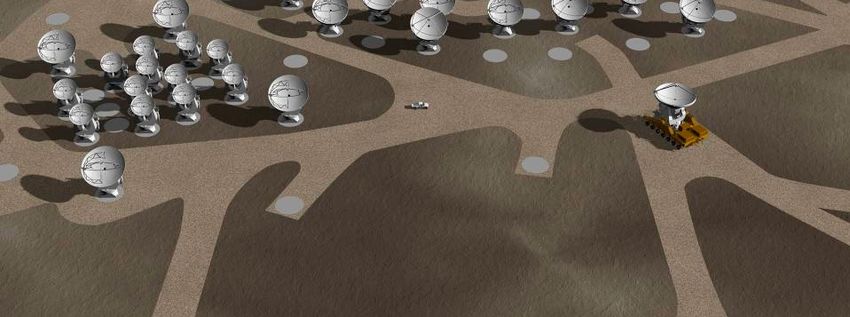
Simple & Complex molecules
  in the interstellar and circumstellar media

                            More than 180 molecules detected,
                             including ~63 complex species

                    Complex molecule: 6 or more atoms

http://www.astro.uni-koeln.de/cdms/molecules                    2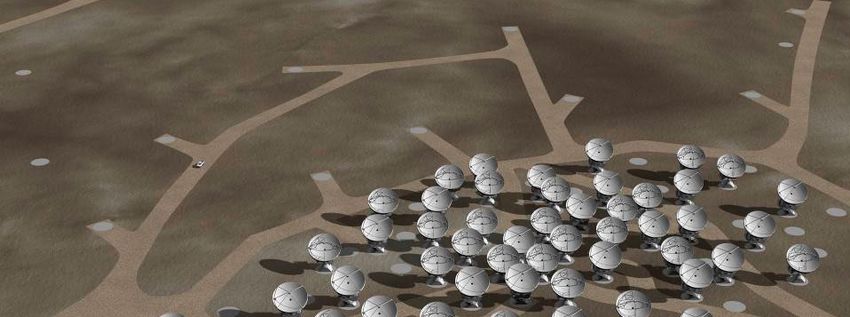
But …

             Many relatively weak
                    lines!

                            Tercero et al. (2010)
                            2 mm molecular survey of Orion-KL
Weeds & confusion           (IRAM-30m)                     3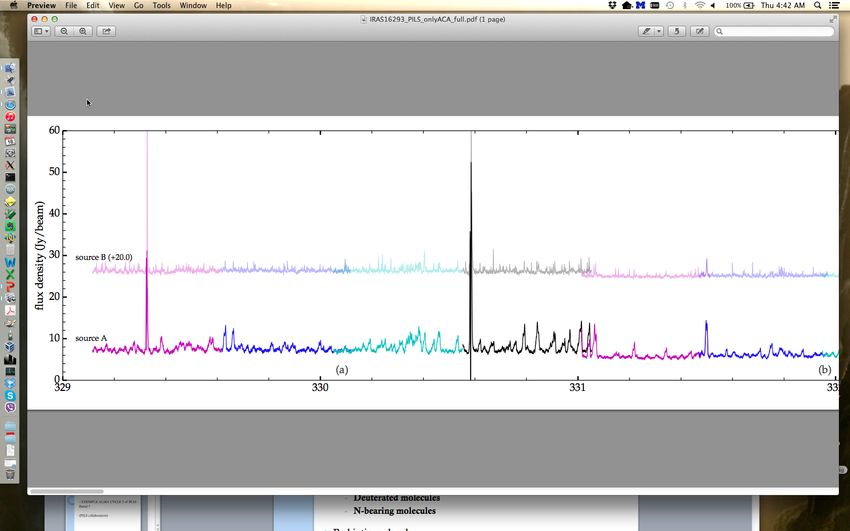
But …
Tercero et al. (2010)
2 mm molecular survey of Orion-KL
(IRAM-30m)
² Many lines (most peaks are real lines)
² Many unidentified (here ~31%)
² Many with a low intensity
such molecules have relatively low abundance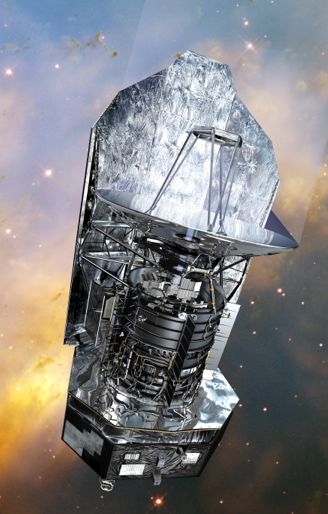
Outline
v Why looking for weak transitions/low abundance species?
v Observations: single-dish & Interferometric
ALMA
- High spectral resolution
- High angular resolution
- High sensitivity observations
v Interpretation and analysis of the data
- Spectroscopy (laboratory measurements)
- Modeling
- Survey (e.g. Herschel/HEXOS) along with modeling
5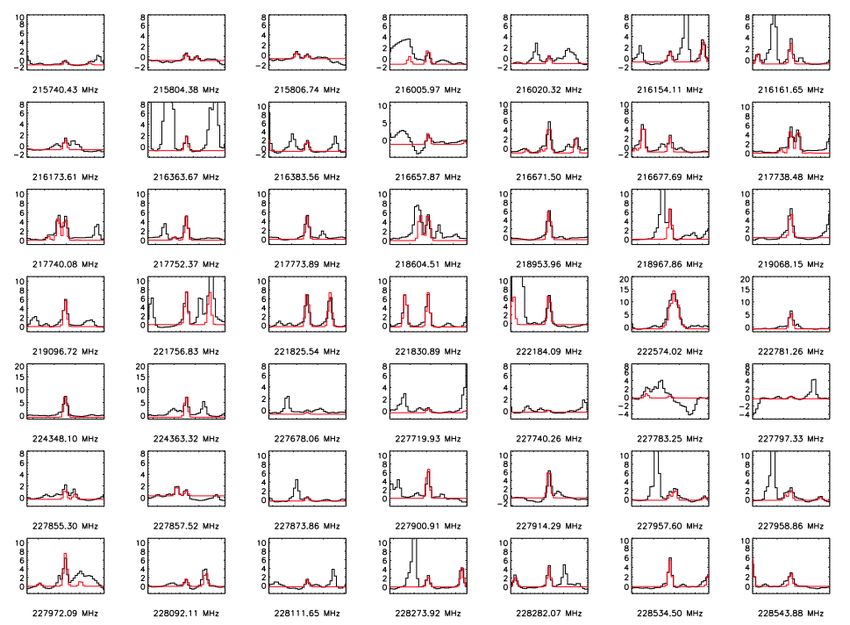
Low abundance complex organic molecules
Whether, how, when and where
complex organic molecules are
formed?
Involved physico-chemical
processes?
© NRAO
Observations (single-dish & interferometry)
Ø Physical conditions (temperature, density & structure)
Ø Formation mechanisms of molecules: grain mantle versus gas
phase controversy
Ø Prebiotic molecules
6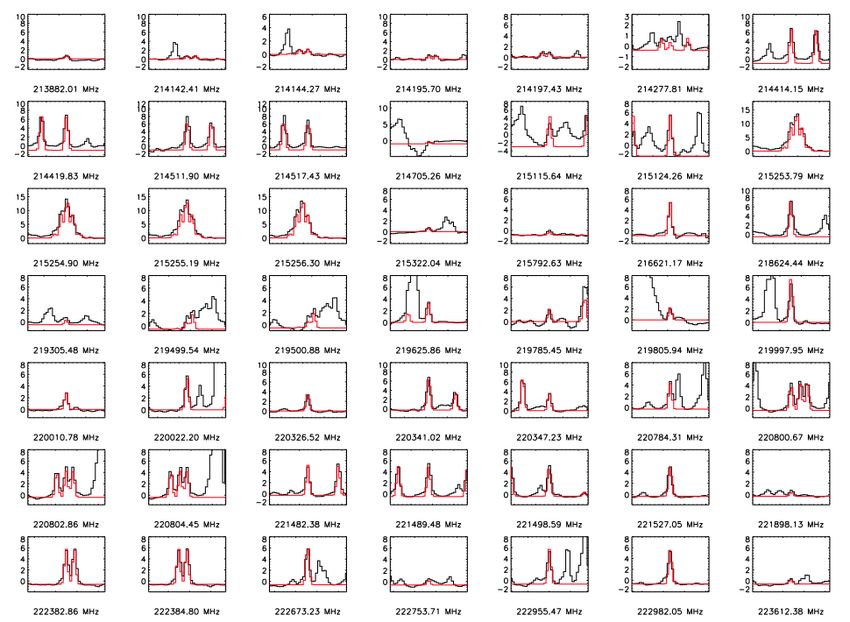
Outline
v Why looking for weak transitions/low abundance species?
v Observations: single-dish & Interferometric
ALMA
- High spectral resolution
- High angular resolution
- High sensitivity observations
v Interpretation and analysis of the data
- Spectroscopy (laboratory measurements)
- Modeling
- Survey (e.g. Herschel/HEXOS) along with modeling
7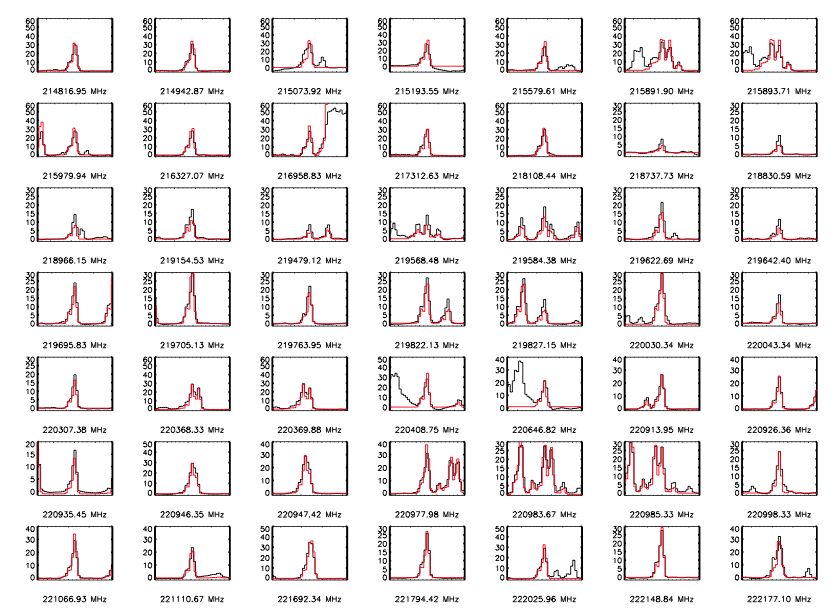
Spectral Resolution        Frequency    Beam       Spectral Resolution
                             (MHz)

      (’’X’’)

    (MHz)      (km.s-1)

                            101414

     3.8 X 2.0

    0.625         1.85

                            225855

     3.6 X 2.3

    0.313         0.42

                                                 Δv = 1.1 km/s
           Δv = 3.6 km/s

                                                                                  8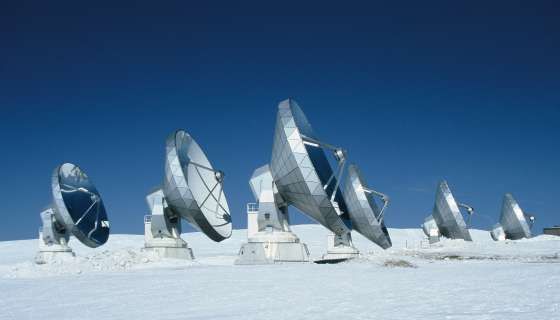
Angular Resolution                         T

                                                        Ethylene glycol

                                                                                                             SO2
                                                                          Formamide
                                            30m

                                                                                      IRAM-30m
                                                                                        (11’’)

       PdBI                30m beam

                                                                               Fréquence (MHz)
       beam

                                                  T                                                   PdBI

                                                      Ethylene glycol

                                                                            Formamide
                                                                                          (2.52’’ x 1.64’’)

                                                                                                             SO2
                 Ethylene glycol

                                                                                          U-line

             Brouillet et al. (2015)

PdBI                                                                           Fréquence (MHz)                     9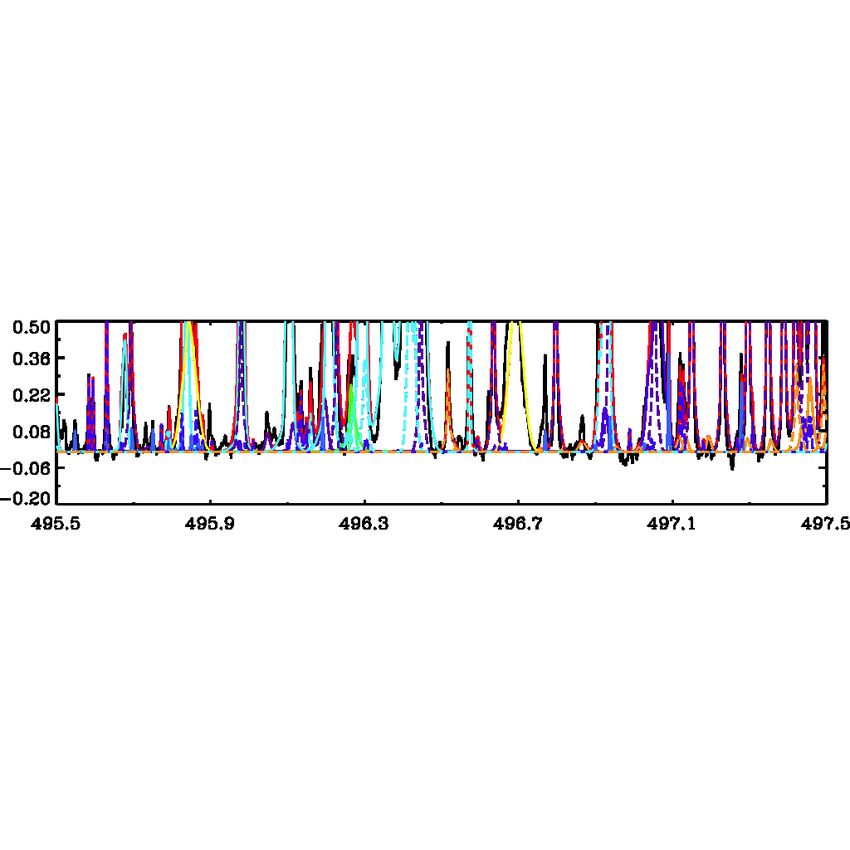
High Sensitivity for faint lines!
                                        Jørgensen, Favre et al. (2012)
     IRAS 16293-2422
Low-mass star forming-region
                                 ALMA observations (2.5’’ x 1.0’’)

       Rms (13 mJy/beam)
       Methyle formate HCOOCH3
                                         Glycolaldehyde CH2OHCHO
                                      First detection in a solar-type protostar! 10
High Sensitivity for faint lines!
IRAS 16293-2422
Cycle 2 data (Band 7)
Low-mass star forming-region
Portion of survey - ACA observations
(PHILS collaborations)
RMS < 100 mJy
11Outline
v Why looking for weak transitions/low abundance species?
v Observations: single-dish & Interferometric
ALMA
- High spectral resolution
- High angular resolution
- High sensitivity observations
v Interpretation and analysis of the data
- Spectroscopy (laboratory measurements)
- Modeling
- Survey (e.g. Herschel/HEXOS) along with modeling
12Spectroscopic Characterization
Accurate abundance ratios / Line identification
Ø Intensity calculation at different temperature
Ø Spectroscopic determination of transition frequencies,
assignments & line strengths
Ø Complete partition function
G29.96
Beuther et al. (2009)
T (Jy)
Rest Frequency [Mhz] 13Spectroscopy & Modeling
Accurate abundance ratios / Line identification
Ø Intensity calculation at different temperature
Ø Spectroscopic determination of transition frequencies,
assignments & line strengths
Ø Complete partition function
Databases: v CDMS (Cologne Database for Molecular Spectroscopy)
v JPL (Jet Propulsion Laboratory)
v Splatalogue
Spectroscopic journals & Collaboration with spectroscopists
Goal: characterize the physical parameters for each
species (Trot, Ncol, Δv, vLSR, θ) and spectral component
Line Analysis software: v XCLASS (Schilke et al. 2001)
v CASSIS (Caux et al. 2011)
v WEEDS (Maret et al. 2011)
14XCLASS Modeling of 12C- and 13C-HCOOCH3
ALMA-SV observations of Orion-KL
(1.7” x 1.1”)
HC Favre et al. (2014a)
156 transitions CR
167 transitions
HCOOCH3
HC
73 transitions CR
135 transitions
H13COOCH3
HC
67 transitions CR
122 transitions In collaboration with Isabelle Kleiner and Miguel Carvajal
HCOO13CH3
15XCLASS Modeling of 12C- and 13C-HCOOCH3
HCOOCH3 Favre et al. (2014a)
16XCLASS Modeling of 12C- and 13C-HCOOCH3
H13COOCH3 Favre et al. (2014a)
17XCLASS Modeling of 12C- and 13C-HCOOCH3
HCOO13CH3 Favre et al. (2014a)
18Tmb (K) Herschel/HEXOS survey of Orion-KL
Frequency (GHz)
T. BerginSurvey(s)
Herschel Herschel/HIFI/HEXOS fit template model spectra
for each emissive molecule in Orion-KL scan
Crockett et al. (2014)
©: ESA
v ~13,000 features have been identified
- 79 molecules (including isotopologues)
- 12% of U-line
Ø Line identifications
Ø Where the potential blend may exist
20Summary
Weak transitions/low abundance (complex) molecules,
including those of prebiotic interest, are detected toward
low-mass and high-mass star-forming regions
But ...
- Forests of lines
- still U-lines
² Need homogeneous datasets (large bandwidth, same resolution)
² High angular and spectral resolution
² Accurate laboratory spectroscopic measurements
² Merge the legacy of Herschel with future observations
² High sensitivity: Detection / Search for new molecules / Physical and
Chemical processes
² ALMA/NOEMA/IRAM-30m …
More complex spectra!
So much line signal that it is challenging
to define where the continuum is.
21Thank you
for your attention
22You can also read