Changes of Ownership of Hospital and Skilled Nursing Facilities: An Analysis of Newly-Released CMS Data
←
→
Page content transcription
If your browser does not render page correctly, please read the page content below
April 20, 2022

                                                                                                            HP-2022-14

               Changes of Ownership of Hospital and Skilled
                            Nursing Facilities:
                 An Analysis of Newly-Released CMS Data
              W. Pete Welch, Joel Ruhter, Arielle Bosworth, Nancy De Lew, and Benjamin D. Sommers

    KEY POINTS
          •     Data on health care provider ownership is an important tool in program integrity as well as a
                necessary input for informed policymaking to bolster competition in health care.
          •     This report analyzes newly-released data from the Centers for Medicare & Medicaid Services
                (CMS) on changes of ownership among hospitals and skilled nursing facilities (SNFs), based on
                information reported to CMS through the Provider Enrollment, Chain, and Ownership System
                (PECOS).
          •     Analysis of this dataset indicates that 348 hospitals and more than 3,000 skilled nursing facilities
                experienced a change in ownership between 2016 and 2021, with wide variation in hospital rates
                across states.
          •     Ownership changes were more common in medium and larger hospitals (compared to small
                hospitals), hospitals with negative profit margins, and long-term care hospitals.
          •     Future research can link this new dataset to other sources of information to support policymaking
                and research on consolidation, health care quality, and health care costs.

BACKGROUND
Data transparency about heath care provider ownership can serve important policy goals. A newly released
dataset from the Centers for Medicare & Medicaid Services (CMS) – posted on April 20, 2022 – tracks changes
of ownership among hospitals and skilled nursing facilities (SNFs), dating back to 2016.* The dataset will be
updated quarterly for public use. This report explores this new dataset and offers preliminary insights into how
these data on ownership changes can support policies bolstering competition in health care as well as ensuring
program integrity in Medicare and Medicaid.

CMS has the responsibility of minimizing fraud, waste, and abuse in the Medicare and Medicaid programs.
Because individual facilities found to have improper billing practices may be part of organizational patterns of
improper practices, better data on the owner and management relationships of health care facilities could
improve oversight. Having credible, accurate, and up-to-date ownership information could therefore safeguard
Medicare and Medicaid payments and patients.

_______________________
*   Data are available as of April 20, 2022, at: data.cms.gov

    aspe.hhs.gov                                                                                  DATA POINT           1
Publicly-available data on ownership changes will enable researchers and policymakers to have a more
detailed understanding of ownership of health care facilities and concentration of health care markets. These
data can also allow regulators to better track consolidation in health care provider markets and, in the long
run, support pro-competitive policies that can help reduce health care costs. A 2021 Executive Order directed
the Justice Department and Federal Trade Commission to review and revise their merger guidelines,1 and
timely data on provider ownership may aid in this process. Health care consolidation has significant impacts
on consumers, raising the importance of these issues.2
Ownership data may also be useful for tracking health care quality. For decades, ownership of SNFs has been a
public policy concern.3 Private equity and other private investment firms have purchased SNFs; in some cases,
new owners have sold the real estate assets to another entity under their control and then released the
building back to the original facility with substantial management and consulting fees. Critics contend that this
has forced SNFs to cut back on quality and, arguably, made them ill equipped to respond to the Covid-19
pandemic. Academic research on the impact of ownership structure on SNF performance shows that private
equity acquisition of SNFs is associated with increases in short-term mortality and shifts in resources from
patient care toward non-patient care items.4 Congress has also taken a recent interest in the role of private
equity ownership in health care.5 Understanding the impacts of different ownership types on the operation of
health care facilities is important for policymakers; combining the change of ownership data from CMS with
other data sources on organizational structures and ownership types may enable analyses of these important
policy issues.
DATA AND METHODS
To support provider enrollment in Medicare and basic program integrity functions such as tracking the
ownership of health providers to whom it submits payments, CMS established the Provider Enrollment, Chain,
and Ownership System (PECOS) in 2002.† To be paid by Medicare, providers must enroll in PECOS. When they
experience a change in ownership, they must update their owner data within 30 days. The data contained in
these files is self-reported to CMS by an institutional provider, and the three most prominent provider types
are hospitals, SNFs, and home health agencies.‡
Starting in April of 2022, CMS will post quarterly updates showing information from the PECOS on any changes
of ownership for hospitals and SNFs. For our analysis, we use the initial release of this dataset, which contains
information on ownership changes starting in 2016; while partial data are available for 2022, we limit our
study period to 2016-2021. While the PECOS dataset itself is not new, information on ownership changes will
now be much more easily accessible by researchers and the general public through this CMS data release.
In total, three files are being released for hospitals and another three for SNFs. Separately for hospitals and
SNFs, there are two keys files each for our analysis. The first file pertains to change of ownership (which we
refer to in this report as a “sale,” though roughly 15 percent of hospitals transactions were mergers; the rest of
hospital changes and all SNF changes were sales). The second file describes the provider’s owners, both before
(“sellers”) and after (“buyers”) the sale.§ In principle, each provider that was sold can be merged with the
owner file, using the CMS Certification Number (CCN).
PECOS makes the distinction between “direct” owners, who have no subsidiary between them and the
provider, and “indirect” owners, who have one or more level of subsidiaries between them and the provider.
_______________________
† This paper treats “facility” and “provider” as synonyms.
‡ The application form has instructions for filers. https://www.cms.gov/Medicare/CMS-Forms/CMS-Forms/CMS-Forms-
Items/CMS019475, accessed 3-30-2022.
§ The third file for hospitals and SNFs pertains to the providers’ National Provider Identifiers (NPIs).
APRIL 2022 DATA POINT 2PECOS requires somewhat different information from owners that are organizations and those who are
individuals. All owners with an ownership share of at least 5% must be reported (along with their ownership
share), whether they are direct or indirect owners.
In this report, we provide statistics on time trends in hospital and SNF changes of ownership, and the number
of organizational owners for providers experiencing ownership changes. We then explore state-level rates of
hospital ownership changes and descriptive characteristics of hospitals experiencing changes of ownership,
including hospital type, numbers of beds, and profitability. Denominators on the numbers of providers used in
our analyses were derived from Medicare cost reports.
RESULTS
Over the period from 2016 to 2021, 348 hospitals and 3,236 SNFs were sold.** This equates to 9.8 per 1,000
hospitals per year, and 39.9 per 1,000 SNFs per year. Figure 1 presents the annualized rate of sales by
quarter.††
Figure 1. Changes of Ownership, by Hospital and SNFs per 1000, by Quarter (Annualized),
2016-2021
90
Changes of Ownership, by Hospital and SNFs per
80
70
1,000, by Quarter, Annualized
60
50
40
30
20
10
-
Q1 2021
Q1 2016
Q2 2016
Q3 2016
Q4 2016
Q1 2017
Q2 2017
Q3 2017
Q4 2017
Q1 2018
Q2 2018
Q3 2018
Q4 2018
Q1 2019
Q2 2019
Q3 2019
Q4 2019
Q1 2020
Q2 2020
Q3 2020
Q4 2020
Q2 2021
Q3 2021
Q4 2021
Hospitals SNFs
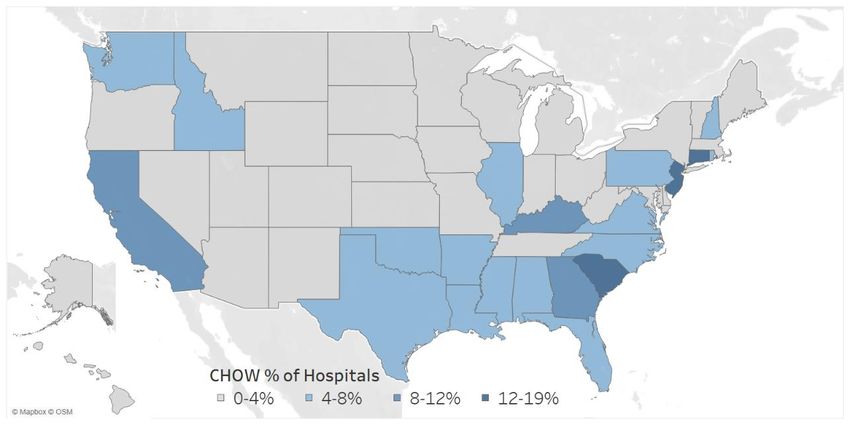
Nationally, 4.6% of hospitals were sold over the full study period. The rate at which hospitals were sold varied
by state, as reported in Figure 2. South Carolina had the highest rate of hospital ownership change; of its 73
_______________________
** The hospital file has 489 records. However, after apparent duplicate records were removed, only 348 hospitals remained. The most
common reason for removal pertains to special units within hospitals (e.g., rehabilitation). When there were two or three records with
a similar CCN with the same seller and effective date, the special unit records were removed.
†† The quarterly changes of ownership change were annualized by being multiplied by 4.
APRIL 2022 DATA POINT 3hospitals, 14 (19.2%) changed ownership during this six-year period. Kentucky, New Jersey, and Connecticut
also had rates above 10%. A majority of states had rates of 4% or lower.
Figure 2. Rate of Changes of Hospital Ownership, by State, 2016-21
Tables 1 and 2 provide information on ownership and other features for providers experiencing changes of
ownership during the study period. Most hospitals and SNFs in the dataset are owned by one organization, but
sometimes they are owned by individuals or by more than one organization. Table 1 summarizes the number
of organizational and individual owners of entities that underwent a change of ownership; the table provides
this information for the new owners (i.e. buyers). In accordance with statute and subsequent PECOS
submission instructions, buyers are not required to submit data on individuals or organizations that have less
than a 5% ownership interest. Therefore, the count of sales in Table 1 is lower than the totals reported at the
beginning of this section.
As shown in Table 1, the vast majority of purchased hospitals (85.5%) have a single direct organizational
owner, while 6.4% have multiple organizational owners but no individual owners with at least 5% interest. Less
than 10% of hospitals are purchased by individual owners. On the other hand, 62.3% of purchased SNFs have a
single organizational owner, while 18.2% have only individual owners.
APRIL 2022 DATA POINT 4Table 1. Organizational vs. Individual Owners, as a Percentage of Sales,
Hospitals and SNFs, 2016-2021
Hospitals
# of Organizational Owners # of Individual Owners
0 1 2+ total
0 0.0% 3.2% 0.7% 3.9%
1 85.5% 2.8% 1.1% 89.4%
2+ 6.4% 0.4% 0.0% 6.7%
Total 91.8% 6.4% 1.8% 100.0%
N=282 sales
SNFs
# of Organizational Owners # of Individual Owners
0 1 2+ total
0 0.0% 4.9% 13.3% 18.2%
1 62.3% 2.7% 5.5% 70.4%
2+ 6.9% 1.7% 2.8% 11.4%
Total 69.2% 9.3% 21.6% 100.0%
N=3,023 sales
Note: These figures pertain the direct owners after the sale (“buyers”).
Table 2 presents rates of ownership changes among hospitals by hospital characteristics. Smaller hospitals (25
beds or fewer) were rarely sold (0.8%), compared to medium and larger hospitals. Urban hospitals were sold at
higher rates than rural ones (5.6% vs. 3.3%). Hospitals with the lowest profit margins (negative 2% or worse)
were sold most often, more than twice as often as those with the highest profit margins (8.3% vs. 3.0%). Long-
term care hospitals were sold at substantially higher rates than other hospitals. General short-term and
rehabilitation hospitals were sold at roughly the national rate, with psychiatric hospitals and other hospitals
sold at substantially lower rates. Only one critical access hospital out of 1,330 was sold.
APRIL 2022 DATA POINT 5Table 2. Rate of Changes of Hospital Ownership, by Hospital Characteristics, 2016-21
Characteristic Total Hospitals # Hospitals with a % Hospitals with a
(A) Change of Ownership (B) Change of Ownership (B/A)
# of Beds (by quartile)
Highest (175 or more) 1,487 70 4.7%
nd
2 highest (65-174) 1,467 93 6.3%
3rd highest (26-64) 1,172 92 7.8%
Lowest (25 or fewer) 1,668 13 0.8%
Hospital type
General Short 4,381 205 4.7%
Psychiatric 558 12 2.2%
Long-Term Care 347 33 9.5%
Rehabilitation 287 13 4.5%
Other 157 3 1.9%
Location
Urban 3,413 190 5.6%
Rural 2,317 76 3.3%
Profit Margin (by quartile)
Highest (>11%) 1,639 49 3.0%
2nd highest (4% - 11%) 1,399 42 3.0%
3rd highest (-2- 4%) 1,377 63 4.6%
Lowest (associated with the likelihood of a change in ownership and the impact of such changes. For example, are facilities with lower performance more or less likely to be sold to facilities with higher levels of performance? Does performance improve or decline after sale? Another possible topic for future work involves “ultimate parents.” Federal statute, pertaining to certain agencies such as the Securities and Exchange Commission, generally defines an “ultimate parent” as an entity with subsidiaries but not a subsidiary of another entity. The “ultimate parent” definition and associated regulations do not technically apply to Medicare; nevertheless, the term will be used here for illustrative purposes. All Medicare providers are required under statute to identify indirect owners, including “ultimate parents,” that hold a 5% or greater ownership interest in the providers.‡‡ Based on the reasonable assumption that every “ultimate parent” holds at least a 5% ownership interest in a provider—otherwise it wouldn’t ostensibly be the ultimate parent—CMS currently requires the reporting of “ultimate parents.” However, CMS cannot verify whether providers, in general, are accurately reporting “ultimate parents” or any other owners in the ownership chain; ownership data is self-reported and there is no centralized database to which CMS can compare the self-reported information. Without validation of PECOS’ self-reported data, organizations with the same “ultimate parent” could appear to be independent. Identifying “ultimate parents” is necessary for calculating concentration and analyzing market structure. Several proprietary databases have changes of ownership that are reported in the press. A possible research strategy would use these two types of databases to determine whether an indirect owner in PECOS is an “ultimate parent” and, if not, what entity is its “ultimate parent.” Additional analyses could explore provider quality, including frequency of violations or other concerns. Future ASPE analyses will explore the new CMS data further, including potential examination of rates of ownership change among SNFs by state and provider characteristics, and further linkages of hospital data with outside information on hospital-level and market-level characteristics. _______________________ ‡‡ Social Security Act § 1124. APRIL 2022 DATA POINT 7
REFERENCES
1
  Executive Order on Promoting Competition in the American Economy https://www.whitehouse.gov/briefing-
room/presidential-actions/2021/07/09/executive-order-on-promoting-competition-in-the-american-economy/
2
  Medicare Payment Advisory Commission, “Congressional request on health care provider consolidation,
Chapter 15 in “March 2020 Report to the Congress: Medicare Payment Policy.” March, 2020.
3
  M Goldstein, J Silver-Greenberg, & R. Gebeloff, “Push for Profits Left Nursing Homes Struggling to Provide
Care,” New York Times May 7, 2020. https://www.nytimes.com/2020/05/07/business/coronavirus-nursing-
homes.html. Accessed 4-12-22.
4
  Gupta, Atul, et al. Does private equity investment in healthcare benefit patients? Evidence from nursing
homes. No. w28474. National Bureau of Economic Research, 2021.
5
  U.S. House Committee on Ways and Means, Oversight Subcommittee. Oversight Subcommittee Hearing on
Examining Private Equity’s Expanded role in the U.S. Health Care System. March 25, 2021.
https://waysandmeans.house.gov/legislation/hearings/oversight-subcommittee-hearing-examining-private-
equity-s-expanded-role-us. MedPAC published “Congressional request: Private equity and Medicare,” Chapter
3 in “Report to the Congress, Medicare and the Health Care Delivery System,” June 2021.
6
  Ellison, Ayla. State by State Breakdown of 37 Critical Access Hospital Closures. Becker’s Hospital Review.
March 2, 2022. https://www.beckershospitalreview.com/care-coordination/state-by-state-breakdown-of-37-
critical-access-hospital-closures.html

    APRIL 2022                                                                         DATA POINT       8
HP-2022-14 U.S. DEPARTMENT OF HEALTH AND HUMAN SERVICES Office of the Assistant Secretary for Planning and Evaluation 200 Independence Avenue SW, Mailstop 447D Washington, D.C. 20201 For more ASPE briefs and other publications, visit: aspe.hhs.gov/reports ABOUT THE AUTHORS W. Pete Welch is a Senior Analyst in the Office of Health Policy in the Office of the Assistant Secretary for Planning and Evaluation (ASPE). Joel Ruhter is an Analyst in the Office of Health Policy in ASPE. Arielle Bosworth is an Economist in the Office of Health Policy in ASPE. Nancy De Lew is the Associate Deputy Assistant Secretary for the Office of Health Policy in ASPE. Benjamin D. Sommers is the Deputy Assistant Secretary of the Office of Health Policy in the Office of Assistant Secretary for Planning and Evaluation SUGGESTED CITATION Welch, W.P., Ruhter, J., Bosworth, A., De Lew N., and Sommers, B.D. Changes of Ownership of Hospital and Skilled Nursing Facilities: An Analysis of Newly-Released CMS Data (Issue Brief No. HP-2022-14). Office of the Assistant Secretary for Planning and Evaluation, U.S. Department of Health and Human Services. April 2022. COPYRIGHT INFORMATION All material appearing in this report is in the public domain and may be reproduced or copied without permission; citation as to source, however, is appreciated. DISCLOSURE This communication was printed, published, or produced and disseminated at U.S. taxpayer expense. ___________________________________ Subscribe to ASPE mailing list to receive email updates on new publications: https://list.nih.gov/cgi-bin/wa.exe?SUBED1=ASPE-HEALTH-POLICY&A=1 For general questions or general information about ASPE: aspe.hhs.gov/about APRIL 2022 DATA POINT 9
You can also read