Rock slope kinematic analysis for planar failure: A probabilistic approach - E3S Web of ...
←
→
Page content transcription
If your browser does not render page correctly, please read the page content below
E3S Web of Conferences 340, 01017 (2022) https://doi.org/10.1051/e3sconf/202234001017
The 13th AIWEST-DR 2021

 Rock slope kinematic analysis for planar failure: A probabilistic
 approach
 Ibnu Rusydy1,7*, Mulkal Mulkal2, Haqul Baramsyah2, Hendri Ahmadian3, Hamzah Hussin4, Nafisah Al-Huda1,5,
 Marwan Marwan6
 1Geological Engineering Department, Engineering Faculty, Universitas Syiah Kuala, Indonesia
 2Mining Engineering Department, Engineering Faculty, Universitas Syiah Kuala, Indonesia
 3Information Technology Department, Faculty of Science and Technology, UIN Ar-Raniry, Indonesia
 4Department of Geoscience, Faculty of Earth Science, Universiti Malaysia Kelantan, 17600 Jeli, Kelantan, Malaysia
 5Civil Engineering Department, Engineering Faculty, Universitas Syiah Kuala, Indonesia
 6Geophysical Engineering Department, Engineering Faculty, Universitas Syiah Kuala, Indonesia
 7Tsunami and Disaster Mitigation Research Center (TDMRC), Universitas Syiah Kuala, Indonesia

 Abstract. The probabilistic kinematic analysis for rock slope has been conducted on one slope along
 USAID road in Aceh Province, Indonesia. This research aims to develop the modelled probability density
 function (PDF) and determine the probabilistic of planar failure occurrence (Pop). The geometry of
 discontinuity planes (dip and dip directions) and slope geometry (slope angle and slope face) were collected
 from our previous study. One slope with planar failure criteria was selected. The Monte Carlo simulations
 were performed in generating 100 new random values in 100 time iterations to produce modelled PDFs for
 the geometry of discontinuity plans based on statistical parameters of field observed data. The probabilistic
 of each experimental PDFs were computed to produce the probabilistic of planar failure occurrence. The
 result reveals that the distribution of dip and dip directions for experimental PDFs are considered Beta and
 Normal distributions. The statistical parameters produced in the model are almost likely similar to observed
 data. It means the model that was developed are reliable and conscientious. The rule of Φ < βj < βs and dip
 directions (αj) within ±20o to slope face (αs) are utilised as the boundaries to calculate the probabilistic of
 planar failure occurrence (Pop) which revealing 0.26.

 1 Background assumed as a deterministic approach picking the mean
 values from stereography as a single value. The
 Rock slope failure analysis for mining and civil projects probabilistic rock slope kinematic analysis has been
 has attracted rock engineers to develop numerous introduced by numerous researchers [8–10], considering
 methods to analyse the rock slope stability, including the the effect of variability of joint orientations.
 rock slope kinematic analysis, limit equilibrium, Furthermore, the probability of planar failure due to
 numerical modelling, empirical approach, and rock variability of structural features have been conducted by
 mass classification [1–5]. In a conventional approach, Rahim et al. [11] and Farhan and Rai [12] and give
 those methods merely concern a single input parameter reliable results. The comprehensive study on how the
 value known as deterministic, and it previously applies variability of discontinuity plane drives the planar
 in deterministic slope kinematic analysis. Nevertheless, failure of rock slope is elaborated and scrutinised in this
 the rocks' physical, mechanical, and structural paper. Hence, this study aims to develop the modelled
 properties vary from point to point and naturally in rock probability density function (PDF) and determine the
 [6]. Thus, the conventional approach is required to be probabilistic of planar failure occurrence (P ) at USAID
 op

 improved obviously to the probability approach highways rock slope in Aceh province, Indonesia.
 considering the uncertainty of geological structural data Overall, this paper discusses the deterministic
 collected from the surface of rock slope to increase the kinematic analysis, which previously has been
 reliable result in slope design and prevention measure. conducted by Rusydy et al. [5] for Slope 1, revealing the
 The rock slope kinematic analysis approach studies planar failure potential at the joint set (J2). The data
 the typology of slope failure without any consideration were then re-analysed by performing Monte Carlo
 of the force working on the slope [2,5,7]. The type of simulation to generate a large number of random values
 potential failures determined in the rock slope kinematic based on statistical parameters from the joint set (J2).
 approach was based on the stereography interpretation, The probabilistic kinematic analysis was conducted to
 which has been successfully conducted by numerous determine the probabilistic of planar failure occurrence
 researchers [2,5,7]. However, their approaches are

 * Corresponding author: ibnu@unsyiah.ac.id

© The Authors, published by EDP Sciences. This is an open access article distributed under the terms of the Creative Commons Attribution
License 4.0 (http://creativecommons.org/licenses/by/4.0/).
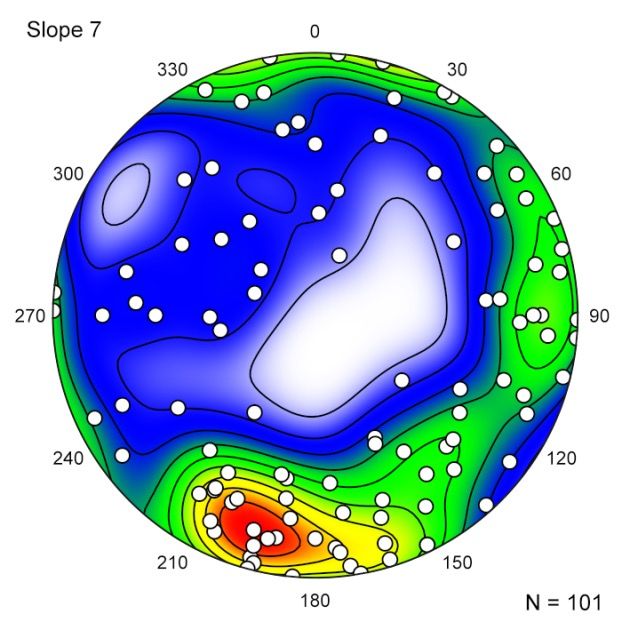
E3S Web of Conferences 340, 01017 (2022) https://doi.org/10.1051/e3sconf/202234001017
The 13th AIWEST-DR 2021

 (P ) and how the variability of joint and slope
 op

 geometries influence the failure.

 2 Methodology
 This research was conducted at the rock slopes along
 USAID highways side, build after Indian Ocean
 Tsunami hit Aceh province. During construction, a
 multitude of rock slopes have been exposed; hence, Joint Set

 some slopes are vulnerable and need to be investigated
 (J2)

 Fig. 2. Stereography projection plot for Slope 1 from
 and analysed. The dip and dip direction of discontinuity Rusydy et al. [5], Joint set (J2) in red line formed the planar
 planes (e.g. joints, bedding) on the rock slopes were failure mode.
 recording directly employing geological compass by
 Rusydy et al. [2,5,7,13]. The dip and dip direction projection model (see Fig. 2). The mean of plane
 discontinuity planes data were plotted in stereographic orientations (β and α ) are determined from Orient
 j j

 projection to determine the number of planes most likely software as the joint sets. Those joint sets combine with
 having a similar direction with the slope face, and the the orientation of slope (β and α ) and friction angle (Φ)
 s s

 dips of planes are higher than friction angle (Ф) but are deployed to determine the typology of failures (e.q.
 lower than slope angle. The Alejano et al. [14] suggested planar, wedge, toppling). Using the mean of plane
 method was utilised in this study to determine the basic orientation without considering the variability of those
 friction angle. orientations is known as the deterministic approach.
 Ten rock slopes have been investigated by Rusydy
 et al. [2] and Rusydy et al. [5], employing the scan-line
 2.1 Rock slope kinematic analysis method. Four from ten slopes are potentially had planar
 failure refer to deterministic kinematic analysis.
 Rock slope kinematic analysis is associated with the Nonetheless, this paper merely discusses one slope as an
 rock slope movement process without considering the example to introduce the probabilistic approach in
 forces working the rock slope. This approach is analysing the planar failure probabilities.
 introduced by Hoek & Bray [15] and Goodman [16]. Planar failure is a common failure typology in rock
 The analysis and calculation are stands on the slope stability study; nevertheless, it requires numerous
 stereography projection, which are projected in the dip geometric circumstances to occur. Wyllie and Mah [18]
 (β ) and dip direction of discontinuity planes (α ), which
 j j
 noted that the planar failure occurs when the dip
 is 3D into the 2D model [2,5,7]. Other input data direction of joint planes (α ) are within ±20° to the slope
 required in the kinematic analysis is friction angle (Φ)
 j

 face (α ). The following condition to planar failure to
 determined by employing the tilt testing suggested by
 s

 occur is when the dip of joint (βj) is lower than slope
 Alejano et al. [14]. angle (βs), yet it must be higher than friction angle (Φ),
 The Orient software developed by Vollmer [17] was or in another way it can be written as Φ < βj < βs. The
 utilised in this research to produce a stereography last circumstances is a present of tension crack in the
 upper part of the slope, as denoted in Fig. 1. In this
 Upper Slope
 study, those circumstances play a crucial role as the
 Tension boundaries in determining probabilistic of planar failure
 Slope Crack occurrence except the presence of tension crack due to
 Face it is undefined in the field.

 Joint 2.2 Probabilistic kinematic analysis
 βs βj Ф
 Probabilistic analysis is performed when the field data
 are insufficient or burdensome to assign a single value
 N to calculate the model. Probabilistic describe the degree
 of belief in the truth of circumstances [19]. Hence, this
 Ф study revealed probabilistic values between 0 and 1 to
 express the degree of belief for planar failure to occur.
 Slope Obregon and Mitri [20] argued that the probability of
 270
 Face
 90 failure for slope stability could be computed by
 encountering two models (series and parallel)
 influenced by numerous parameters. The series model is
 Joint described as a single line from starting point to the end.
 If one parameter fails, it could trigger the rock slope
 270
 failure. While in the parallel system, it requires all
 Fig. 1. Geometric circumstances for Plane failure (a) The failure components to trigger the rock slope failure. The
 graphic view of planar failure, (b) stereography projection,
 after modified from Wyllie & Mah [18].

 2
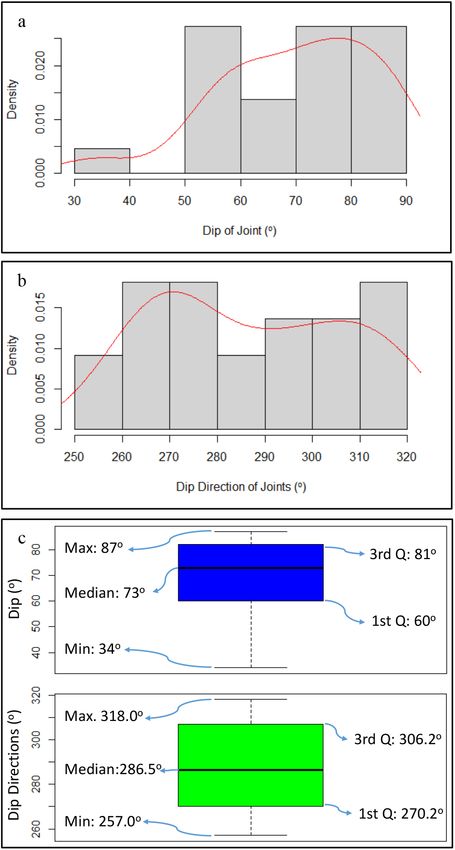
E3S Web of Conferences 340, 01017 (2022) https://doi.org/10.1051/e3sconf/202234001017
The 13th AIWEST-DR 2021

 planar failure in rock slope is more likely similar to the
 parallel system requiring at least two geometric
 circumstances to slope to have planar failure as
 mentioned previously (Φ < βj < βs) as the first
 component and the second component is dip direction
 (α ) within ±20° to the slope face (α ), please see Fig. 3.
 j s

 According to Obregon and Mitri [20], the probability of
 all components are expressed as P[p Ո p … Ո p ]. It
 1 2 N

 means the failure could happen in a parallel system
 when all components fail, and in probability analysis,
 they have an intersection relationship.
 The probabilistic of failure (Pf) for parallel system
 failure in rock slope can be simplified as denoted in
 Equation 1. This rule assumes all the parameters (N)
 governing the rock failure are independent and has their
 probabilities (Pi).

 = ∏(
 )*) ( ) (1)

 Naturally, the values of dip direction (α ), dip (βj),
 j

 and friction angle (Φ) vary from site to site, from point
 to point while the slope angle (βs) and slope face (α ) s

 have a single value. The variability α , βj, and Φ lead to
 j

 uncertainty; accordingly, the probabilistic kinematic
 analysis approach is necessary to cope with this
 variability. The probabilistic density function (PDF) of
 α and βj were generated at the first stages utilising the
 j

 R programming software, while the Φ is assuming as a
 single value. The example of PDFs and histograms in
 this study is denoted in Fig. 4.
 After the dip and dip direction PDFs are developed,
 the kinematic instability is quantified as the probability
 of pole or plane triggering the failure mechanism. The
 probabilistic of planar failure occurrence (P ) is written
 op

 in Equation 2 as suggested by Obregon and Mitri [20].

 +, = . ≤ 2 ≤ 3 4. . 3 − 20+ ≤ 2 ≤ 3 + 20+ 4 (2)

 Fig. 4. (a) The Histogram, (b) PDF, and (c) Boxplot of joint
 βj geometries for Slope 1 joint set 2 (J2).
 Probability

 βs Φ < βj < βs The number of observations for the joint set (J2) is
 merely 22 data, and it is insufficient to perform the
 INPUT OUTPUT probabilistic analysis directly from the PDF of field
 Φ observed data. Thus, the Monte Carlo simulation was
 performed to generate large new random values based
 Probability
 αj on statistic characterisation from field observed data (βj,
 αs - 20o ≤ αj α ) distributions (see Fig. 3). 100 new data have been
 j

 αs + 20o ≥ αj generated in 100x iteration for dips and dip directions
 αs
 using R data analysis software. As denoted in Fig. 4, the
 dip of joints has a Beta distribution typology while the
 Fig. 3. Parallel system for planar failure in this study dip direction is recognised as Normal distribution
 typology. In performing the simulation for Beta
 distribution, it requires the Shape1, and Shape2 from
 2.3 Monte carlo simulation observed data. The EnvStats package in R programming
 software developed by Millard [23] was employed to
 The Monte Carlo simulation was run in this study to determine the Shape1 and Shape2 values from field
 generate large numbers of dips and dip directions. This observed data. Due to the dip direction data distribution
 simulation is the most common approach in stochastic is assumed as a normal distribution, it merely requires
 analysis in that the random values to the model is the mean (μ) and standard deviation (σ) values.
 generated from sampled statistical distribution or
 frequency distributions like histograms and probability
 density function (PDF) [21,22].

 3
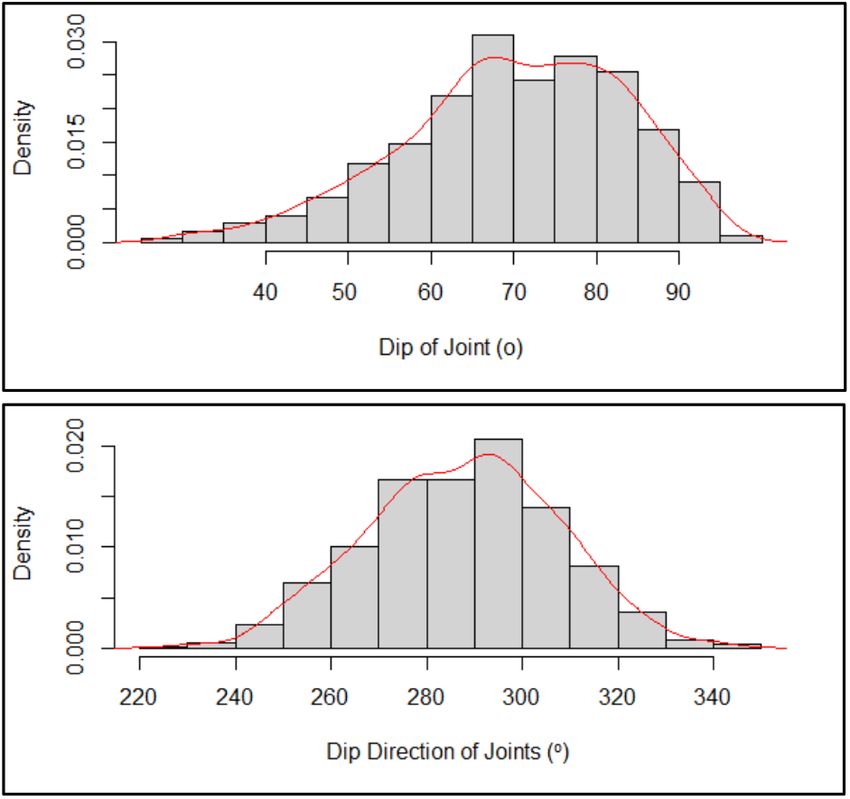
E3S Web of Conferences 340, 01017 (2022) https://doi.org/10.1051/e3sconf/202234001017
The 13th AIWEST-DR 2021

 3 Results 5. Even though the range of the dip from the observed
 data is 34 to 87, the Monte Carlo simulation reveals bit
 The observed data distributions are the key in higher data than expected. Yet, this simulation result is
 developing the experimental model utilising the Monte reliable, and the first quarter (Q1) and the third quarter
 Carlo simulation; accordingly, the result of (Q3) are similar to observed data. The distribution of dip
 experimental models varies from 100x of iteration, and direction experimental histogram and PDF is considered
 probabilistic kinematic analysis for J2 discusses. as normal distribution where the median and mean value
 are almost likely similar.
 3.1 The experimental models Fig. 6 denotes the boxplots of experimental data in
 a different iteration, the number of iteration as shown in
 The EnvStats R package was employed for Beta the x-axis. The boxplot reveals the minimum, Q1,
 distribution and revealed the Shape1 value for a dip of median, Q3, and maximum values sequentially from the
 joints is 7.753, and Shape2 is 3.324 from observed data bottom to the top. From 100 iteration, the median values
 (J2). Furthermore, the dip direction was recognised as of dip vary from 66.41 to 75.51 , while the actual
 o o

 Normal distribution, having 287.136 of μ and 20.185 of median value from field data is 73 . The field observed o

 σ. The experimental distribution was developed by median value for dip direction is N 286.5 E, whilst the o

 employing those statistical parameters. modelled values fluctuate in 100 times iteration from
 In developing experimental distribution, 100 times N 276.9 E to N 295.3 E as shown in Fig. 6.
 o o

 iteration was run for 100 data, and all those simulations
 are plotted in one histogram and PDF as denoted in Fig. 3.2 Probabilistic kinematic
 After all simulated models reveal reliable results, the
 next stage is computing the probabilistic planar failure
 occurrence (P ) employing Equation 2. The geometric
 op

 circumstances for planar failure are played an essential
 role as the boundaries in calculating the probabilistic to
 dip and dip direction in the PDF model.
 According to Rusydy et al. [5], the investigated
 slope has 27 of friction angle (Φ ) and the slope angle
 o

 (βs) is 70 ; accordingly, those data are utilised as
 o

 boundaries in a dip of joint PDF curve to estimate the
 area between them. The area of 0.47 represents the
 probability of the first component as denoted in Fig. 7a;
 obviously, this area is calculated in R programming
 software. The second component as shown in Fig. 7b,
 0.56 probability, act as the probability of dip direction
 (α ) toward ±20° to the slope face (α ). In this research,
 j s

 the slope facing to N 289 E; means any joints having
 o

 Φ < βj < βs
 Fig. 5. The Experimental Histogram and PDF joint
 geometries for Slope 1 joint set 2 (J2) with N=100 and
 iteration 100 times. The Dip has Beta distribution typology, Ф = 27o
 whilst the Dip direction has Normal distribution.
 βs= 70o
 Dips (o)

 αs = 289o
 αs + 20o
 Dip Direction (o)

 0.56

 αs - 20o

 Number of Iterations
 Fig. 7. The Experimental PDFs for a). Dips, b). Dip
 Fig. 6. Box plot of experimental data distributions from 100x directions for Slope 1 joint set 2 (J2).
 iterations for dip and dip direction simulations

 4
E3S Web of Conferences 340, 01017 (2022) https://doi.org/10.1051/e3sconf/202234001017
The 13th AIWEST-DR 2021

 dip direction ≥ N 268 E to ≤ N 309 N are categorised as
 o o
 References
 planar failure potential.
 1. H. Basahel and H. Mitri, Int. J. Min. Sci. Technol.
 Table 1. Summary of fitted parameters for joint orientations
 29, 357 (2019)
 Data Geometry Distributions Parameters* 2. I. Rusydy, N. Al-Huda, M. Fahmi, and N. Effendi,
 Struct. Durab. Heal. Monit. 13, 379 (2019)
 Shape1 = 7.753
 3. I. Rusydy, T. F. Fathani, N. Al-Huda, Sugiarto, K.
 Observed Data

 Dip Beta
 Shape2 = 3.324 Iqbal, K. Jamaluddin, and E. Meilianda, Environ.
 Dip Mean = 287.136 Earth Sci. 80, 1 (2021)
 Direction
 Normal 4. H. Gunawan, N. Al-Huda, M. Sungkar, A.
 Sd = 20.185
 Yulianur, and B. Setiawan, IOP Conf. Ser. Mater.
 Shape1 = 7.500 Sci. Eng. 796, 12044 (2020)
 Experimental

 Dip Beta
 Shape1 = 3.193 5. I. Rusydy, N. Al-huda, M. Fahmi, N. Effendi, A.
 Muslim, and M. Lubis, 30, 93 (2020)
 Data

 Mean = 286.56
 Dip
 Normal 6. M. Abdulai and M. Sharifzadeh, Geotech. Geol.
 Direction Sd = 19.787 Eng. 37, 1223 (2019)
 Note:* Sd: Standard Deviation 7. I. Rusydy, N. Al-Huda, K. Jamaluddin, D.
 Sundary, and G. S. Nugraha, Ris. Geol. Dan
 The connection between the first component and Pertamb. 27, 145 (2017)
 second component is recognised as an intersection 8. H. Park, J. Lee, K. Kim, and J. Um, Eng. Geol.
 probability relationship. The total probability of two (2015)
 components (0.47 and 0.56) are computed by 9. X. Zhou, J. Chen, Y. Chen, and S. Song, Bull. Eng.
 multiplying those components; hence, the probabilistic Geol. Environ. 76, 1249 (2017)
 of planar failure occurrence (P ) in this study is 0.26. All
 op 10. S. K. Hong and H. J. Park, Econ. Environ. Geol.
 parameters are employing in simulation as denoted in 52, 231 (2019)
 Table 1. 11. A. F. Abdul Rahim, N. Simon, T. R. Mohamed, A.
 G. Md. Rafek, A. S. Serasa, Y. Chen, M. Zhang,
 K. E. Lee, and T. L. Goh, Bull. Geol. Soc.
 4 Conclusion Malaysia 67, 83 (2019)
 The slope in this study area has structural geology 12. M. A. Farhan and M. A. Rai, in Int. Symp. Earth
 features from bedding, joints, and minor fault crossing Sci. Technol. 2019 (2020)
 the rock faces. The planar failure mainly occurs due to 13. I. Rusydy and N. Al-Huda, Carbonates and
 the dip direction of joints higher or lower than 20 from o
 Evaporites 36, (2021)
 the slope face, and the dips are higher than the internal 14. L. R. Alejano, J. Muralha, R. Ulusay, C. C. Li, I.
 friction angle yet lower than the slope angle. Those Pérez-Rey, H. Karakul, P. Chryssanthakis, and
 geometric rules for planar failure obviously can be Aydan, Rock Mech. Rock Eng. 51, 3853 (2018)
 utilised as the boundaries in calculating the probability 15. E. Hoek and J. D. Bray, Rock Slope Engineering
 in PDF curves either for observed data or (CRC Press, 1981)
 experimental/simulated data. 16. R. E. Goodman, Introduction to Rock Mechanics
 The experimental PDFs were developed based on (Wiley New York, 1989)
 the statistical parameters from observed data, and they 17. F. W. Vollmer, (2017)
 must be scrutinised carefully to produce reliable results. 18. D. C. Wyllie and C. Mah, Rock Slope Engineering
 This study identifies two typologies of data (CRC Press, 2004)
 distributions, beta and normal which are required 19. S. H. Begg, M. B. Welsh, and R. B. Bratvold,
 shape1, shape2 for beta and mean, the standard (2014)
 deviation for normal distribution. 20. C. Obregon and H. Mitri, Int. J. Min. Sci. Technol.
 This merely conducted probabilistic kinematic 29, 629 (2019)
 analysis for planar failure in one rock slope. A multitude 21. M. Sari, C. Karpuz, and C. Ayday, Comput.
 of rock slopes needs to be investigated by applying Geosci. 36, 959 (2010)
 probability analysis to deal with the uncertainty and 22. Y. Feng, J. P. Harrison, and N. Bozorgzadeh, Rock
 variability of rock properties. It is suggested to conduct Mech. Rock Eng. 52, 5071 (2019)
 more comprehensive research and cover more rock 23. S. P. Millard, EnvStats: An R Package for
 slopes in the future to mitigate rock slope failure Environmental Statistics (Springer Science &
 alongside roads or probably in mining areas. Business Media, 2013)

 Acknowledgement. The authors would like to express
 profound gratitude to Lembaga Penelitian dan Pengabdian
 Kepada Masyarakat Universitas Syiah Kuala for providing a
 research grant through Penelitian H-Index scheme 2021 and to
 Geology and Mining Engineering students who involve in
 field data acquisition.

 5
You can also read