Climate Change Recommendations for Regional Flood Planning
←
→
Page content transcription
If your browser does not render page correctly, please read the page content below
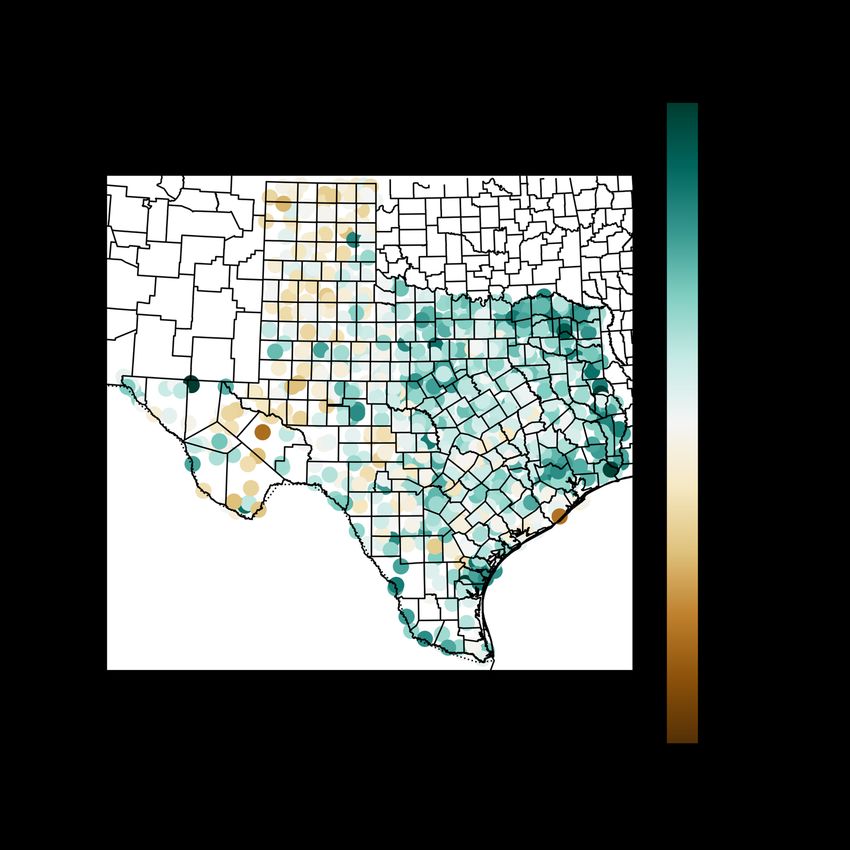
Climate Change Recommendations for Regional Flood Planning

John Nielsen-Gammon and Savannah Jorgensen
Office of the Texas State Climatologist
Dept. of Atmospheric Sciences, Texas A&M University
n-g@tamu.edu 979-862-2248
April 16, 2021
OSC Report 2021-01

Regional Flood Planning Groups may wish to take into account potential effects of climate
change on extreme rainfall and flood frequency and magnitude. Climate change may lead to
substantial increases in flood vulnerability over and above increases due to greater population
(Swain et al. 2020). To facilitate consistency across planning regions, specific climate change
scenarios are suggested here.

Increases in extreme precipitation in middle and higher latitudes consistently emerge as a likely
consequence of climate change. Evidence in support of such an increase is found in observed
trends, in climate model simulations and projections, and in the basic thermodynamic
principles of precipitation rate dependence on temperature, and all three lines of evidence can
be used to estimate future precipitation extremes (Wasko et al. 2021).

Local trends of extreme precipitation can be noisy, due to the quasi-random nature of extreme
events and the relatively short period of record. To maximize the ability to identify climate-
driven trends in extreme rainfall in Texas, Nielsen-Gammon (2020) used two approaches:
creating extended station data from NOAA Atlas 14 annual precipitation maxima using bias-
minimizing hot deck resampling, and creating composite individual county precipitation maxima
time series and pooling the results across multi-county regions. Nonstationary generalized
extreme value distributions were then fit to the time series, using carbon dioxide concentration
as a covariate. See Nielsen-Gammon (2020) for further technical details.

That analysis is extended here to include the remainder of Texas. The county composite
analysis, modified to use simulated global mean surface temperature as a covariate, finds a
positive trend in estimated 1-day 100-year rainfall amounts from 1960 to 2020 of about 15% in
central and eastern parts of Texas and 6% in western Texas (Fig. NGJ1). The extended analysis
of NOAA Atlas 14 data that station-specific trends are mostly positive, especially in central and
eastern Texas (Fig. NGJ2). These trends are consistent with trends found in other studies (such
as Wright et al. 2019 and Van Oldenborgh et al. 2017 & 2018). Note that these trends imply
that the stationary NOAA Atlas 14 values underestimate present-day return values and will
further underestimate future return values, although recent events such as Hurricane Harvey
may have led to a temporary overestimate of return values in southeast Texas (Nielsen-
Gammon 2020).

Climate Change Recommendations                  1                                  April 16, 2021
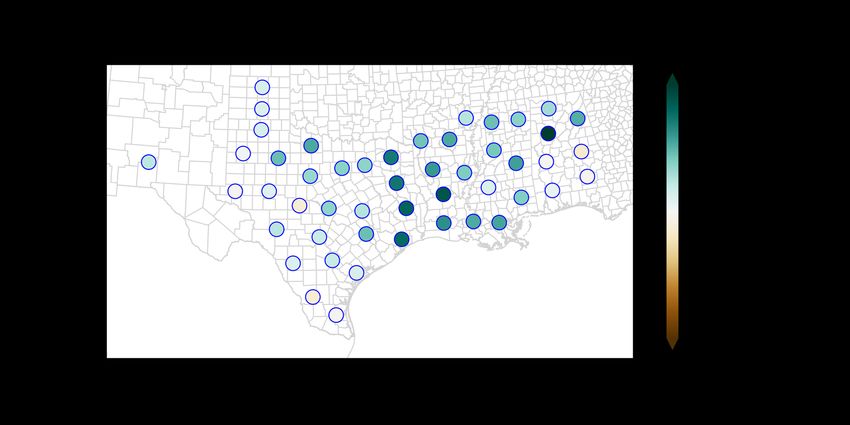
The trends are similar to or greater than what would be expected from thermodynamic
considerations alone, with a warmer atmosphere containing more water vapor when at 100%
relative humidity. Intense rainfall can also be affected by climate change through changes in
storm frequency or storm intensity, but the direct effect of temperature seems to dominate
across the United States (Pfahl et al. 2017). Models confirm the direct thermodynamic effect
on extreme precipitation (Allan et al. 2014).

Figure NGS1: Magnitude of climate-correlated trends in 100-year return values of 1-day
precipitation amounts, based on nonstationary analysis of sets of composite station records.
Trends are expressed as percentage difference between return values in 1960 and 2020, with
positive changes indicating an increase in return values. Most trends are positive. The
variations in trend from location to location are interpreted as random rather than representing
reliable differences in the impacts of climate change. Note: The New Mexico region includes the
three southernmost counties along the Rio Grande and El Paso County in Texas. No composite
station analysis is performed for the rest of the Trans Pecos because of large spatial variations
in return values among nearby stations.

Climate models consistently simulate increases in extreme rainfall over the United States due to
climate change, and consistently show larger fractional increases at longer return periods
(Swain et al. 2020). When downscaled to local daily precipitation extremes, the model
ensembles indicate large uncertainty in the magnitude of the change, though, implying
sensitivity to the statistical assumptions used in downscaling (Lopez-Cantu et al. 2020).

Nielsen-Gammon (2020) argued that variations in trends across different regions of the
southern United States are not robust, and that trends from many regions needed to be
combined to obtain a reliable estimate of historic changes in extreme rainfall distributions.
Downscaled spatial patterns of extreme rainfall trends are patchy, with spatial details not
robust across different models or different downscaling techniques. This further supports the

Climate Change Recommendations                  2                                  April 16, 2021
idea of relying on large-scale average trend magnitudes for both historical trends and future
projections.

Figure NGS2: Magnitude of climate-correlated trends in 100-year return values of 1-day
precipitation amounts, based on nonstationary analysis of extended data records used in NOAA
Atlas 14. Trends are expressed as percentage difference between return values in 1960 and
2020, with positive changes indicating an increase in return values. Most trends are positive.
The variations in trend from location to location are interpreted as random rather than
representing reliable differences in the impacts of climate change

Based on the above considerations, a relationship of a 7% increase in extreme rainfall amounts
per Kelvin global temperature increase is suggested as a basic projection. Since present-day
global temperatures are 0.5-1 K warmer than they were over most of the historical NOAA Atlas
14 analysis period, extreme rainfall return values should already be 5% above NOAA Atlas 14
values in most of the state. An additional 1 K of warming is generally anticipated by 2050-2060
according to moderate climate mitigation scenarios, which would correspond to a total increase

Climate Change Recommendations                 3                                  April 16, 2021
over NOAA Atlas 14 of 12%. Thus, in a basic climate change scenario, a present-day
enhancement of 5% and a mid-21st century enhancement of 12% would be appropriate.

However, observed trends are greater than 7%/K across most of the Gulf Coast region and in
most of Texas. A trend of 12%/K is regionally representative. This would correspond to a
present-day enhancement of 8% and a mid-21st century enhancement of 20% in an
extrapolation climate change scenario.

To be useful for flood planning, the rainfall changes must be translated into flood risk changes.
In urban areas with high impervious cover and small catchments, the increased intense rain
should translate directly into increased runoff. There, proportional increases in discharge can
be assumed, and in the absence of special hydrologic simulations, increased flood levels can be
inferred from extrapolation/interpolation of existing flooding simulations using relationships
between flood elevation and flow volumes.

In larger, more rural catchments, the situation is more complicated. Despite the unanimity
among models for an increase of intense precipitation, models project flooding outcomes for
Texas ranging from increased river floods to decreased peak streamflows (Swain et al. 2020;
Asadieh and Krakauer 2017; Do et al. 2020). The dichotomy between extreme rainfall and river
basin flooding is due in part to decreases in soil moisture (Nielsen-Gammon et al. 2020), which
lead to greater amounts of rainfall required for runoff over initially dry soils. Swain et al. (2020)
based their flooding analysis on rainfall changes alone while the other studies were based on
coupled model simulations of runoff. If decreased soil moisture does indeed lead to a larger
rainfall threshold for flooding, minor floods may become less likely while major floods may
become more likely.

On balance, future river flooding projections are the least constrained aspect of future rain and
flood hazards. In the face of such uncertainty, it may be inappropriate to assume that river
floods will not change at all. Suggested scenarios include both increases and decreases and
involve a larger range of possibilities than extreme rainfall to reflect the larger uncertainty.

In summary, the reference scenarios in the following table are suggested for planning groups
considering the implication of climate change on future flooding risk. The percentages in the
table represent increases over the published NOAA Atlas 14 25-year to 500-year precipitation
values.

     Scenario                        2021                                  2050-2060
                           Urban                River              Urban                River
       Low                   5%                 -2%                 12%                 -5%
       High                 12%                  5%                 20%                 10%

The listed scenarios assume that NOAA Atlas 14 accurately estimates the risk of extreme rainfall
under the assumption of stationarity. Additional adjustments may be applied if NOAA Atlas 14
return values are found to be unreliable.

Climate Change Recommendations                    4                                   April 16, 2021
References Allan, R.P., Liu, C., Zahn, M. et al. Physically Consistent Responses of the Global Atmospheric Hydrological Cycle in Models and Observations. Surv Geophys 35, 533–552 (2014). https://doi.org/10.1007/s10712-012-9213-z Asadieh, B. and Krakauer, N. Y.: Global change in streamflow extremes under climate change over the 21st century, Hydrol. Earth Syst. Sci., 21, 5863–5874, https://doi.org/10.5194/hess-21- 5863-2017, 2017. Do, H. X., Zhao, F., Westra, S., Leonard, M., Gudmundsson, L., Boulange, J. E. S., Chang, J., Ciais, P., Gerten, D., Gosling, S. N., Müller Schmied, H., Stacke, T., Telteu, C.-E., and Wada, Y.: Historical and future changes in global flood magnitude – evidence from a model–observation investigation, Hydrol. Earth Syst. Sci., 24, 1543–1564, https://doi.org/10.5194/hess-24-1543- 2020, 2020. Lopez-Cantu, T., Prein, A. F., & Samaras, C. (2020). Uncertainties in future U.S. extreme precipitation from downscaled climate projections. Geophysical Research Letters, 47, e2019GL086797. https://doi.org/10.1029/2019GL086797 Nielsen-Gammon, J. W., 2020: Observation-Based Estimates of Present-Day and Future Climate Change Impacts on Heavy Rainfall in Harris County. OSC Report 2020-02, Office of the State Climatologist, Texas A&M University, College Station, Texas, June 2020, 86 pp., http://oaktrust.library.tamu.edu/handle/1969.1/188617 Nielsen-Gammon, J. W., Banner, J. L., Cook, B. I., Tremaine, D. M., Wong, C. I., Mace, R. E., et al. (2020). Unprecedented drought challenges for Texas water resources in a changing climate: What do researchers and stakeholders need to know? Earth's Future, 8, e2020EF001552. https://doi.org/10.1029/2020EF001552 Pfahl, S., O’Gorman, P. & Fischer, E. Understanding the regional pattern of projected future changes in extreme precipitation. Nature Clim Change 7, 423–427 (2017). https://doi.org/10.1038/nclimate3287 Swain, D. L., Wing, O. E. J., Bates, P. D., Done, J. M., Johnson, K. A., & Cameron, D. R. (2020). Increased flood exposure due to climate change and population growth in the United States. Earth's Future, 8, e2020EF001778. https://doi.org/10.1029/2020EF001778 van Oldenborgh, G. J., et al 2017. Attribution of extreme rainfall from Hurricane Harvey, August 2017. Environ. Res. Lett. 12 124009 van Oldenborgh, G. J., et al 2018. Corrigendum: Attribution of extreme rainfall from Hurricane Harvey, August 2017 (2017 Environ. Res. Lett. 12 124009). Environ. Res. Lett. 13 019501 Climate Change Recommendations 5 April 16, 2021
Wasko Conrad, Westra Seth, Nathan Rory, Orr Harriet G., Villarini Gabriele, Villalobos Herrera
Roberto and Fowler Hayley J. 2021 Incorporating climate change in flood estimation guidance.
Phil. Trans. R. Soc. A. 379: 20190548. http://doi.org/10.1098/rsta.2019.0548

Wright, D. B., Bosma, C. D., & Lopez-Cantu, T. (2019). U.S. hydrologic design standards
insufficient due to large increases in frequency of rainfall extremes. Geophysical Research
Letters, 46, 8144– 8153. https://doi.org/10.1029/2019GL083235

Climate Change Recommendations                  6                                  April 16, 2021
You can also read