Climate Change Vulnerability Assessment for the California Coastal National Monument: Trinidad and Point Arena-Stornetta Units
←
→
Page content transcription
If your browser does not render page correctly, please read the page content below
Prepared in cooperation with the Bureau of Land Management

Climate Change Vulnerability Assessment for the
California Coastal National Monument: Trinidad and
Point Arena-Stornetta Units

Open-File Report 2021–1050

U.S. Department of the Interior
U.S. Geological Survey

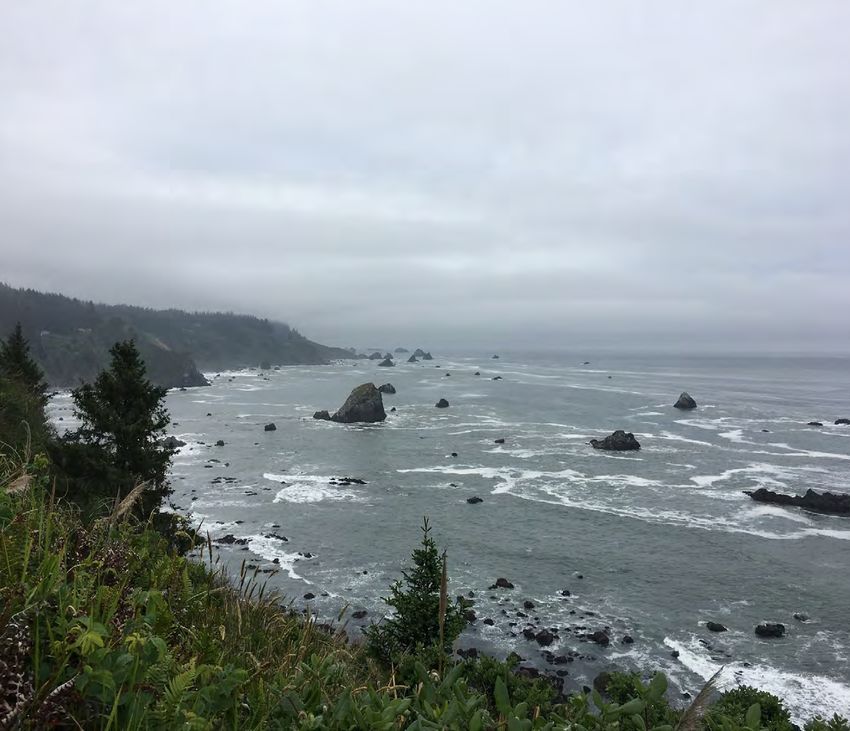
Cover: Trinidad-Stornetta Unit offshore rocks. Photograph taken by Karen Thorne, U.S. Geological
Survey, June 2017.
Climate Change Vulnerability
Assessment for the California Coastal
National Monument: Trinidad and
Point Arena-Stornetta Units

By Karen M. Thorne, Chase M. Freeman, Kevin Buffington, and
Susan E.W. De La Cruz

Prepared in cooperation with the Bureau of Land Management

Open-File Report 2021–1050

U.S. Department of the Interior
U.S. Geological Survey
U.S. Geological Survey, Reston, Virginia: 2021 For more information on the USGS—the Federal source for science about the Earth, its natural and living resources, natural hazards, and the environment—visit https://www.usgs.gov or call 1–888–ASK–USGS. For an overview of USGS information products, including maps, imagery, and publications, visit https://store.usgs.gov/. Any use of trade, firm, or product names is for descriptive purposes only and does not imply endorsement by the U.S. Government. Although this information product, for the most part, is in the public domain, it also may contain copyrighted materials as noted in the text. Permission to reproduce copyrighted items must be secured from the copyright owner. Suggested citation: Thorne, K.M., Freeman, C.M., Buffington, K., and De La Cruz, S.E.W., 2021, Climate change vulnerability assessment for the California coastal national monument—Trinidad and Point Arena-Stornetta units: U.S. Geological Survey Open-File Report 2021–1050, 64 p., https://doi.org/10.3133/ofr20211050. ISSN 2331-1258 (online)
iii

Acknowledgments
The project described in this report was supported by funding from the Bureau of Land
Management. Support also was provided by the U.S. Geological Survey, Western Ecological
Research Center. We would like to thank managers from the Bureau of Land Management,
California State Parks, Trinidad Coastal Land Trust, and other stakeholders for granting us
permissions for this study. We express thanks to field technicians K. Backe, and A. McCarthy
who assisted with field work and data summary. Peer review was provided by J. Weigand and
W. Standley. We would like to thank T. Graham for creating Figure 1 and S. Murphy for providing
information on bird surveys and locations within the study areas.
v

Contents
Acknowledgments����������������������������������������������������������������������������������������������������������������������������������������iii
Executive Summary���������������������������������������������������������������������������������������������������������������������������������������1
Introduction����������������������������������������������������������������������������������������������������������������������������������������������������2
Study Area������������������������������������������������������������������������������������������������������������������������������������������������������4
Objectives�������������������������������������������������������������������������������������������������������������������������������������������������������4
Interactive Workshops (Objective 1)����������������������������������������������������������������������������������������������������������4
Climate Change Vulnerability Assessment (Objective 2)������������������������������������������������������������������������5
     Overview������������������������������������������������������������������������������������������������������������������������������������������������5
     Vulnerability Analysis���������������������������������������������������������������������������������������������������������������������������6
     Climate Drivers��������������������������������������������������������������������������������������������������������������������������������������6
            Weather—Precipitation, Fog, and Temperature��������������������������������������������������������������������6
            Storms��������������������������������������������������������������������������������������������������������������������������������������������7
            Ocean Conditions—Temperature, pH��������������������������������������������������������������������������������������7
            Sea-level Rise�������������������������������������������������������������������������������������������������������������������������������8
Spatial Sea-level Rise Vulnerability Assessment (Objective 3)�������������������������������������������������������������9
     Study Scope�������������������������������������������������������������������������������������������������������������������������������������������9
     Field Surveys�����������������������������������������������������������������������������������������������������������������������������������������9
     Vulnerability Assessment������������������������������������������������������������������������������������������������������������������10
            Exposure��������������������������������������������������������������������������������������������������������������������������������������10
            Sensitivity������������������������������������������������������������������������������������������������������������������������������������10
Results�����������������������������������������������������������������������������������������������������������������������������������������������������������12
     Physical and Geological Features���������������������������������������������������������������������������������������������������12
     Biological Resources�������������������������������������������������������������������������������������������������������������������������12
            Sensitivity������������������������������������������������������������������������������������������������������������������������������������27
            Vulnerability��������������������������������������������������������������������������������������������������������������������������������27
Discussion�����������������������������������������������������������������������������������������������������������������������������������������������������33
     Stakeholder Workshops��������������������������������������������������������������������������������������������������������������������34
     Vulnerability Assessments����������������������������������������������������������������������������������������������������������������34
     Management Implications����������������������������������������������������������������������������������������������������������������35
References Cited�����������������������������������������������������������������������������������������������������������������������������������������35
Appendix 1. California Coastal National Monument Stakeholder Workshops Summary������������40

Figures
         1. Diagram showing conceptual model demonstrating the potential shift in
            number, area, and slope of offshore rocks and shorelines as a result of
            sea-level rise and subsequent changes in habitat availability for sensitive
            native and protected species�����������������������������������������������������������������������������������������������������2
         2. Images showing California Coastal National Monument Trinidad and Point
            Arena-Stornetta study sites��������������������������������������������������������������������������������������������������������3
         3. Images showing study extent of Trinidad and Point Arena-Stornetta Units in the
            California Coastal National Monument�������������������������������������������������������������������������������������9
vi
4. Photographs showing boat surveys that were conducted for rocky shoreline
habitats and avian and pinniped presence at the Point-Arena Stornetta and
Trinidad Units�������������������������������������������������������������������������������������������������������������������������������10
5. Images showing vulnerability analysis for the California Coastal National
Monument������������������������������������������������������������������������������������������������������������������������������������11
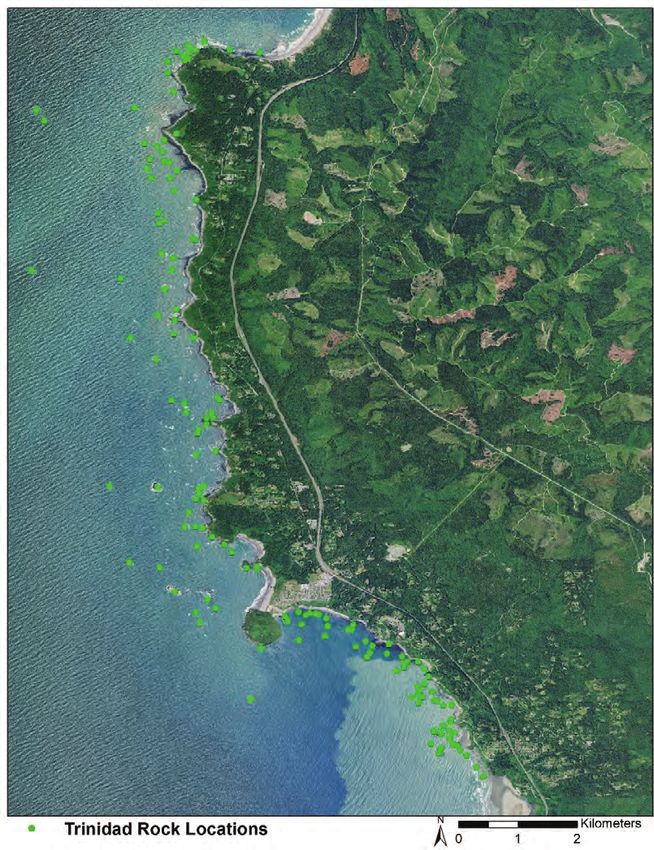
6. Site map showing all 138 surveyed shoreline rocks within the Trinidad Unit
used in the Vulnerability Analysis��������������������������������������������������������������������������������������������13
7. Graph showing Trinidad Unit rock area versus rock height illustrates the
variation in rock heights������������������������������������������������������������������������������������������������������������14
8. Site map showing all surveyed rocks at the Point Arena-Stornetta Unit��������������������������15
9. Graph showing Point Arena-Stornetta Unit rock areas versus rock heights
illustrates that mostly small rocks were in the area but varied in height�������������������������16
10. Graph showing exposure category related to size and shape of each surveyed
offshore rock feature within the Trinidad Unit�����������������������������������������������������������������������16
11. Graph showing bird species observed and total count within the Trinidad Unit�������������22
12. Graph showing Pinniped species observed and total count for Trinidad Unit�����������������23
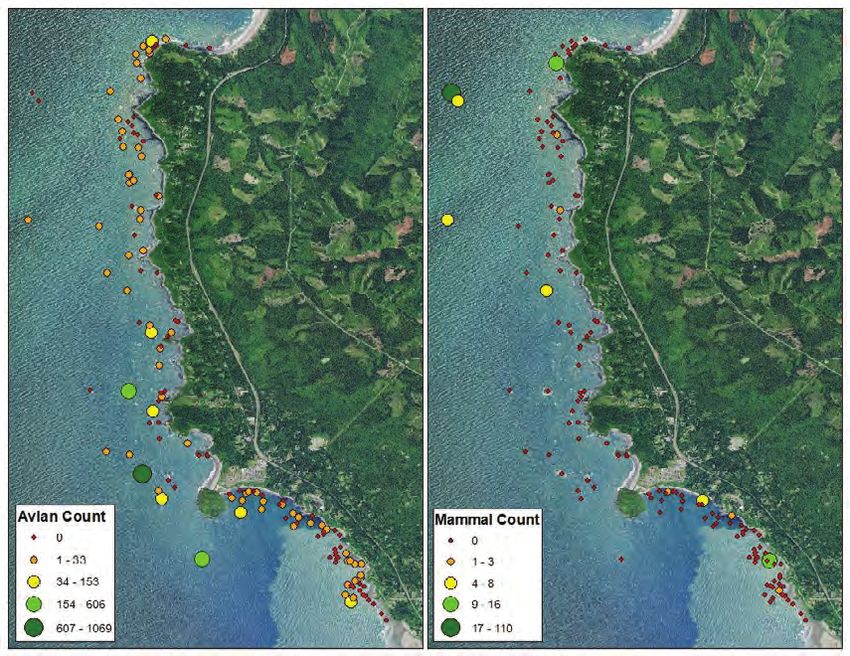
13. Images showing number of avian and mammal species observed during boat
surveys, by rock feature, in the Trinidad Unit������������������������������������������������������������������������23
14. Images showing number of individual avian and mammals observed during
boat surveys, by rock feature, in the Trinidad Unit���������������������������������������������������������������24
15. Images showing counts of three indicator species by rock feature���������������������������������24
16. Graph showing bird species observed and total count within Point
Arena-Stornetta Unit������������������������������������������������������������������������������������������������������������������25
17. Images showing number of avian and mammal species observed during boat
surveys, by rock feature, in Point Arena-Stornetta Unit������������������������������������������������������25
18. Images showing number of individual birds and mammals observed during boat
surveys, by rock feature, in Point Arena-Stornetta Unit������������������������������������������������������26
19. Graph showing sensitivity ranking relative to rock exposure classification for
the Trinidad Unit��������������������������������������������������������������������������������������������������������������������������27
20. Images showing Trinidad Unit offshore rocks and their associated exposure,
sensitivity, and vulnerability scores�����������������������������������������������������������������������������������������28
21. Images showing Trinidad Unit exposure, sensitivity, and vulnerability scores
based on an inverse distance weighted raster heat map���������������������������������������������������28
22. Images showing number of avian and mammal species observed by rock
feature in relation to exposure of the study area������������������������������������������������������������������29
23. Graph showing sensitivity ranking relative to rock exposure classification for
the Point Arena-Stornetta Unit�������������������������������������������������������������������������������������������������29
24. Images showing Point Arena-Stornetta Unit offshore rocks and their
associated exposure, sensitivity, and vulnerability scores�������������������������������������������������30
25. Images showing Point Arena-Stornetta Unit exposure, sensitivity, and
vulnerability scores based on an inverse distance weighted raster heat map���������������30
26. Images showing number of avian and mammal species observed by rock
feature in relation to exposure at the Point Arena-Stornetta Unit�������������������������������������31
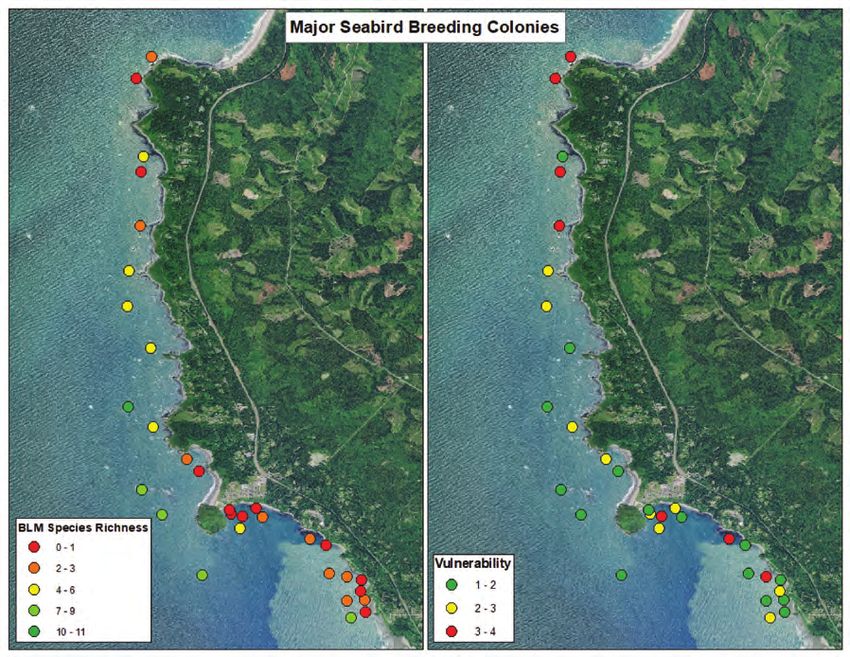
27. Graph showing comparison of Bureau of Land Management 2017 Trinidad
nesting surveys and U.S. Geological Survey 2017 post-breeding surveys of
major seabird colony rocks with their associated rock exposure�������������������������������������32
28. Images showing Bureau of Land Management species richness data for
Trinidad major seabird colonies compared to our vulnerability scores����������������������������33
vii

Tables
      1. Definition of terms used for this vulnerability assessment���������������������������������������������������5
      2. Exposure ranking based on rock height and area����������������������������������������������������������������11
      3. Summary of data collected on rocky shoreline habitats within Trinidad and
         Point Arena-Stornetta Units������������������������������������������������������������������������������������������������������12
      4. All rocky shoreline habitats within Trinidad and Point Arena-Stornetta Units����������������17
      5. List of all avian and pinniped species observed during boat surveys in Trinidad
         Unit occupying offshore rocks�������������������������������������������������������������������������������������������������22
      6. List of all species observed within the Point Arena-Stornetta Unit�����������������������������������26

Conversion Factors
International System of Units to U.S. customary units

             Multiply                                  By                          To obtain
                                               Length
 centimeter (cm)                                  0.3937                   inch (in.)
 millimeter (mm)                                  0.03937                  inch (in.)
 meter (m)                                        3.281                    foot (ft)
 kilometer (km)                                   0.6214                   mile (mi)
 kilometer (km)                                   0.5400                   mile, nautical (nmi)
 meter (m)                                        1.094                    yard (yd)
                                                Area
 hectare (ha)                                     0.003861                 square mile (mi2)
 square meter    (m2)                             0.0002471                acre
 square meter    (m2)                           10.76                      square foot (ft2)
                                                Rate
 millimeter per year (mm         yr–1)            0.03937                  inch per year (in yr–1)
 centimeters per year (cm yr–1)                   0.3937                   inch per year (in yr–1)

Temperature in degrees Fahrenheit (°F) may be converted to degrees Celsius (°C) as follows:
                                                        °C = (°F – 32) / 1.8.

Datum
Vertical coordinate information is referenced to the North American Vertical Datum of 1988
(NAVD 88).
viii

       Abbreviations
       BLM    Bureau of Land Management
       CO2    carbon dioxide
       CCNM   California Coastal National Monument
       HSD    Honestly Significant Difference
       ISD    Inverse Simpson diversity
       SLR    sea-level rise
       USGS   U.S. Geological Survey
Climate Change Vulnerability Assessment for the
California Coastal National Monument: Trinidad and
Point Arena-Stornetta Units
By Karen M. Thorne,1 Chase M. Freeman,1 Kevin Buffington,1 and Susan E.W. De La Cruz2
• Boat surveys were done for each unit to estimate the
Executive Summary number of rocky features and the biota using the rocks. At
the Trinidad Unit, 138 rocks were surveyed and 17 different
• The California Coastal National Monument protects wildlife species were observed, whereas at the Point
islets, reefs, and rock outcropping habitats in six onshore units, Arena-Stornetta Unit, 40 rocks were surveyed and 10 different
including the Trinidad and Point Arena-Stornetta Units. wildlife species were observed.
• The California Coastal National Monument provides • Individual rocky features surveyed within the units
crucial habitat for resident and migratory species of seabirds, were then ranked on sea-level rise exposure and vulnerability
marine mammals, and invertebrates, which includes several scales with 1 being the least vulnerable/exposed and
federally listed threatened and endangered species. Also, 5 the most.
the California Coastal National Monument encompasses • Forty-nine and fifty-eight percent of surveyed rocks
important tribal, cultural, and historical sites along the had a sea-level rise exposure ranking of 4 or 5 (high) for the
coastline of California. Trinidad Unit and Point Arena-Stornetta Units respectively.
• We used three approaches to assess the climate • Forty-eight percent of offshore rocks had a sea-level
change vulnerability of the Trinidad and Point Arena-Stornetta rise vulnerability score of 3 or greater (high) for the Trinidad
Units: (1) a qualitative approach using peer-reviewed literature Unit, and forty-three percent of rocks had a vulnerability score
and previous work done in the Climate Change Vulnerability of 3 or greater for the Point Arena-Stornetta Unit.
Assessment for the North-central California Coast and Ocean • When examining guild use of vulnerable rocks
(Hutto and others, 2015), (2) interactive workshops with local (vulnerability score greater than 3), at the Trinidad Unit
stakeholders to identify specific resources, and (3) spatial alcid species (here defined as common murres and pigeon
analysis to estimate sea-level rise vulnerability for the rocky guillemots) were observed on only 28 percent of vulnerable
shoreline and key resources within the units. rocks, shorebirds on 30 percent, sea lions on 40 percent,
• Information from stakeholder workshops held (in
gulls on 43 percent, seabirds on 58 percent, and mammals
2017) in the cities of Point Arena and Trinidad identified on 75 percent, whereas at the Point Arena-Stornetta Unit
climate change impacts as an important management concern alcid species were observed on 0 percent of vulnerable rocks,
for the resilience, health, and ecosystem services of the gulls on 33 percent, seabirds on 57 percent, and mammals on
California Coastal National Monument units. Impacts that 50 percent.
were identified included sea-level rise, changes in precipitation • Sea-level rise has the potential to submerge small
and fog, warming oceans, and loss of species (birds, fisheries, low-relief offshore rocks and make them uninhabitable for
marine mammals). birds and marine mammals but could provide more intertidal
and subtidal rocky habitats. We found that nearly half of
the offshore rocks at both sites are vulnerable and have the
1U.S. Geological Survey, Western Ecological Research Center, Davis Field
potential to realize this outcome; however, the larger and
Station, One Shields Ave, Davis, CA, 95616 tall-relief rocks at these sites are less vulnerable to sea-level
2U.S. Geological Survey, Western Ecological Research Center, San
rise and are expected to continue to provide habitat for
avian species.
Francisco Bay Estuary Field Station, P.O. Box 158, Moffett Field, CA, 940352 Climate Change Vulnerability Assessment for the California Coastal National Monument
Introduction use low-lying offshore rocks to haul out and rest between
feedings. Particularly, bird species with strong site fidelity,
Climate change can negatively affect rocky shoreline such as the black oystercatcher (Haematopus bachmani),
habitats and productivity in several ways (Hutto and others, could be more vulnerable to environmental changes because
2015). Atmospheric warming is expected to accelerate of their limited dispersal ability (Johnson and others, 2010).
the current rate of sea-level rise (SLR), inundating many Other migratory birds (for example, Brandt’s cormorant
low-lying coastal and intertidal areas, submerging low relief [Phalacrocorax. penicillatus], common murre [Uria aalge],
habitats (Cloern and others, 2016), and posing a threat to western gull [Larus occidentalis]) also use these offshore
important coastal resources (Mitchell and others, 2015). features for roosting and nesting (Buchanan and others, 2001).
Changing climate also is projected to alter precipitation The loss of these species could have significant effects on the
amounts and timing, air and water temperatures, and overall biodiversity and functions of rocky shoreline ecosystems.
storm patterns (Intergovernmental Panel on Climate Change, Vulnerability assessments are an important tool for
2014), including more frequent extreme wave events (fig. 1). informing adaptation planning because they consider
Many coastal areas are already experiencing early impacts of uncertainty about future climate. Such assessments can help
climate change, including drought, flooding from SLR, and managers and other resource professionals plan and implement
increasing storm intensity and frequency (Griggs and others, actions to lessen climate impacts to important resources such
2017, Vitousek and others, 2017). as in rocky shoreline ecosystems. The California Coastal
Sea-level rise could result in the loss and isolation of National Monument (CCNM) protects coastline that is
rocky shoreline island features and pose a threat to wildlife nationally recognized for its scenic beauty and diverse array
species that depend on these islands as crucial resting and of biological, cultural, and physical resources, including rocky
nesting habitats (fig. 1). However, new offshore rocky islands intertidal communities, habitat for seabirds, marine mammals,
could be created as mainland areas are cleaved off through invertebrates and plant species, and important cultural
increased erosional impacts. Vulnerability of biological and historical sites. In this study, we used a vulnerability
resources is mediated by characteristics of species’ ecology, assessment approach to identify the rocky shoreline features
particularly selection of feeding grounds and nest sites, and species that could be the most affected by climate change
phenology, and species competition. Marine mammal species and SLR within two subunits of the CCNM (fig. 2).
Figure 1. Conceptual model demonstrating the potential shift in number, area, and slope of offshore rocks
and shorelines as a result of sea-level rise and subsequent changes in habitat availability for sensitive
native and protected species.Introduction 3 Map image is the intellectual property of Esri and is used herin under license. Copyright 2020 Esri and its licensors. All rights reserved. Figure 2. California Coastal National Monument Trinidad and Point Arena-Stornetta study sites. Orange areas represent the extent of each unit.
4   Climate Change Vulnerability Assessment for the California Coastal National Monument

Study Area                                                            Spanish ships. Adjacent is a harbor where commercial
                                                                      and recreational boats moor. Trinidad Unit is home to
      The CCNM is situated along the California Current               diverse coastal vegetation, rocky intertidal shoreline, and
Ecosystem, where strong upwelling of cold, nutrient-rich              offshore rocks which provide habitat for multiple species.
subsurface waters makes a highly productive area for marine           These are known to include three species of cormorants
life. Climate change drivers will influence the CCNM by               (Brandt’s, P. penicillatus; double crested, P. auratus; and
changing habitat availability and food resources as well as           pelagic, P. pelagicus), common murres (U. aalge), pigeon
affect species interactions such as predation and competition         guillemots (Cepphus columba), tufted puffins (Fratercula
(Harley and others, 2006). The CCNM encompasses                       cirrhata), Leach’s storm-petrels (Oceanodroma leucorhoa),
more than 20,000 small islands, rocks, exposed reefs, and             fork-tailed storm-petrels (O. furcata), black oystercatchers
pinnacles on the California coast between Baja California             (H. bachmani), harbor seals (Phoca vitulina), California sea
and Oregon. The CCNM was established on January 11,                   lions (Zalophus californianus), Steller sea lions (Eumetopias
2000, through Presidential Proclamation 7264 (65 FR 2821,             jubatus), marine-adapted river otters (Lontra canadensis) and
2000) to “protect the biological treasures situated offshore          many species of intertidal invertebrates (Proclamation 9563,
on thousands of unappropriated or unreserved islands, rocks,          82 FR 6131, 2017).
exposed reefs, and pinnacles owned or controlled by the
Government of the United States within 12 nautical miles
of the shoreline of the State of California.” Establishment           Objectives
of the national monument, and subsequent additions to the
CCNM (Presidential Proclamations 9089, 79 FR 14601, 2014                   Our objectives for the Trinidad and Point Arena-Stornetta
and 9563, 82 FR 6131, 2017), fall under the Antiquities Act of        Units were to:
1906, which permits a president to reserve the smallest area
                                                                         1. Host interactive workshops to gather ideas from local
that is sufficient to protect “historic landmarks, historic and
                                                                            stakeholders on key resources and climate change
prehistoric structures, and other objects of historic or scientific
                                                                            vulnerabilities.
interest.” The Presidential Proclamations declaring the CCNM
and its subsequent expansions specify the value of the seabird           2. Summarize climate change vulnerability and
and pinniped habitat, the cultural sites, archeological sites,              identify indicator species of the CCNM based on
and artifacts, as well as the coastal scenery itself. These                 published information.
protected areas offer environmental services to the local
community, important habitat areas, and recreational and                 3. Produce a quantitative SLR vulnerability assessment
commercial opportunities.                                                   for rocky shoreline resources by using spatial
      The Trinidad and the Point Arena-Stornetta Units were                 modeling and a standardized vulnerability assessment
identified as representative regions within the northern extent             approach (table 1).
of the CCNM to explore climate change and SLR vulnerability
of rocky shorelines and to inform climate change adaptation
planning and vulnerability assessment. Point Arena-Stornetta
Public Lands were incorporated into the CCNM in 2014 as               Interactive Workshops (Objective 1)
the first mainland-based unit. Trinidad Head was designated
part of the CCNM by presidential proclamation on January 12,               We hosted interactive workshops with local stakeholders
2017. The Trinidad and Point Arena-Stornetta Units support            to gather information about key resources and which climate
colony nesting sites for a variety of seabird species and             change drivers we could focus on for the vulnerability
provide pupping, nursery and haul out habitat for marine              assessments. The 1-day workshops were held in Trinidad,
mammals (Capitolo and others, unpub. data, 2006; Robinette            California, in June 2017 and Point Arena-Stornetta, California,
and McChesney, unpub. data, 2013). Trinidad Head, a                   in October 2017. Workshop participants took part in a
promontory near the southern end of the Trinidad Unit,                pre-workshop survey and interactive workshop exercises;
encompasses approximately 5 hectares.                                 they asked questions about important key resources within
      Trinidad Head is home to important sites for the Cher-Ae        the units and expressed their biggest management concerns.
Heights Indian Community of the Trinidad Rancheria,                   A detailed summary of the methods and results can be found
the Yurok Tribe, and the Tsurai Ancestral Society. These              in appendix 1. Workshop participants at both sites were
sites include the Tsurai ancestral village and burial sites.          particularly concerned about the following issues:
Trinidad Head also hosts the Trinidad Memorial Lighthouse,                 • Sea-level rise damaging or limiting access to important
constructed in 1871, and Bell, installed in 1898, a memorial                 tribal, cultural, recreational, commercial, and
marking where the Yurok community had first contact with                     historic sites.
Climate Change Vulnerability Assessment (Objective 2) 5
Table 1. Definition of terms used for this vulnerability assessment (modified from Hutto and others, 2015).
[=, equals]
Term Definition
Climate exposure A measure of how much change a resource is likely to experience from climate change.
(1=no exposure, 5=extreme exposure)
Sensitivity A measure of magnitude and how a resource is likely to be affected by a given change in
(1=no sensitivity, 5=extreme sensitivity) climate or factors driven by climate.
Adaptive capacity The ability of a resource to accommodate or cope with climate change impacts with minimal
(1=no adaptive capacity, 5=extreme disruption (Glick and others, 2013).
adaptive capacity)
Vulnerability The propensity or predisposition to be adversely affected. Vulnerability encompasses a variety
(1=no vulnerability, 5=extreme of concepts and elements including sensitivity or susceptibility to harm and lack of capacity
vulnerability) to cope and adapt (Intergovernmental Panel on Climate Change, 2014).
• The impact of sea-level rise and erosion on offshore assess vulnerability of rocky coast habitats and avian indicator
rock, cliff, and intertidal seabird and marine species. We include a more comprehensive and spatially
mammal habitats. explicit SLR vulnerability assessment of rocky shoreline
habitats later in this report (Objective 3).
• Fisheries and nesting seabirds as the most important We selected three avian indicator species: (1) black
biological resources for management. oystercatcher, (2) common murre, and (3) Brandt’s cormorant,
• Changes in precipitation, fog, and sea-level rise as a based on their reliance on rocky coastal habitat and their
result of climate change. abundance observed during surveys in the Trinidad and Point
Arena-Stornetta Units of the CCNM. Black oystercatchers
• Other climate change impacts to key resources for are dependent on marine shorelines for foraging and
nesting and roosting seabirds. nesting. Breeding pairs establish composite feeding and
nesting territories along low-relief, gradually sloping, rocky
shorelines and generally occupy the same territory year after
year (Andres, 1998). Nests typically are placed just above
Climate Change Vulnerability the high-tide line and adults use the adjacent intertidal zone
to feed themselves and provision their chicks (Andres and
Assessment (Objective 2) Falxa, 1995). Given their use of the low rocky intertidal zone
and high site fidelity, black oystercatchers are expected to be
Overview vulnerable to SLR effects on rocky shorelines (Johnson and
others, 2010; Weinstein and others, 2014). Common murre
Climate change could negatively affect rocky habitat are a highly social species that breeds in high-density colonies
through several mechanisms, including changes in along island cliff ledges, rocky slopes, and flat surfaces.
atmospheric and ocean conditions. A comprehensive climate Murres depart colonies synchronously, and most of the chick
change vulnerability assessment, which included portions development takes place at sea, in the company of the male
of the rocky features within the CCNM, was created for the parent. Chick survival is dependent on the availability of
north-central California Coast and Ocean (Hutto and others, abundant, energy-rich prey within 60–70 kilometers (km)
2015). We expanded on the assessment by Hutto and others of the breeding area (Ainley and others, 2002). Brandt’s
(2015) to cover the Trinidad region and conducted a literature cormorant is also a colonial nesting seabird that nests on the
search for additional information on specific impacts to the windward side of islands along gentle slopes or steep cliffs
northern units of the CCNM (fig. 2) and observed indicator with ledges (Hubbs and others, 1970; Hunt and others, 1981;
species. We addressed the potential impacts of changes in Boekelheide and others, 1990). Adults forage at sea and
weather, precipitation, fog, storms, ocean conditions, and provision chicks on the nest until fledging (Carter and Hobson,
SLR, with a special focus on expected impacts in the Trinidad 1988). Like the common murre, this species is expected to be
and Point Arena-Stornetta Units. Finally, for each impact, we sensitive to changes in rocky coast nesting habitat as well as
used information derived from Hutto and others (2015) to ocean conditions that influence fish productivity.6 Climate Change Vulnerability Assessment for the California Coastal National Monument
Vulnerability Analysis Many California coastal regions experience frequent
fog in the summer due to rapid cooling of warm, moist air
Vulnerability was calculated using the formula from as it travels over colder ocean water (as seen at these study
Glick and others (2013). Exposure, sensitivity, and adaptive locations; Byers, 1930; Koračin and others, 2001). Coastal
capacity terms for indicator species and habitats were fog primarily reduces air temperature and reflects solar
used from Hutto and others (2015) to determine relative radiation. Broadly, coastal fog forms when a subsiding dry
vulnerability scores. Vulnerability of habitat or species to warm air mass moves across cooler sea surface temperatures
climate drivers was calculated using the following equation: (SST; made cooler from upwelling), forming a temperature
inversion that caps a marine layer (Rastogi and others, 2016).
(___________
CE*0.5) + S The marine layer is cool and humid, resulting in the formation
V = (1) of fog and low clouds (O’Brien and others, 2013; Rastogi and
AC
others, 2016). Some studies have hypothesized that summer
where fog could become more frequent as upwelling increases due to
V is overall vulnerability; increasing atmospheric carbon dioxide (CO2) concentrations
CE is exposure to climate drivers; (Snyder and others, 2003). However, some models show
S is sensitivity to climate drivers; a decline in fog along coastlines as atmospheric warming
AC is adaptive capacity to climate drivers. proceeds. One analysis, based in part on data collected at
the California Redwood Coast—Humboldt County Airport
in McKinleyville, California, projected a decreasing trend
Climate Drivers in mean summer fog frequency between 1951 and 2008 and
a decline in frequency by 33 percent over the past century
(Johnstone and Dawson, 2010).
Weather—Precipitation, Fog, and Temperature Trinidad and Point Arena-Stornetta Units: How air
Along the northern California coastline, air temperatures temperature, precipitation, and fog patterns will change in
will likely vary over the coming century (Cayan and others, this region of California is unknown; however, at the time of
2008). This region experiences moderate temperatures this report, most of the area’s freshwater supply comes from
throughout the year, with no average monthly temperature rain, runoff, and fog. In general, air temperatures are expected
falling below 32 degrees Fahrenheit (°F) and at least 3 months to increase throughout California. Changing precipitation
of the year rising above 50 °F. However, increases in patterns could alter the amount and timing of estuarine
atmospheric carbon dioxide levels have resulted in gradually salinity, thus influencing the community composition of
warming air and water temperatures, leading to cascading aquatic species. More local information is needed to fully
effects on winds, precipitation, fog, and ocean circulation characterize the vulnerability from changes in weather patterns
(Scavia and others, 2002). and availability of fog.
The seasonal precipitation regime along the north-central Values derived from Hutto and others (2015) for
California coast has most rain falling between November and exposure, sensitivity, and adaptive capacity using the formula
April. Climate-related changes in precipitation and runoff in equation 1 provided the following scores in relation to
primarily are related to reduced snowpack due to warmer weather, precipitation, and fog for habitat and indicator species
winter storms (Stewart and others, 2005; Knowles and others, observed in the CCNM offshore rocks.
2006). In smaller coastal watersheds, more extreme winter Rock Habitat: Exposure (1, low), Sensitivity (1, low),
rainfall events are expected; further, it is projected that annual Adaptative Capacity (1, low), therefore Vulnerability score is
precipitation during the 21st century will show greater annual 1.5 (low).
variability (such as, drier dry years and wetter wet years; Black Oystercatcher: Exposure (4, moderately
Dettinger, 2011). Changes in runoff and river discharge can high for changes in precipitation), Sensitivity
be expected to lead to increased flooding of coastal lowlands, (1, low for air temperature; 4, moderately high for
erosion of cliffs and beaches, increased delivery of watershed precipitation=2.5 average), average Adaptative Capacity
material to the ocean, expanded plume areas, and increased (3, moderate), therefore Vulnerability score is 1.6 (low).
nearshore stratification. Brandt’s Cormorant and Common Murre (surface
nesters): Exposure (2.5, low moderate), Sensitivity (2, low),
average Adaptative Capacity (3, moderate), therefore
Vulnerability score is 1.08 (low).Climate Change Vulnerability Assessment (Objective 2) 7
Storms Trinidad and Point Arena-Stornetta Units: Frequency
and intensity of coastal storms are projected to increase.
Interannual variability in ocean conditions, such as Current projections point to reduced snowpack but more
that driven by the El Niño phase of the El Niño Southern extreme precipitation events, including atmospheric rivers. In
Oscillation (ENSO), has been found to have a significant addition, the frequency of El Niño events that bring warmer
impact on the California coast. El Niño events are associated ocean waters and more precipitation is expected to increase
with warmer oceans, increased wave energy and ocean and affect this region of the coast (Dettinger, 2011).
levels, directional shifts of both ocean and air circulation, and Values derived from Hutto and others (2015) for
heavier precipitation (Storlazzi and Griggs, 2000; Barnard exposure, sensitivity, and adaptive capacity using the formula
and others, 2015). Increased storm intensity in El Niño events in equation 1 provided the following scores in relation to
results in increasing wave heights, which are greater at higher coastal storms for habitat and indicator species observed in the
latitudes (Allan and Komar, 2006). Based on data collected CCNM offshore rocks.
by the National Data Buoy Center (NDBC) Point Arena Rock Habitat: Exposure (3, high), Sensitivity
Buoy (#46014), wave heights in the area have increased by (2, moderate), Adaptative Capacity (1, low) therefore
an average rate of approximately 1.5–2 cm yr–1 (centimeters Vulnerability score is 3.5 (moderate).
per year), driven in part by extreme waves occurring during Black Oystercatcher: Exposure (5, high), Sensitivity
El Niño events (Menéndez and others, 2008; Largier and (5, high), average Adaptative Capacity (3, moderate),
others, 2011). El Niño events also result in reduced primary Vulnerability score is 4.2 (moderate high).
productivity because of warmer sea surface temperatures and Brandt’s Cormorant and Common Murre (surface
reduced ocean upwelling, resulting in more nutrient-poor nesters): Exposure (3), Sensitivity (5, high), average
waters off the coast. The shift to lower productivity affects Adaptative Capacity (3, moderate) therefore Vulnerability
organisms throughout the food chain (McGowan and others, score is 2.5 (low to moderate).
1998; Schwing and others, 2006). Climate models show that
the overall number of El Niño events is expected to increase,
and it is projected that El Niño events will become more Ocean Conditions—Temperature, pH
extreme when they occur (Cai and others, 2014).
Ocean temperature change is spatially and seasonally
Another effect of increases in atmospheric temperature
variable, but studies have found net warming trends in
is the development of atmospheric rivers (also referred to
sea surface temperature in the Pacific Ocean (Legaard and
as a “Pineapple Express”), where currents of high-moisture
Thomas, 2006; L’Heureux and others, 2013). Other research
high in the atmosphere result in high-intensity precipitation
has shown a cooling trend over the continental shelf off
events along the northern coast of California. Atmospheric
the California coast at local levels, due to more intense
rivers often generate extreme precipitation amounts, which
and prolonged local upwelling of cold waters (Schwing
strongly influence hydrologic impacts by altering the timing
and Mendelssohn, 1997; Snyder and others, 2003; Hutto
and magnitude of rainfall and runoff (Guan and others, 2010;
and others, 2015). This cooling effect is thought to be due
Dettinger, 2011).
to increased atmospheric CO2 causing a larger gradient
Changes in atmospheric river temperatures have
between the air pressure over land and ocean and resulting
important implications for regional hydroclimate, especially
in alongshore winds that intensify upwelling (García‐Reyes
in locations where a shift to more rain-dominated atmospheric
and Largier, 2010). Increased upwelling has been found to be
river precipitation could affect snowpack and flood risk in
strongest on the central California coast, south of our study
the California Coast Range. A recent study by Gonzales
sites (García‐Reyes and Largier, 2010). However, the effects
and others (2019) detected monthly scale and seasonal
of stronger upwelling conditions may be offset or negated
atmospheric river warming between 1980 and 2016 along the
because warming temperatures over the ocean may result in
U.S. West Coast with the most widespread warming occurring
a warmer sea surface temperature, deeper mean thermocline,
in November and March. Warm atmospheric rivers account for
and more stratification (García‐Reyes and Largier, 2010).
30–50 percent of California's winter precipitation (Dettinger,
Conditions in waters over the continental shelf likely will
2011); this increased amount of precipitation and ratio of
not affect temperatures expected to increase in nearshore and
rain to snow can increase flood risks. The altered timing for
enclosed waters where upwelling is not occurring (Largier and
snowpack melt (Guan and others, 2010) also incurs heightened
others, 2011).
hazards from intensified precipitation, wind damage, and
mudslides (Ralph and others, 2006; Neiman and others, 2011;
Waliser and Guan, 2017; Oakley and others, 2018).8 Climate Change Vulnerability Assessment for the California Coastal National Monument
Ocean acidification is a reduction in pH caused by Sea-level Rise
chemical reactions when atmospheric CO2 is absorbed by
ocean water. Since the start of the industrial revolution, the Warming oceans from increased CO2 concentrations and
global average surface water pH has declined by around resulting atmospheric warming lead to thermal expansion of
0.1 pH units, a roughly 30-percent increase in acidity the ocean waters and melting of land ice at the poles, which
(Feely and others, 2016; National Oceanic and Atmospheric all augment the volume of the ocean and therefore raise
Administration, 2019). It is projected that if atmospheric CO2 sea levels. Global mean sea level has increased by about
concentrations reach 800 parts per million toward the end of 24 centimeters (cm) since 1880, with 8 cm occurring since
the century, pH will decrease by approximately another 0.4 pH 1993 (Sweet and others, 2017). Projections of mean SLR to
units (Feely and others, 2016). The capacity of ocean waters the year 2100 are largely uncertain because of the difficulty
to take up surplus anthropogenic CO2 has been decreasing in modeling melting ice-sheet dynamics and other ocean
rapidly and could decline as much as 34 percent by 2100, processes (Mouginot and others, 2014). However, at the time
under a RCP8.5 scenario (Representative Concentration of this report, global estimates range from 0.5 to 1.8 meters
Pathways; Jiang and others, 2019). The ocean’s role in (m) of SLR by 2100 (Le Bars and others, 2017). Regional
buffering global climate change will gradually diminish, relative SLR models for the area nearest to the CCNM units
and ocean acidification could accelerate. In part, due to the project a 0.53-millimeter (mm) increase in mean sea-level
seasonal upwelling of waters undersaturated with carbonate, every year at Arena Cove and a 4.68 millimeters per year
the continental shelf region off the west coast of North (mm/yr) increase at North Spit, the gauge nearest to Trinidad
America is particularly vulnerable to unbuffered acidification (±1.10 and ±1.01 mm/yr, respectively, 95-percent confidence
from increased CO2 (Feely and others, 2016). At Point St. interval; https://tidesandcurrents.noaa.gov/sltrends/). The
George, just north of Trinidad, a 2007 survey indicated differences in SLR rate are largely due to local tectonic
that there was an undersaturation of aragonite (a carbonate activity; subsidence increases the relative rate of SLR,
mineral; Feely and others, 2008) throughout the entire water whereas uplift reduces the rate of relative SLR.
column of inshore waters. It is projected that shallower Trinidad and Point Arena-Stornetta Units: Increasing
waters of the California Current will be undersaturated more ocean levels are projected to inundate and submerge low-lying
often and for longer periods over the next several decades to areas within the units. Increasing mean SLR over the coming
a century, and that over half of the waters in the California century is expected to inundate new areas or increase the time
Current will be undersaturated by 2050 (Gruber and others, an area is submerged and decrease the amount of time an area
2012; Feely and others, 2016). is exposed. Many low relief offshore rocks could become
Trinidad and Point Arena-Stornetta Units: The completely submerged with accelerating SLR. Waves and
nearshore ecosystems within the units provide complex ocean swells also could increase realized sea levels locally.
heterogeneous environments that maintain diversity and Values derived from Hutto and others (2015) for
productivity; this is driven in combination by upwelling, exposure, sensitivity, and adaptive capacity using the formula
layer mixing, currents, and stratification. Changes in water in equation 1 provided the following scores in relation to
conditions (for example, temperature or pH) could have SLR for habitat and indicator species observed in the CCNM
important consequences to the food webs and productivity of offshore rocks.
terrestrial and marine wildlife. Rock Habitat: A refined quantitative vulnerability
Values derived from Hutto and others (2015) for score was calculated for each rock feature per unit. See
exposure, sensitivity, and adaptive capacity using the formula “Vulnerability Assessment” section.
in equation 1 provided the following scores in relation to Black Oystercatcher: Exposure (5, high), Sensitivity
ocean conditions for habitat and indicator species observed in (5, moderate-high), average Adaptative Capacity (3, low)
the CCNM offshore rocks. therefore Vulnerability score is 4.2 (high).
Rock Habitat: Exposure (1, low), Sensitivity (1, low), Brandt’s Cormorant and Common Murre (surface
Adaptative Capacity (1, low) therefore Vulnerability score is nesters): Exposure (1, low), Sensitivity (1, low), average
1.5 (low). Adaptative Capacity (3, moderate) therefore Vulnerability
Black Oystercatcher: Exposure (5, high), Sensitivity score is 0.17 (low).
(4, moderate-high), average Adaptative Capacity (2, low)
therefore Vulnerability score is 5 (high).
Brandt’s Cormorant and Common Murre
(surface nesters): Exposure (3, moderate), Sensitivity
(2, low-moderate), average Adaptative Capacity (3, moderate)
therefore Vulnerability score is 1.0 (low).Spatial Sea-level Rise Vulnerability Assessment (Objective 3) 9
Spatial Sea-level Rise Vulnerability as well as to maintain survey consistency among study sites.
We conducted surveys at each site, traversing the length of
Assessment (Objective 3) the unit coastline, documenting observed presence of birds
or pinnipeds, and photographing all the offshore rocks.
Study Scope Boat surveys were conducted from a rigid-hulled inflatable
boat with a 1.82 meter viewing tower attached to the deck
The scope of this study encompassed the offshore extents (fig. 4) where observations were made with unaided sight
of the Point Arena-Stornetta and Trinidad Units and rocky and with a Swarovski Habicht 10x42 WB SLC scope
shoreline habitats within those units (fig. 3). Here we focus (www.swarovskioptik.com). We approached rocks from
on the units that are Rocky Intertidal defined as “…rocky the seaward side and collected data from the ocean-facing
substrate found between high and low tide water levels” side of the rocks. Data collection included identification
(Hutto and others, 2015). to species, sex and age, and the behavior (for example,
roosting, nesting, hauled-out) of each individual. Photographs
of the ocean-facing side of each encountered rock were
Field Surveys taken using a Canon PowerShot SX530 HS, lens model
4.3–215.0 mm to validate species observations. Because boat
To assess avian and pinniped presence and resource
surveys were done late in the nesting season, we also used
vulnerability of off-shore rocky habitat, we conducted
supplemental information from stakeholders to inform which
boat-based surveys on July 21, 2017, at Trinidad and on
rocky shoreline habitats were important for nesting species
July 26, 2017, at Point Arena-Stornetta Units (fig. 3). Surveys
(S. Murphy, Bureau of Land Management and Humboldt State
were conducted within a few hours of low tide to capture
University, North Coast Seabird Protection Network, written
low-lying rocks and peak wildlife presence on these rocks
commun., 2019).
Map image is the intellectual property of Esri and is used herin under license. Copyright 2020 Esri and its licensors. All rights reserved.
Figure 3. Study extent of Trinidad and Point Arena-Stornetta Units in the California Coastal National Monument.
Black lines indicate the boat survey tracks used to conduct the surveys for bird and marine mammal using the rocky
shoreline habitats.10 Climate Change Vulnerability Assessment for the California Coastal National Monument
Figure 4. Boat surveys were conducted for rocky shoreline habitats and avian and pinniped presence at the Point-Arena
Stornetta and Trinidad Units. Photograph taken by Karen Backe, July 2017.
Vulnerability Assessment (https://coast.noaa.gov/dataviewer); heights were categorically
binned as “low (12 m).” Rocks were then assigned a ranking of
exposure and biological resource sensitivity, replicated from exposure from 1 (no exposure) to 5 (extreme exposure) based
Glick and others (2013; fig. 5). As generally static landscape on the combination of height and area (table 2). Rocks that
features, we assumed rocks have a low adaptive capacity to were not covered by the digital elevation model extent were
SLR (adaptive capacity=1), and therefore, we removed the categorized by expert visual observations by estimating height
term Adaptive Capacity from the Vulnerability equation. It relative to the observed low-tide line. For the “low” rocks,
is worth noting that cliffs could experience some negative all or nearly all vertical habitat may be inundated with SLR
capacity impacts in the form of erosion and cliff retreat. Thus, at high tide, “intermediate” rocks may have notable vertical
we used a modified formula: habitat inundated with SLR at high tide, and “high” rocks
likely will have a small percentage of total vertical habitat
(CE * 0.5) + S
V = (2) inundated with SLR at high tide.
where
V is overall vulnerability; Sensitivity
CE is exposure to climate drivers; To examine wildlife community structure and rock
S is sensitivity to climate drivers. use, we calculated species richness and the Inverse Simpson
diversity (ISD) index for each rock. We included avian
and pinniped observations. Inverse Simpson diversity is
Exposure calculated as
Physical exposure was defined by offshore rock
geomorphic shape related to area and height relative to 1
ISD
n (3)
2
the North American Vertical Datum of 1988 (NAVD 88).
Rocks were categorically grouped by area and height. i
Ni
Surface area was calculated (square meters [m2]) in
ArcGIS by manually digitizing the extent of each rock that where
was visible from orthoimagery; rocks were then grouped ni is the abundance of species i, and
into “small (2,000 m2)” categories. Height in meters ISD Inverse Simpson diversity
relative to NAVD 88 was extracted for each rock extent
from the 2009–11 California Coastal Conservancy Lidar Summed over all species, the metric tells us the sum of
Digital Elevation Model: Coastal California, which squares of all abundance ratios.
was downloaded from the NOAA data access viewerSpatial Sea-level Rise Vulnerability Assessment (Objective 3) 11
Figure 5. Vulnerability analysis for the California Coastal National Monument (exposure
of rocky shoreline habitats and sensitivity of the biological community [birds and marine
mammals]).
Table 2. Exposure ranking based on rock height and area.
[>, greater than; m, meter; 12 m) (3–12 m) (2,000 m2) 1 2 3
Medium (150–2,000 m2) 2 3 4
Small (12 Climate Change Vulnerability Assessment for the California Coastal National Monument
We choose the ISD index because it has a lower limit of fell within the intermediate rock height bin, with 32 percent
1 (for example, one species observed), making it more suitable in the low and 29 percent in the high rock height categories.
for the vulnerability calculation than other diversity indices, Rock exposure analysis, which is directly related to the height
which have a lower limit of zero. Rocks that had no observed of the rock, showed that 49 percent of surveyed rocks had an
species received a sensitivity score of 0.5; this was done to exposure ranking of 4 or 5 (fig. 7).
account for any detection issues and the mobile nature of the A total of 40 offshore rocks were surveyed within the
species we were surveying. We calculated species (avian and Point Arena-Stornetta Unit (fig. 8) and summarized in table 3.
pinniped) richness and sensitivity by individual rock. We Within rock size classes, 2.5 percent were large, 47.5 percent
used an analysis of variance to test for differences in rock size were medium, and 50 percent were small (fig. 9). The highest
class, height class, and exposure metrics. Rock vulnerability rock exposure class (class 5), calculated by composite size and
was described relative to habitat loss (for example, nesting height (table 2), amounted to 30 percent of rocks surveyed,
and roosting habitat by avian species and potential pinniped and class 4, the second most exposed, held 27.5 percent of the
haul-out areas). Trinidad and Point Arena-Stornetta Unit data rocks (fig. 10).
were combined to determine the sensitivity scores because of
the low number of species counted in Point Arena-Stornetta
Unit. To account for the timing of our surveys, which occurred Biological Resources
after the peak of the breeding season, we used feedback from
Seabird roosting and nesting on offshore rocks comprised
the workshop and local surveys of seabird colonies to compare
most of the avian behaviors observed during the Trinidad
our data to data collected during nesting season.
Unit boat surveys (table 4, 5; fig. 11). Three different pinniped
species were observed, all of which are protected under the
federal Marine Mammal Protection Act (MMPA; table 5;
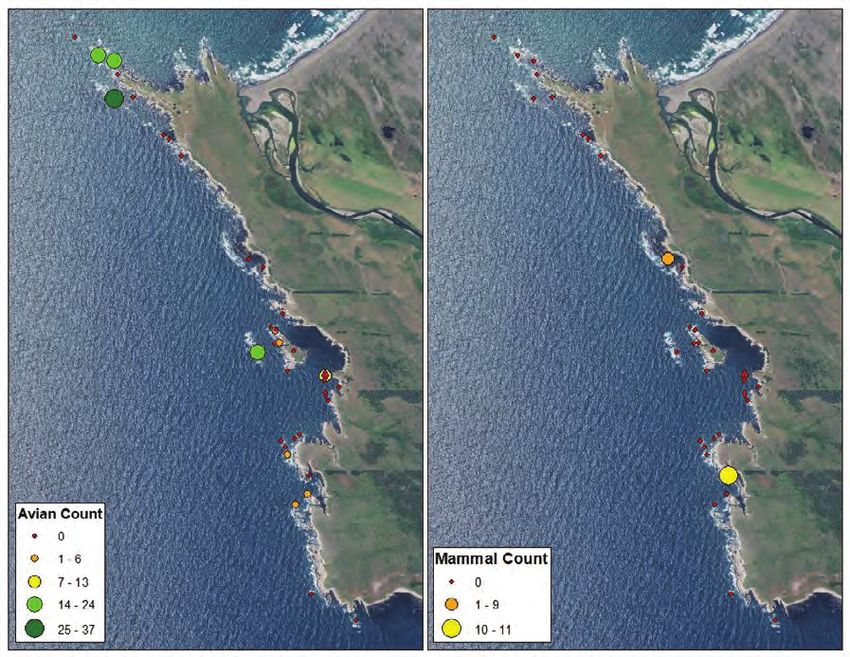
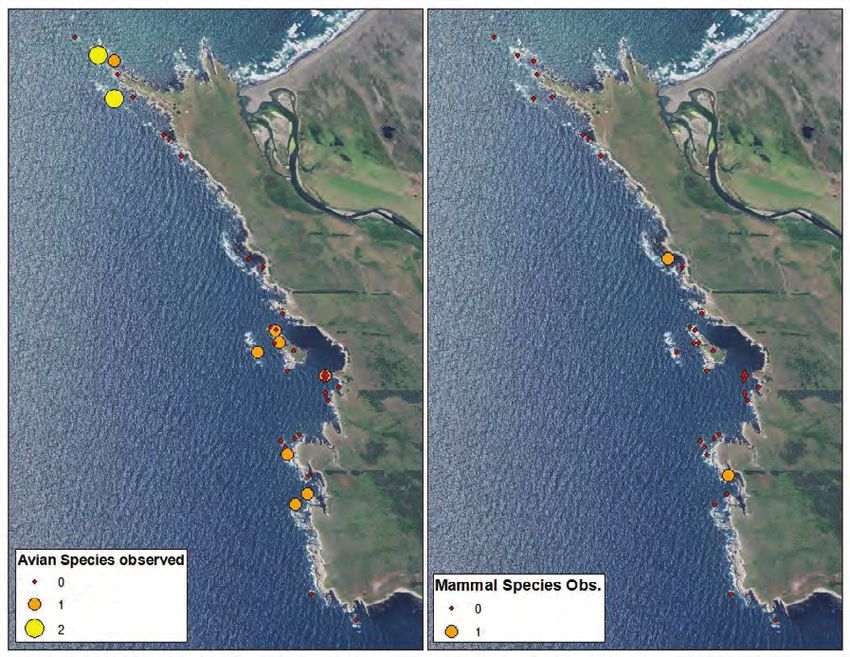
Results fig. 12).Birds were observed on features of every size, from
roosting on the smallest and lowest rocks, to major nesting
Physical and Geological Features colonies on larger rock features (for example, Flatiron Rock;
figs. 13–15). Pinnipeds were observed on nearshore shelves
A total of 138 offshore rocks were identified within the and offshore rocks (for example, Cone and Turtle Rocks;
Trinidad Unit (fig. 6) and summarized in table 3. The rock figs. 13, 14).
area ranged from 0.5 to 16,638 square meters (m2) with an Birds and mammals mainly were observed on onshore
average area of 789 m2 and a standard deviation (SD) of cliff habitat, coastal shelves, the Sea Lion Rock feature, and a
2,277 m2. Rock height ranged from 0.39 to 47.7 meters (m) small number of offshore rocks in the Point Arena-Stornetta
with an average height of 11.7 and a SD of 10.87 meters Unit. Seabirds (table 4, 6; figs. 16–18) were observed only on
relative to NAVD 88. Rocks were almost evenly split across 10 of the 40 rocks surveyed. Harbor seals only were observed
three rock height categories and rock area and height were on 2 of the 40 rocks but were found in higher concentrations
well correlated. Most (39 percent) of the Trinidad Unit rocks than at the Trinidad Unit.
Table 3. Summary of data collected on rocky shoreline habitats within Trinidad and Point Arena-Stornetta Units.
[m2, square meter; LiDAR, light detection and ranging; m, meter; Min, minimum; Max, maximum]
Total number Number of Number of
Area Height
Site Exposure Sensitivity Vulnerability of species avian species mammal species
(m2) (LiDAR; m)
observed observed observed
Trinidad
Min 0.49 0.39 1.00 0.50 1.00 0.00 0.00 0.00
Max 16,638.40 47.69 5.00 2.80 4.42 5.00 5.00 2.00
Mean 789.67 11.67 3.42 0.96 2.67 1.03 0.93 0.09
Point Arena-Stornetta
Min 23.31 0.11 1.00 0.50 1.00 0.00 0.00 0.00
Max 20,261.40 15.60 5.00 2.97 4.47 2.00 2.00 1.00
Mean 774.01 4.75 3.78 0.65 2.54 0.35 0.30 0.05You can also read