Coca-Cola Bottlers Japan Holdings Inc - Full-year 2021 Earnings Presentation February 14, 2022 - NET-IR
←
→
Page content transcription
If your browser does not render page correctly, please read the page content below

Full-year 2021
                                                 Earnings Presentation
                                                 February 14, 2022

                 Coca-Cola Bottlers Japan Holdings Inc.

Calin Dragan, President
Bjorn Ivar Ulgenes, Vice President & CFO
(Posted to CCBJH website on February 10, 2022)
Forward-looking statements
The plans, performance forecasts, and strategies appearing in this material are based on the assumptions and judgment of the management
of Coca-Cola Bottlers Japan Holdings Inc. (CCBJH or Company) in view of data obtained as of the date this material was released. These
forecasts may differ materially from actual performance due to risks and uncertain factors such as those listed below.
Risks and uncertain factors are not limited to the items listed below. They are also included in our annual securities report, or “Yuka Shoken
Houkokusho”.
• Agreements with The Coca-Cola Company and Coca-Cola (Japan) Company Limited.
• The quality and safety of products
• Market competition
• Natural environment, such as climate, disaster, water resources, etc.
• Legal environment
• Leakage or loss of information
• Change of economic conditions, such as personal consumption, currency exchange rates, prices of raw materials, fair value of assets, etc.
• Business integration, streamlining and optimization of business processes, etc.
• Uncertain factors other than those above
The information in this presentation is provided for informational purposes and should not be construed as a solicitation of an investment in
our securities.
CCBJH undertakes no duty to update any statement in light of new information or future events. You should rely on your own independent
examination of us before investing in any securities issued by our company.

                                                                                                                                            2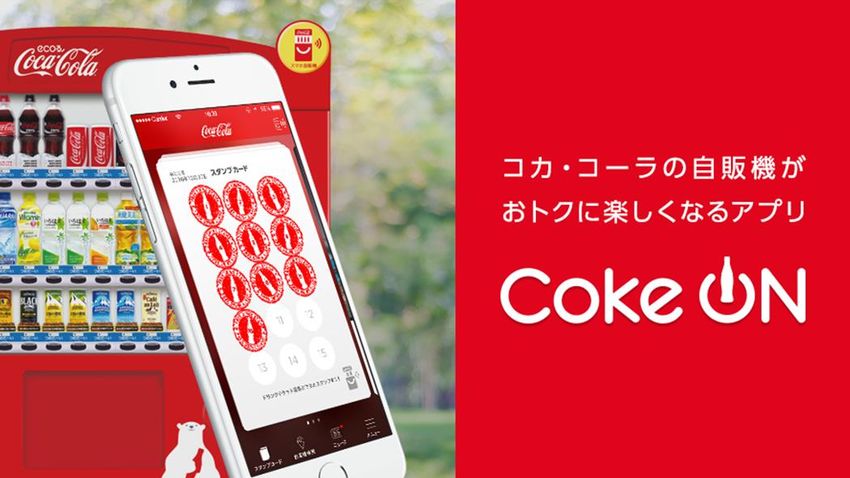
Coca-Cola Bottlers Japan Holdings Inc. (CCBJH)
Full-year earnings presentation

    Overview and Situational Analysis

    Full-year 2021 Results and 2022 Outlook

    Q&A

                                                 3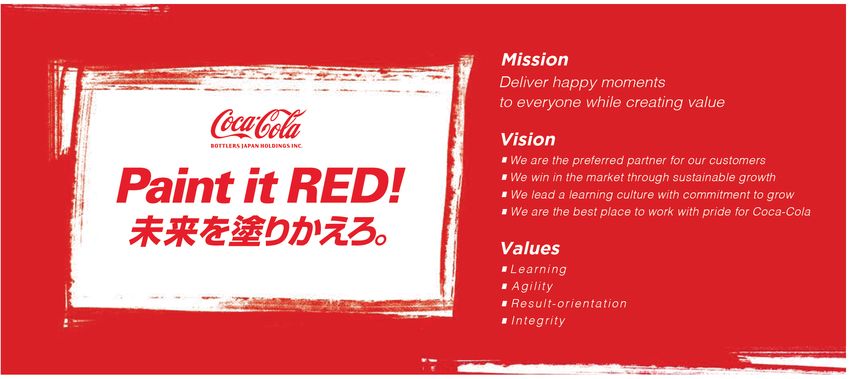
Overview and
Situational Analysis
2021 Overview – Business Environment
  Q4 sales volume and business income grew YoY and exceeded guidance, as traffic
  improved after lifting of state of emergency
  Key initiatives in 2021 showed results, focusing on what we can control
  2021 full-year business performance was heavily impacted by COVID-19 and bad
  weather during peak summer season

             Market Environment                                       Key Initiatives

 ✓ Consumer spending pattern impacted by pandemic   ✓ Vending value share growth for 33 months
 ✓ Bad weather during peak summer                   ✓ New products contributing to volume growth
 ✓ Competition continues to be intense              ✓ Marketing investment & pricing for sustainable growth
 ✓ Rise in commodity and energy prices              ✓ Transformation continues to deliver savings
 ✓ Renewed sense of uncertainty with Omicron        ✓ Good stewards of capital

                                                                                                              5
Financial Highlights

 Full-year volume growth of +2% YoY, with multiple new products contributing. Full-year
 revenue down -1% YoY with changing consumer spending patterns due to COVID-19
 impacting channel and package mix, and lower revenue per case
 Value share continued to grow in the vending channel for 33 consecutive months. Clear
 recovery trend for supermarkets, drugstores and discounters
 Business income for full-year decreased by -14.8B yen YoY due to challenging business
 environment, cycling of one-time cost savings from previous year and rising commodity
 prices. Volume growth and additional cost saving measures allowed us to exceed our
 earnings forecast by +1.2 billion yen
 With steady transformation, achieved about 9 billion yen of recurring cost savings

                                                                                          6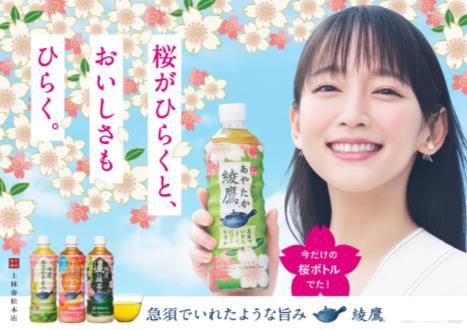
Full-year 2021 Results
Full-year 2021 results vs. 2020
Continued COVID-19 impact; slow volume recovery
                                                                                                                                                    Unit: Million JPY

                                                                                           2021                        2020                           2021
                                                                                                                                        YoY
                                                                                           Actual                      Actual                         Plan
Continuing Operations (Beverage Business)
  Revenue                                                                                     785,837                        791,956      -0.8%         782,600
  Beverage Sales Volume (Million Cases)                                                                468                       458          +2%               467
   NARTD (Non-alcoholic ready to drink) Beverage Volume (Million Cases)                                460                       450          +2%               459
  COGS                                                                                        435,332                        429,040      +1.5%         435,400
  Gross Profit                                                                                350,505                        362,916      -3.4%         347,200
  SG&A                                                                                        363,750                        359,645      +1.1%         361,800
  Business Income (Loss)                                                                      (14,662)                           169            -       (15,900)
   Operating Income (Loss)                                                                    (20,971)                       (11,722)           -       (24,200)
Net Income (Loss) attributable to owners of parent                                              (2,503)                       (4,715)           -         (4,600)
(Total of continuing and discontinued operations)

                                             Some inconsistencies with the volume data provided in past presentations may                                               8
                                             be expected as a result of standardization of volume and revenue calculation.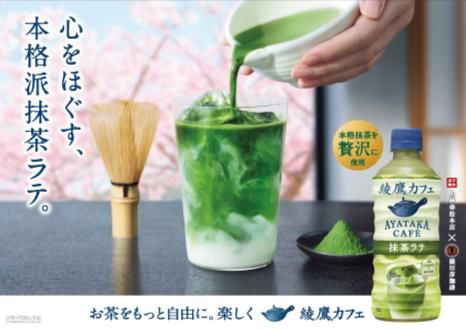
Full-year 2021 drivers of Business Income
 Volume recovery not enough to offset pricing and commodity pressure

             Full-year 2020               Volume, Price                    DME                      Commodity              Manufacturing               Others              Full-year 2021
                 Actual                      & Mix*                  (Direct Marketing                                                                                         Actual
                                                                    Expense, fixed only)

                     0.2
                                                                 • Resumed marketing
                                             -10.5                 investment restrained in
                                                                   2020, strategically invested
                                                                                                                                                • Transformation related
                                                                   in growing channels
                                                                 • New product launch                                                             savings
                                                                                                                                                • Total labor cost decreased
                                                                                                                                                                               -14.7
                                                                                                                                                • Logistic cost rise due to
                                    • Full-year volume                                                                 • Volume growth offset     rising volume and demand
                                      increased by +2%, but              -8.4                     • Impact of rising     capacity investments
                                                                                                                         depreciation impact
                                                                                                                                                  volatility
                                      impacted by decline in                                        commodity price
                                      revenue per case                                              since Q2 onwards   • Improved
                                    • Responding to
                                      competitive environment
                                                                                                                         manufacturing
                                                                                                                         efficiency                   +5.7
                                                                                                       -2.4                  +0.7
                                                                                                                                                                                    Unit: B JPY
                                                                                                                                                                                    (Rounding off less than unit)
*Volume, Price & mix represent marginal profit of our commercial activities including variable costs and deduction from revenue in IFRS.

                                                                                                                                                                                                                    9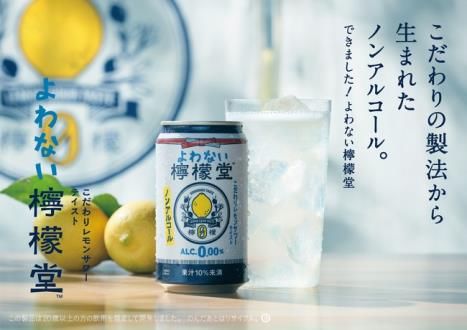
NARTD beverage volume performance by channel
Despite new products, slow traffic recovery & bad weather impacted, volume recovery +2%
  Full-year total volume +2%                                                                                                SM, D&D: Large size PET growth in water, sparkling, NST
  By channel                                                                                                                benefitting from rise in at home consumption
                                                                                          Wholesale                         CVS: Strategically implemented 950ml PET contributed,
                                                     Vs. PY                       Volume revenue  per
          4%                                                                                 case                           but overall decreased due to intensified competition
                                                                                                                            VM: Slow traffic recovery and bad weather during peak
                                         Supermarket (SM)                              +5%            -48Yen
      14%
                                                                                                                            summer season. New products in NST, water and sport
                    26%                  Drug & Discounter (D&D)                       +8%            -58Yen                contributed
                                         Convenience Store (CVS)                       -2%            -41Yen                R&F: Impacted by COVID-19 for the whole year especially
  24%
                       17%               Vending (VM)                                  +1%            -30Yen                in food channel
            15%                          Retail & Food (R&F)                         -10%            +26Yen                 Online: Growth in all categories, capturing at home
                                                                                                                            consumption and expansion of label-less products
                                         Online                                     +62%              -77Yen
                                                                                                                            Wholesale revenue per case: SM, D&D decreased due to
                                      Volume, wholesale revenue per case : Includes impact of
                                      case configuration change for 1.5LPET products.
                                                                                                                            changes in case configurations for 1.5LPET products. VM
                                                                                                                            was affected by continued implementation of low-priced
                                                                                                                            products to promote purchasing opportunities.
NARTD: Non-alcoholic ready-to-drink

                                                               Note: Volume doesn’t include alcohol. Revenue per case doesn’t include DFR (deduction
                                                               from revenue). Some inconsistencies with the volume data provided in past presentations                                10
                                                               may be expected as a result of standardization of volume and revenue calculation.
NARTD beverage volume performance by category
Full-year total volume +2%
By category Sparkling: 500ml PET volume was impacted by bad
weather in summer. Premium Fanta series
Vs. PY Volume
contributed and large PET grew
5% 7% Sparkling Flat NST: New products such as Yakan Barley Tea from
26% Non-sugar tea (NST) +7% Hajime, Ayataka Cafe Matcha Latte contributed
20% Sports +3% Sports: Aquarius with increased package size sold
mainly in VM contributed
22% Water +23%
11% Water: Growth driven by both small and large PET.
Coffee -3%
9% New products ICY SPARK contributed to growth
Juice -5% Coffee: Can coffee declined, but new products
Volume: Includes impact of case configuration change for 1.5LPET
products.
COSTA COFFEE, Georgia Shot & Break contributed
to PET bottle volume growth
Juice: Weakness in R&F as outlets were impacted
by COVID-19
Note: Volume doesn’t include alcohol. Revenue per case doesn’t include DFR (deduction
from revenue). Some inconsistencies with the volume data provided in past presentations 11
may be expected as a result of standardization of volume and revenue calculation.Building a foundation for value share growth
Vending, SM, D&D market share growth on annual basis
Full-year Market Share Value Volume OTC Retail Price Vs. Market
(Jan. to Dec., vs. PY, PP) Vs. PY
(Jan. to Dec., JPY per bottle) Average
VM +4.2 +4.3 Small PET +4.6 -2.1
OTC -0.7 -0.5 Large PET +21.0 -4.3
Data source standards changed from 2021. SPET(351~650ml), LPET(1.251L~)
SM, D&D +0.1 +0.2 Source: Intage
VM, SM, D&D Value Share (vs. PY, PP)
Market share
Vending value share continues to grow for 33
consecutive months
SM, D&D value share showing recovery despite the
competitive environment
CVS continues to be a channel facing challenges with
intensified competition
Q1 Q2 Q3 Q4 Q1 Q2 Q3 Q4 Retail pricing trends
2020 2020 2020 2020 2021 2021 2021 2021
Continued price premium vs. market average with
SM, D&D Value VM Value effective promotional activities in the market
Source: Intage (SCI/SRI)
12Priority on good stewards of capital
Focus on shareholder value creation
Shareholder value creation
Balance sheet and
Dividends Capex and depreciation
cash flow
- Resumed stable dividend - Solid financial position: - Continued restraint in
payout despite challenging 56.8% equity ratio at end of purchasing and placement of
business environment 2021 new sales equipment helps to
control capex and depreciation
2021 - Sold Q’sai shares to focus on - In July 2022, new Akashi Mega
50 Yen/share core business
DC will be completed
(+25 Yen YoY) - Continue to sell down idle
Interim Year-end assets and cross-held shares (Billion JPY) 2021 Actual Vs PY
25 25 - Consolidating and closing CAPEX* 39.1 -23.8
Yen/share Yen/share sales centers allows us to
Depreciation 57.2 -1.8
(+25 Yen YoY) (Flat YoY) free up capital
*Not including IFRS16 non cash items.
132022 Outlook
2022 Operating Environment
Omicron strain rapidly rising, reintroducing uncertainty
                                        COVID-19 cases on the rise again
Number of new cases, severe patients
                  120,000
                                                 # of new cases               # of severe patients
                                                                                                                                 1,400
                                                                                                                                                                ✓ Omicron strain has once again brought back
                  100,000                                                                                                        1,200
                                                                                                                                                                  uncertainty in the market. Expecting some

                                                                                                                                         # of severe patients
                                                                                                                                 1,000
                   80,000
                                                                                                                                                                  volume recovery in the market. However, the
 # of new cases

                                                                                                                                 800
                   60,000
                                                                                                                                 600                              recovery may be delayed
                   40,000

                                                                                                                                                                ✓ Rising commodity prices continue to put
                                                                                                                                 400

                   20,000                                                                                                        200

                       0                                                                                                         0                                pressure on profitability
                            Oct           Nov                     Dec                         Jan                          Feb

                                                            Source: Minister of Health, Labor and Welfare, as of Feb                                            ✓ Need to account for the cycling impact of the
Traffic data in major stations (% vs. LY)                                                                                                                         one-time cost savings achieved in 2021
    40

    30                                                                                                                                                          ✓ With the re-introduced uncertainty, 2022
                                                                                                                           Shinjuku, TOKYO
    20                                                                                                                                                            full-year guidance is not provided. We will
                                                                                                                           Nagoya
    10                                                                                                                                                            disclose it at the appropriate time
          0                                                                                                                OSAKA

 -10
                     W40 W41 W42 W43 W44 W45 W46 W47 W48 W49 W50 W51 W52                 W1    W2          W3   W4   W5
                                                                                                                           Source:NTT docomo
                                  Oct      Nov                          Dec                          Jan             Feb

                                                                                                                                                                                                                  15
2022 Targets
Focusing on what we can control
Market share Recurring cost savings Capex
Target Target Target
5 B yen 46 B yen
Value share growth in vending Control capex and monitor
Transformation continues to
Balanced approach in OTC with market environment for
deliver savings
sustainable pricing in mind expanding investments gradually
*Not including IFRS16 non cash items
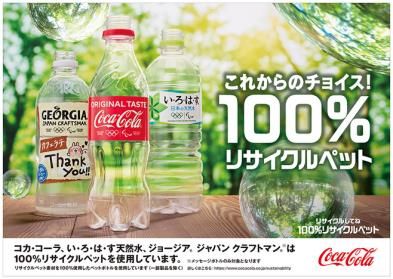
Depreciation Annual dividends Sustainable PET Ratio
Target Target Target
55 B yen 50 yen / share 50%
Solid balance sheet allowing About 60% reduction in CO2 per
Controlled capex spending and
bottle, switching from virgin PET
decrease YoY stable dividend payout
bottle to 100% sustainable PET bottle
16Marketing and branding update
Update from Coca-Cola (Japan) Company, Limited

                   2021 FY Review

                   2022 Q1 Initiative Highlights

                                                   18
2021 FY Review
Successfully gained KO NARTD value share and Weekly+ purchasers ※1
(+690K people to total 10 mil. people) in tough market condition
Successful Innovations Coke ON expansion Cultural Leadership
13.1% ※2
100mil+ ※3 ※1
value share bottles VM value share +3.9pts., ※7
World Without Waste
(Barley Tea)
Coke ON 33mil+ downloads
Mainstream
※4
100mil+ 50mil+ Diversity & Inclusion
25.9%
bottles bottles
※6
※5
value share
(Small PET Coffee)
Premium
※1. Investigated by CCJC, 2021 FY, ※2. Apr.26-Jul 25,2021 INTAGE SRI+, All Channels, in Barley Tea market, Value share ※3. May10–Dec31 2021 (Shipment base, CCJC data), ※4. Apr–Dec,2021 INTAGE SRI+, All Channels, Under 350ml PET Bottle Coffee market, Value share, ※ Mar – Nov 5,2021 (Shipment base, CCJC data) ※6. 2021 FY (Fanta Premier Grape + Peach + Orange Total, Shipment base, CCJC data), ※7. 2021 FY
192022 Marketing Strategy
Strengthen the core & grow year-2 and selective innovations
with continuously flexible and timely actions
PIVOT TO CORE FEWER, BIGGER STAY@HOME
コアへの原点回帰 INNOVATIONS 家庭内需要の獲得
選択と集中
202022 Q1 Initiative Highlights Drive core growth for Coke, Georgia,
COSTA and Ayataka & Tap into Non-Alcohol category as a white space
Coca-Cola TM Georgia TM & COSTA
AR Fortune bottle from Jan. & Coke & Meal from Feb. New campaign “The coffee that makes you glow”
under Global “Real Magic” platform from Jan. & Upgrade black coffee portfolio from Feb.
& COSTA Restage from March
Ayataka Core & Ayataka Café Matcha Latte Yowanai Lemon-Dou
Ayataka spring “Sakura” campaign KO’s first ever Non-Alcoholic brand
to drive the Core and Matcha Latte with ABV 0.00%
212022 Key collaboration points with CCBJH
Further accelerate our strengths & improve growth opportunities
FURTHER ACCELERATE ROI OPTIMIZATION
WIN IN IN-STORE EXECUTION
KO SYSTEM COLLABORATION
• System approach to • Revenue growth
Strategic Customers • MIX improvement
(OTC + Online + HORECA)
(Channel/Portfolio)
• Leverage Coke ON • DME effectiveness
for VM
22Areas of Focus & Strategy
2022 Commercial Strategic Pillars
                                                          Growth through         Customer Management &
 Expand Portfolio Edge        Margin Focused Pricing
                                                          Vending Channel          Execution Excellence

 High quality innovation to   Targeted marketing       Revenue recovery by per   Strengthen customer
 drive growth in volume /     investments focused on   machine growth and VM     relationships with
 revenue / market share       growth channels and      placement, supported by   proposal type sales
 and premiumization           categories               high market share base    Accelerate DX across
 Focus on core to enhance     Strengthen consumer-     Leverage our digital      various areas of analysis,
 presence for solid base      oriented marketing       platform "Coke ON" and    planning, operation and
 Capture consumer / social    investment               update functions for      execution
 needs with packaging         Appropriate level of     improved engagement       Transformation continues
 Expansion into white         promotion                Improve operations        Collaboration with Coca-
 space                        Price revision and       further through DX        Cola Japan to leverage
                              continuous monitoring                              Coke System network

                                                                                                              24
Pricing & Marketing Investment Strategy for 2022
Strengthen profit base for sustainable growth
Price revision announced. Enhancing foundation for sustainable growth
COVID-19 impact and competition expected to remain intense, price
revision will be combined with strategic marketing investments
Implement appropriate pricing and promotional activity
Price revision to improve profitability Execute strategic marketing spend
✓Large PET (1.5L, 2L) *with some exceptions such as water ✓Targeted marketing investments with ROI focus to
✓Shipping price revision rate: Approx. +5 to 8% expand market share over the mid- to long-term
✓Revision Date: May 1, 2022 *based on shipment ✓Strategy based on balance between
✓Target Channels: Supermarkets, drugstores, competitiveness and profitability
discounters, online ✓Control promotion intensity according to demand
25Growth through Vending Channel
Vending business as a key driver for returning to growth trajectory
Initiatives for Growth Leveraging Coke ON Further Operation Optimization
Improve per-machine sales Enhance customer engagement Stable operation of the new
Focus on core with Coke ON business model
Pricing balanced with business - Achieved 33 Million downloads
Increase on-line vending
environment and profitability - Increased purchases through Coke ON
machines
DX to enhance product line-up
Strengthen promotion through Use of IT tools and DX
Coke ON
Expand Selling Space Enhance collaboration with
Increase new vending location Increase attractive new services supply chain (Mega DC)
with ROI focus for consumers Improve efficiency & capabilities
Offering new solutions
26Solid Supply Chain Network for Sustainable Growth
Take measures for short-term challenges and keep driving transformation
Improving commercial and supply chain collaboration and standardizing operation with DX
Logistics network optimization leveraging Mega DC progressing as planned. Working
towards stable operation of "Saitama Mega DC" and smooth launch of "Akashi Mega DC"
・Saitama: Steadily contributing to the new logistics model. Majority of target sales centers have
relocated their inventory to the Mega DC and have been consolidated or closed
・Akashi: Expected to start operation in July ahead of initial plan. Aiming for a smooth transition to
the new model by incorporating the experiences from Saitama Mega DC
Feb 2021
Saitama started Inventory/location consolidation Improvement Activity Stable operation
operation
Agile & low-cost
Taking the learnings of Saitama for smooth Akashi launch operation
July 2022 for sustainable
Akashi Inventory/location Improvement
Under construction start growth
consolidation activity
(Kansai) operation
27ESG Initiatives
Steady progress in creating shared value
Towards “World Without Waste” Innovation and diversity
Achieved 40% use of sustainable 4.5-star in Nikkei Smart Work
materials, including "bottle to Management Survey for
bottle,” ahead of the industry productivity revolution
On track towards 2030 package through work-style reforms
vision Gold rating in PRIDE Index,
Expansion of label-less bottle recognition for initiatives
products related to sexual minorities
Water Sustainability Workplace safety
A- score in a survey by CDP, an 3rd round of COVID-19 vaccination starting
international environmental at our workplaces in early March
non-profit organization
Greenhouse Gas (GHG) Reduction Excellence in ESG initiatives
Ambitious GHG reduction targets as Included in DJSI Asia
Japan Coca-Cola system Pacific listing for four
Plan and execution in place for 2030 consecutive years
28Staying true to our Mission, Vision & Value
29Key Takeaways
Key Takeaways

 While 2021 was a challenging year, key initiatives we focused on are
 delivering results. Performance in Q4 makes us confident that we can grow
 when the market recovers
 Omicron has reintroduced uncertainly into the market. In uncertain
 business and a competitive environment, cost headwinds have to be
 accounted for when operating our business
 We will continue to prepare ourselves for when the market normalizes.
 Strengthening our ability to capture growth opportunities, solidifying our
 profitability base and accelerating transformation that will lead to
 sustainable future growth

                                                                              31
Q&A
Appendix
NARTD channel/category/package volume performance
Q4 QTD 2021 (Oct to Dec) volume: +3%                                                                  By package
By channel                                                                                                                                                  vs PY             Volume
                                                                       Wholesale
                                                                                                       Full-year 2021
                                     Vs. PY                     Volume revenue                                              5%                           S-PET                     +3%
          4% 1%                                                        per case                                       2%
                                                                                                                                                         M-PET                    +89%
                            Supermarket (SM)                        +1%          -11Yen                              8%                                  L-PET                     +6%
                                                                                                                5%
     17%           24%      Drug & Discounter (D&D)                 +8%          -36Yen                                                                  Can                        -6%
                                                                                                                                        39%
                                                                                                                12%
                            Convenience Store (CVS)                  -4%         -12Yen                                                                  Bottle Can                 Flat
                      15%   Vending (VM)                            +1%          -19Yen                                                                  Syrup                    -13%
    24%                                                                                                               25%
                            Retail & Food (R&F)                      -1%         +19Yen                                                                  Powder                     -4%
                15%                                                                                                                      4%
                            Online                                +76%         -115Yen                                                                      vs PY              Volume
                                                                                                     Q4 QTD 2021
By category
                                                                                                                            4%                           S-PET                      +2%
           8%                        Vs. PY                     Volume                                                3%
      6%                                                                                                                                                 M-PET                   +101%
                            Sparkling                                 -2%
                    26%                                                                                               10%                                L-PET                      +4%
                            Non-sugar tea (NST)                     +10%
                                                                                                                 5%                     39%              Can                         -8%
    22%
                            Sports                                  +17%
                                                                                                                11%                                      Bottle Can                  -1%
                   22%      Water                                   +20%
       11%                                                                                                                                               Syrup                       -3%
                                                                                                                           24%
              5%            Coffee                                    -2%
                                                                                                                                                         Powder                     +6%
                            Juice                                     -1%                                                                 4%
                                                                                                                                               S-PET: PET under 600ml/L-PET: PET above 1.5L
                                              NARTD: Non-alcoholic ready-to-drink
                                              Note: Volume doesn’t include alcohol. Revenue per case doesn’t include DFR (deduction
                                              from revenue). Some inconsistencies with the volume data provided in past presentations
                                                                                                                                                                                           34
                                              may be expected as a result of standardization of volume and revenue calculation.
THANK YOU Investor Relations Coca-Cola Bottlers Japan Holdings Inc. ir@ccbji.co.jp https://en.ccbj-holdings.com/ir/
You can also read