Comprehensive epithelial tubo-ovarian cancer risk prediction model incorporating genetic and epidemiological risk factors
←
→
Page content transcription
If your browser does not render page correctly, please read the page content below
Cancer genetics
J Med Genet: first published as 10.1136/jmedgenet-2021-107904 on 29 November 2021. Downloaded from http://jmg.bmj.com/ on January 10, 2022 by guest. Protected by copyright.
Original research
Comprehensive epithelial tubo-ovarian cancer risk
prediction model incorporating genetic and
epidemiological risk factors
Andrew Lee ,1 Xin Yang ,1 Jonathan Tyrer,2 Aleksandra Gentry-Maharaj,3
Andy Ryan,3 Nasim Mavaddat,1 Alex P Cunningham,1 Tim Carver,1 Stephanie Archer,4
Goska Leslie,1 Jatinder Kalsi,5,6 Faiza Gaba,7 Ranjit Manchanda ,7,8,9
Simon Gayther,10 Susan J Ramus ,11,12 Fiona M Walter,4 Marc Tischkowitz,13
Ian Jacobs,5,11 Usha Menon,3 Douglas F Easton,1,2 Paul Pharoah ,1,2
Antonis C Antoniou 1
►► Additional supplemental ABSTRACT using a longitudinal serum CA125 algorithm in
material is published online Background Epithelial tubo-ovarian cancer (EOC) has women from the general population resulted in
only. To view, please visit
the journal online (http://dx. high mortality partly due to late diagnosis. Prevention significantly more women diagnosed with early-
doi.org/10.1136/jmedgenet- is available but may be associated with adverse effects. stage disease but without a significant reduction
2021-1 07904). A multifactorial risk model based on known genetic in mortality.2 Four- monthly screening using the
and epidemiological risk factors (RFs) for EOC can help same multimodal approach also resulted in a stage
For numbered affiliations see
identify women at higher risk who could benefit from shift in women at high risk (>10% lifetime risk of
end of article.
targeted screening and prevention. EOC).3 Currently, risk-reducing bilateral salpingo-
Correspondence to Methods We developed a multifactorial EOC risk oophorectomy (RRSO), on completion of their
Professor Antonis C Antoniou, model for women of European ancestry incorporating the families, remains the most effective prevention
Department of Public Health effects of pathogenic variants (PVs) in BRCA1, BRCA2, option,4 and it has been recently suggested that
and Primary Care, University RAD51C, RAD51D and BRIP1, a Polygenic Risk Score RRSO would be cost-effective in postmenopausal
of Cambridge Centre for
(PRS) of arbitrary size, the effects of RFs and explicit women at >4% lifetime EOC risk.5 6 Beyond
Cancer Genetic Epidemiology,
Cambridge CB1 8RN, UK; family history (FH) using a synthetic model approach. The surgical risk, bilateral oophorectomy may be asso-
a ca20@medschl.cam.ac.uk PRS, PV and RFs were assumed to act multiplicatively. ciated with increased cardiovascular mortality7 and
Results Based on a currently available PRS for EOC a potential increased risk of other morbidities such
AL and XY are joint first authors. that explains 5% of the EOC polygenic variance, the
as parkinsonism, dementia, cardiovascular disease
Received 7 April 2021 estimated lifetime risks under the multifactorial model in and osteoporosis,8 9 particularly in those who do
Accepted 18 May 2021 the general population vary from 0.5% to 4.6% for the not take menopausal hormone therapy (MHT).10
first to 99th percentiles of the EOC risk distribution. The Therefore, it is important to target such prevention
corresponding range for women with an affected first- approaches to those at increased risk who are most
degree relative is 1.9%–10.3%. Based on the combined likely to benefit.
risk distribution, 33% of RAD51D PV carriers are
Over the last decade, there have been significant
expected to have a lifetime EOC risk of less than 10%.
advances in our understanding of susceptibility to
RFs provided the widest distribution, followed by the
EOC. After age, family history (FH) is the most
PRS. In an independent partial model validation, absolute
important risk factor (RF) for the disease. Approx-
and relative 5-year risks were well calibrated in quintiles
imately 35% of the observed familial relative risk
of predicted risk.
(FRR) can be explained by rare pathogenic variants
Conclusion This multifactorial risk model can facilitate
(PVs) in the BRCA1, BRCA2, RAD51C, RAD51D
stratification, in particular among women with FH of
cancer and/or moderate-risk and high-risk PVs. The and BRIP1 genes.11–14 Recent evidence suggests
model is available via the CanRisk Tool (www.canrisk. that PALB2, ATM, MLH1, MSH2 and MSH6 are
org). also involved in the EOC genetic susceptibility.14–18
Common variants, each of small effect, identified
through genome- wide association studies,19 20
explain a further 4%. Several epidemiological RFs
© Author(s) (or their INTRODUCTION are also known to be associated with EOC risk,
employer(s)) 2021. Re-use including use of MHT, Body Mass Index (BMI),
permitted under CC BY. Epithelial tubo-ovarian cancer (EOC), the seventh
Published by BMJ. most common cancer in women globally, is often history of endometriosis, use of oral contracep-
diagnosed at late stage and is associated with high tion, tubal ligation and parity.21–26 Despite these
To cite: Lee A, Yang X, advances, those at high risk of developing EOC
mortality. There were 7443 new cases of EOC
Tyrer J, et al. J Med Genet
Epub ahead of print: [please and 4116 deaths from EOC annually in the UK in are currently identified mainly through FH of the
include Day Month Year]. 2015–2017.1 Early detection could lead to an early- disease or on the basis of having PVs in BRCA1 and
doi:10.1136/ stage diagnosis, enabling curative treatment and BRCA2. However, more personalised risk predic-
jmedgenet-2021-107904 reducing mortality. Annual multimodal screening tion could be achieved by combining data on all
Lee A, et al. J Med Genet 2021;0:1–12. doi:10.1136/jmedgenet-2021-107904 1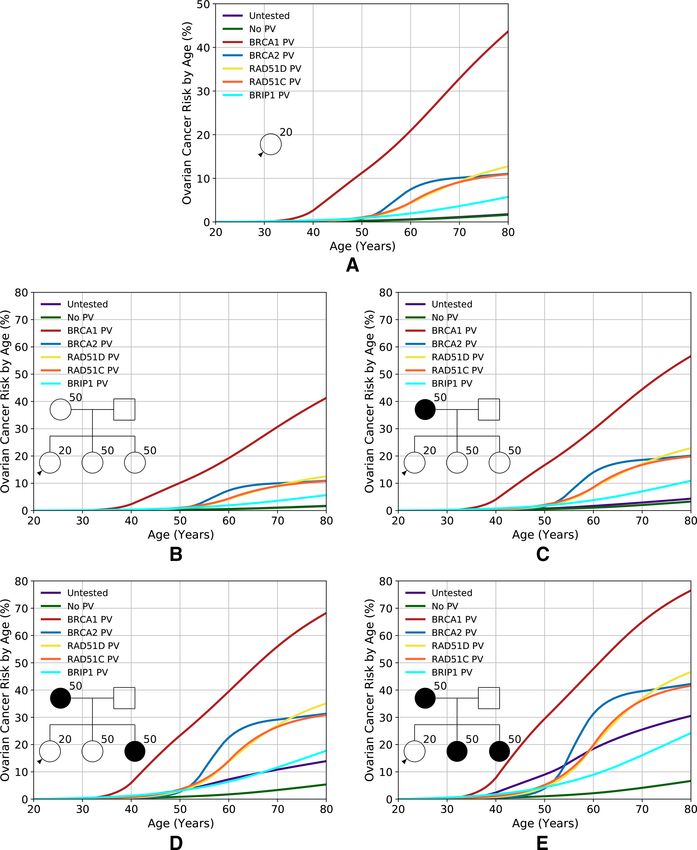
Cancer genetics
J Med Genet: first published as 10.1136/jmedgenet-2021-107904 on 29 November 2021. Downloaded from http://jmg.bmj.com/ on January 10, 2022 by guest. Protected by copyright.
known epidemiological and genetic RFs. The published EOC
Table 1 Summary of components of the EOC risk model
prediction models consider either RFs24 25 27 or common vari-
ants.24 28 No published EOC risk prediction model takes into RF group RF category Comments
account the simultaneous effects of the established EOC suscep- FH Explicit FH of ovarian and other Considers families
tibility genetic variants (rare and common), residual FH and cancers (breast, prostate, male breast of arbitrary size and
other known RFs. and pancreatic) structure, including
affected and unaffected
Using complex segregation analysis, we previously developed
relatives
an EOC risk prediction algorithm that considered the effects of
Sex Sex of all family members
PVs in BRCA1 and BRCA2 and explicit FH of EOC and breast
Age Ages at cancer diagnosis
cancer (BC).11 The algorithm modelled the residual, unexplained
or current ages/age at
familial aggregation using a polygenic model that captured other death of family members
unobserved genetic effects. The model did not explicitly include Genetic factors
the effects of other established intermediate-risk PVs in genes Rare BRCA1
such as RAD51C, RAD51D and BRIP1,12–14 29 which are now truncating/ BRCA2
included on routine gene panel tests, the effects of recently pathogenic
RAD51D
developed EOC Polygenic Risk Scores (PRSs) or the known RFs. variants
RAD51C
Here we present a methodological framework for extending
BRIP1
this model to incorporate the explicit effects of PVs in RAD51C,
RAD51D and BRIP1 for which reliable age-specific EOC risk Common Polygenic Risk Score Explaining 5% of the
genetic polygenic variance
estimates are currently available, up-to-date PRSs and the known
variants
EOC RFs (table 1). We used this multifactorial model to evaluate
Unobserved Residual polygenic component Accounts for the residual
the impact of negative predictive testing in families with rare PVs genetic effects familial aggregation of
and to assess the extent of EOC risk stratification that can be EOC
achieved in the general population, women with a FH of EOC Lifestyle/hormonal/reproductive
and those carrying rare PVs. We evaluated the performance of Height Measured in cm (five
a subset of this model in the UK Collaborative Trial of Ovarian categories)
Cancer Screening (UKCTOCS),2 where women from the general Body Mass Index Measured in kg/m2 (three
population were followed up prospectively. categories)
Parity Number of live births
METHODS (three categories)
EOC risk prediction model development Endometriosis Yes/no
No large datasets are currently available that include data on Use of oral contraception Years of use (five
categories)
all known genetic and other EOC RFs. Therefore, we used a
synthetic approach, described previously,30 to extend our Use of hormone replacement therapy Never/ever
previous EOC model11 by capitalising on published estimates of Tubal ligation Yes/no
the associations of each RF with EOC. This approach was shown Breast tumour Oestrogen, progesterone, HER2 As implemented in the
to provide valid risk estimates in the case of BC.30–32 pathology receptor, CK14, CK5/6 status BOADICEA breast cancer
model
Under the assumption that the effects of rare PVs, RFs and
Demographic factors
polygenic component are multiplicative on EOC risk, the inci-
Country of Country Defines the underlying
dence at age t for individual i was modelled as
( () () () ( ))
origin incidences used
()( ) () i ( ) ∑ i () i () i
λ i t = λ0 t exp βMG t + β RFρ t · zRFρ + βPG t xP , (1) Birth cohort Defined by the person’s year of birth Eight calendar year-
ρ
() specific sets of incidences
() i ( )
where λ0 t is the baseline incidence. βMG t is the age-specific Family Ashkenazi Jewish origin
log-relative risk (log-RR) associated with individual i ’s PV carrier ethnicity
status (explained further),()
relative to the baseline. The log-RR BOADICEA, Breast and Ovarian Analysis of Disease Incidence and Carrier Estimation
i Algorithm; EOC, epithelial tubo-ovarian cancer; FH, family history; RF, risk factor.
for non-carriers is 0. xP is the polygenotype for individual i ,
assumed to follow a(standard
) normal distribution in the general
population, and βPG t is the age-specific log-RR associated
()
with
i ( ) To define the penetrance, we assumed the following order of
the polygene, relative to the baseline incidence. β RFρ t is the
log-RR associated with risk- factor ρ at age t , which may depend dominance when an individual carried more than one PV (ie, the
()
i risk was determined by the highest-risk PV and any lower-risk
on PV carrier status, and zRFρis the corresponding indicator vari-
PVs ignored): BRCA1, BRCA2, RAD51D, RAD51C and BRIP1.33
able showing the category of risk-factor ρ for the individual. The
baseline incidence was determined by constraining the overall The population allele frequencies for RAD51D, RAD51C
incidences to agree with the population EOC incidence. To and BRIP1 and EOC relative risks (RRs) were obtained from
allow appropriately for missing RF information, only those RFs published data (online supplemental table S3).14 29 Although PVs
measured on a given individual are considered. in PALB2, ATM, MLH1, MSH2 and MSH6 have been reported
to be associated with EOC risk, PVs in MLH1, MHS2 and MSH6
Major gene (MG) effects are primarily associated with risk of specific subtypes of EOC
To include the effects of RAD51D, RAD51C and BRIP1, we (endometrioid and clear cell),17 and at the time of development,
used the approach described previously where PVs in these precise EOC age-specific risk estimates for PALB2 and ATM PV
genes were assumed to be risk alleles of a single MG locus.33 carriers were not available. Therefore, these were not considered
A dominant model of inheritance was assumed for all rare PVs. at this stage.
2 Lee A, et al. J Med Genet 2021;0:1–12. doi:10.1136/jmedgenet-2021-107904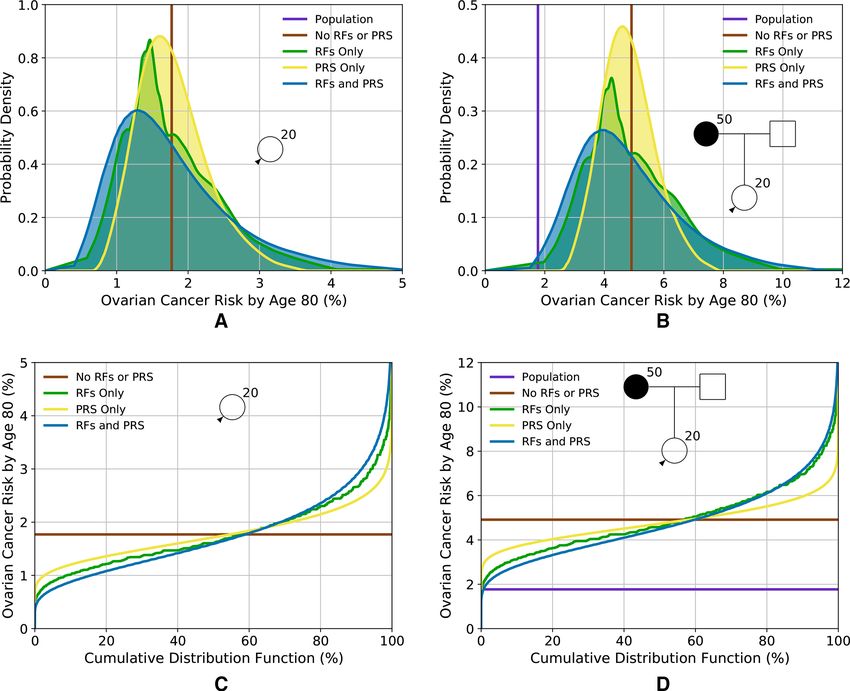
Cancer genetics
J Med Genet: first published as 10.1136/jmedgenet-2021-107904 on 29 November 2021. Downloaded from http://jmg.bmj.com/ on January 10, 2022 by guest. Protected by copyright.
Epidemiological RFs summary, the following self-reported information was collected
The RFs incorporated into the model include parity, use of oral at recruitment and used for model validation: parity, use of oral
contraception and MHT, endometriosis, tubal ligation, BMI and contraception and MHT, tubal ligation, BMI and height (online
height. We assumed that the RFs were categorical and that indi- supplemental table S4). As the study participants were genotyped
viduals’ categories were fixed for their lifetime, although the RRs for only 15 Single Nucleotide Polymorphisms (SNPs) known
were allowed to vary with age. The RR estimates used in equa- at the time to be associated with EOC risk, it was not possible
tion (1) and population distributions for each RF were obtained to use the more recently developed PRS for model validation.
from large-scale external studies and from national surveillance Instead, as the model can accommodate an arbitrary PRS, a PRS
data sources using a synthetic approach as previously described.30 based on the 15 available SNPs was used35 (online supplemental
Where possible, we used RR estimates that were adjusted for table S5), for which α2 = 0.037. The UKCTOCS study partici-
the other RFs included in the model and distributions from the pants were independent of the sets used to generate this PRS.35
UK. Details of the population distributions and RRs used in Study participants were not screened for PVs in BRCA1, BRCA2,
the model are given in online supplemental table S2. As in the RAD51C, RAD51D or BRIP1.
Breast and Ovarian Analysis of Disease Incidence and Carrier
Estimation Algorithm (BOADICEA),30 in order to decrease the Pedigree construction
runtime, we combined the RFs with age-independent RRs into The UKCTOCS recruitment questionnaire collected only
a single factor (specifically parity, tubal ligation, endometriosis, summary data on FH of BC and EOC. Since the risk algorithm
BMI and height). uses explicit FH information, these data were used to recon-
struct the pedigrees, which included information on incidences
Incorporating PRSs in the first-degree and second-degree relatives (online supple-
We included an EOC susceptibility PRS, assumed to form part mental methods).
of the polygene, using the methods previously developed.11 30
The polygenic component decomposes into a measured compo- Statistical analysis
nent due to the PRS (xPRS ) and an unmeasured component repre- All UKCTOCS participants were followed up using electronic
senting other familial effects (xR ): health record linkage to national cancer and death registries.
xP = xPRS + xR . (2) For this study, they were censored at either their age at EOC,
xPRS summarises the effects of multiple common variants and their age at other (non-EOC) first cancer diagnosis, their age at
is assumed normally distributed with mean 0 and variance α2 in death or age 79. To assess the model performance, a weighted
the general population, with 0 ≤ α ≤ 1. The parameter α2is the approach was used whereby each participant was assigned a
proportion of the overall polygenic variance (after excluding the sampling weight based on the inverse of the probability of being
effects of all MGs) explained by the PRS. xR is normally distrib- included in the nested case–control study, given their disease
uted with mean 0 and variance 1 − α2 . The approach used to status. Since all incident cancer cases were included, cases were
calculate α2is described in the online supplemental material. assigned a weight of 1. The cases were matched to two random
This implementation allows the effect size of the PRS to be controls (women with no EOC cancer) recruited at the same
dynamically varied, allowing an arbitrary PRS. regional centre, age at randomisation and year at recruitment.
Here, to illustrate the model’s risk- stratification potential, We assessed the model calibration and discrimination of the
we considered the latest validated EOC PRS developed by the predicted 5- year risks. Women older than 74 years at entry
Ovarian Cancer Association Consortium,34 which is composed were excluded. Cases that developed EOC beyond 5 years were
of 36 variants (online supplemental table S1) and has a log vari- treated as unaffected. For controls with a less than 5 years of
ance of 0.099, accounting for 5.0% of the overall polygenic vari- follow-up, we predicted the EOC risks to the age at censoring.
ance in the model. This 36-variant PRS was found to perform For all other controls and cases, we predicted 5-year risks.
equally well as those comprising more variants based on penal- To assess model calibration, we partitioned the weighted
ised regression or Bayesian approaches.34 sample into quintiles of predicted risk. Within each quintile, we
compared the weighted mean of predicted risk to the weighted
Other model components observed incidence using the Hosmer-Lemeshow (HL) χ2 test.36
The previous version11 modelled the incidence of EOC and first To assess RR calibration, the predicted and observed RRs were
female BC. To align with BOADICEA,30 the model was extended calculated relative to the corresponding means of risks over all
to take account of female contralateral BC and the associations quintiles. We also compared the expected (E) with the observed
of BRCA1/2 PVs with pancreatic cancer, male BC and prostate (O) EOC risk within the prediction interval by calculating the
cancer (online supplemental methods). ratio of expected to observed cases (E/O). The 95% CI for the
ratio was calculated assuming a Poisson distribution.37
Model validation We assessed the model discrimination between women who
Study subjects developed and did not develop EOC within 5 years using the
A partial model validation was carried out in a nested case– area under the receiver operating characteristic curve (AUC)
control sample of women of self-reported European ancestry (online supplemental methods).
participating in UKCTOCS. Based on the data available, we were
able to validate the model on the basis of FH, PRS and RFs. RESULTS
Details of the UKCTOCS study design, blood sampling process, Model description
DNA extraction and processing, variant selection, genotyping RAD51D, RAD51C and BRIP1, based on the assumed allele
and data processing are described in the online supplemental frequencies and RRs, account for 2.5% of the overall model
Methods and published elsewhere.35 Women with an FH of polygenic variance. Figure 1 shows the predicted EOC risks
two or more relatives with EOC or who were known carriers of for carriers of PVs in BRCA1, BRCA2, RAD51D, RAD51C
BRCA1/2 PVs were not eligible to participate in UKCTOCS. In and BRIP1 for various FH scenarios. With unknown FH, the
Lee A, et al. J Med Genet 2021;0:1–12. doi:10.1136/jmedgenet-2021-107904 3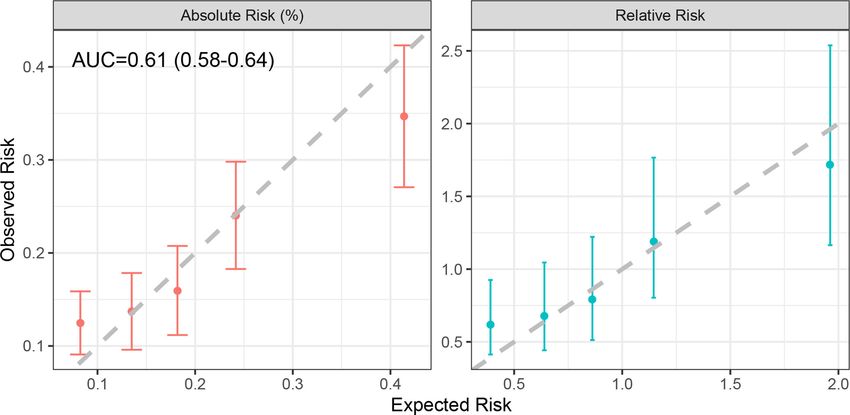
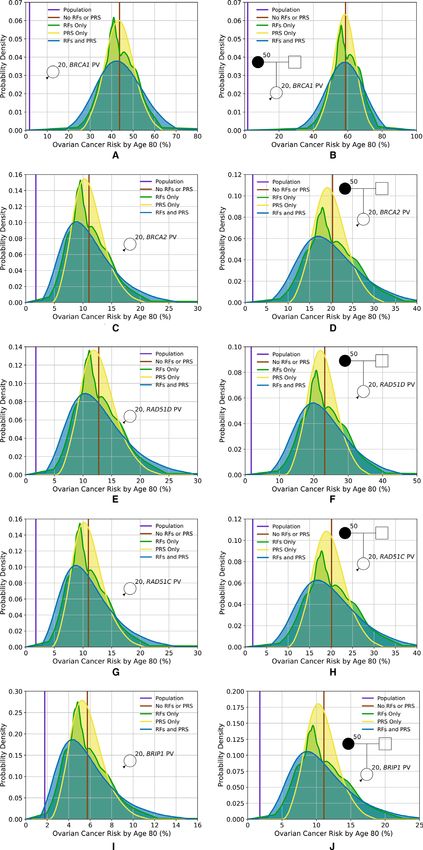
Cancer genetics Figure 1 Predicted lifetime (age 20–80 years) EOC risk by PV and family history. Each fgure shows the risks assuming the woman is untested, has no PVs J Med Genet: first published as 10.1136/jmedgenet-2021-107904 on 29 November 2021. Downloaded from http://jmg.bmj.com/ on January 10, 2022 by guest. Protected by copyright. or carries a PV in BRCA1, BRCA2, RAD51D, RAD51C or BRIP1. (A) Assuming an unknown family history. (B–E) Assuming an increasing number of affected first-degree relatives, as indicated by the pedigree diagram inserts. Predictions are based on UK EOC population incidence. EOC, epithelial tubo-ovarian cancer; PV, pathogenic variant. risks for carriers of PVs in RAD51D, RAD51C and BRIP1 are was most noticeable for women with a strong FH. Although a 13%, 11% and 6%, respectively. For example, for a BRIP1 PV risk reduction is also seen for women whose mother carried a carrier, the risk varies from 6% for a woman without EOC FH PV in BRCA2, RAD51D, RAD51C or BRIP1, the reduction is to 18% for a woman with two affected first-degree relatives. less marked. As expected, the predicted risks are still elevated The model can also be used to predict risks in families in which compared with the population. PVs are identified but where other family members test nega- Figure 2 and online supplemental figure S2 show distribu- tive (online supplemental figure S1). For women with an FH tions of lifetime risk and risk by age 50, respectively, for women of EOC, the reduction in EOC risk after negative predictive untested for PVs, based on RFs and PRS, for two FH scenarios: testing is greatest for BRCA1 PVs, with the risks being close to (1) unknown FH (ie, equivalent to a woman from the general (though still somewhat greater than) population risk. This effect population); and (2) having a mother diagnosed with EOC at 4 Lee A, et al. J Med Genet 2021;0:1–12. doi:10.1136/jmedgenet-2021-107904
Cancer genetics
J Med Genet: first published as 10.1136/jmedgenet-2021-107904 on 29 November 2021. Downloaded from http://jmg.bmj.com/ on January 10, 2022 by guest. Protected by copyright.
Figure 2 Predicted lifetime (age 20–80 years) EOC risk for a woman untested for PVs based on the different predictors of risk (RFs and PRS). (A,C) Risk
for a woman with an unknown family history (equivalent to the distribution of risk in the population); (B,D) risk for a woman with a mother affected at age
50. (A,B) Probability density function against absolute risk; (C,D) absolute risk against cumulative distribution. The vertical line (A) and the horizontal line (C)
(labelled ‘no RFs or PRS’) are equivalent to the population risk of EOC. The ‘population’ risk is shown separately in (B,D). Predictions are based on UK EOC
population incidences. EOC, epithelial tubo-ovarian cancer; PRS, Polygenic Risk Score; RF, risk factor.
age 50. Table 2 shows the corresponding proportion of women or greater. A BRIP1 PV carrier with an affected mother, on the
falling into different risk categories. The variation in risk is basis of FH alone, has a lifetime risk of 11%. However, when the
greatest when including both the RFs and PRS. When consid- RFs and PRS are considered, 50% of those would be reclassified
ered separately, the distribution is widest for the RFs. Using the as having lifetime risks of less than 10%.
RFs and PRS combined, predicted lifetime risks vary from 0.5% Online supplemental figures S4 and S5 show the probability
for the first percentile to 4.6% for the 99th for a woman with trees describing the reclassification of women as more informa-
unknown FH and from 1.9% to 10.3% for a woman with an tion (RFs, PRS and testing for PVs in the MGs) is added to the
affected mother. model for a woman with unknown FH and a woman with a
Figure 3 shows the predicted lifetime EOC risk for carriers of mother diagnosed at age 50, respectively, based on the predicted
PVs in BRCA1, BRCA2, RAD51D, RAD51C and BRIP1 based on lifetime risks. Online supplemental figures S4A and S5A show
RFs and PRS for two FH scenarios. Taking a RAD51D PV carrier, the reclassification resulting from adding RFs, MG and PRS
for example, based on PV testing and FH alone, the predicted sequentially, while online supplemental figures S4B and S5B
risks are 13% when FH is unknown and 23% when having a assume the order RFs, PRS and then MG. Assuming the three
mother diagnosed with EOC at age 50. When RFs and the PRS risk categories for lifetime risks areCancer genetics
J Med Genet: first published as 10.1136/jmedgenet-2021-107904 on 29 November 2021. Downloaded from http://jmg.bmj.com/ on January 10, 2022 by guest. Protected by copyright.
Table 2 Percentage of women falling in different risk categories by status of PV in one of the high-risk or intermediate-risk genes included in the
model and family history of cancer
Lifetime risk Risk to age 50
PV status Family history Risk categories RF PRS RF and PRS RF PRS RF and PRS Ref fig.
Untested NA Population 99.9 100.0 99.4 100.0 100.0 100.0 Figure 2A,C and online
Moderate 0.1 0.0 0.6 0.0 0.0 0.0 supplemental figure S2A,C
High 0.0 0.0 0.0 0.0 0.0 0.0
M 50 Population 59.1 61.8 61.7 100.0 100.0 100.0 Figure 2B,D and online
Moderate 40.3 38.2 37.1 0.0 0.0 0.0 supplemental figure S2B,D
High 0.6 0.0 1.2 0.0 0.0 0.0
BRCA1 NA Population 0.0 0.0 0.0 0.0 0.0 0.3 Figure 3A and online
Moderate 0.0 0.0 0.0 1.5 0.1 4.1 supplemental figure S3A
High 100.0 100.0 100.0 98.5 99.9 95.6
M 50 Population 0.0 0.0 0.0 0.0 0.0 0.0 Figure 3B and online
Moderate 0.0 0.0 0.0 0.0 0.0 0.2 supplemental figure S3B
High 100.0 100.0 100.0 100.0 100.0 99.8
BRCA2 NA Population 1.6 0.1 4.7 100.0 100.0 99.9 Figure 3C and online
Moderate 42.8 37.7 42.3 0.0 0.0 0.1 supplemental figure S3C
High 55.6 62.2 52.9 0.0 0.0 0.0
M 50 Population 0.0 0.0 0.1 95.9 99.9 95.3 Figure 3D and online
Moderate 1.9 0.1 4.7 4.0 0.1 4.5 supplemental figure S3D
High 98.1 99.9 95.3 0.0 0.0 0.2
RAD51D NA Population 0.6 0.0 2.1 100.0 100.0 99.8 Figure 3E and online
Moderate 24.5 18.3 30.8 0.0 0.0 0.2 supplemental figure S3E
High 75.0 81.7 67.1 0.0 0.0 0.0
M 50 Population 0.0 0.0 0.0 93.5 99.6 92.6 Figure 3F and online
Moderate 0.6 0.0 2.0 6.3 0.4 7.0 supplemental figure S3F
High 99.4 100.0 98.0 0.2 0.0 0.4
RAD51C NA Population 1.8 0.1 4.9 99.8 100.0 99.3 Figure 3G and online
Moderate 44.4 39.3 43.1 0.2 0.0 0.7 supplemental figure S3G
High 53.7 60.6 52.0 0.0 0.0 0.0
M 50 Population 0.0 0.0 0.1 85.8 96.2 85.0 Figure 3H and online
Moderate 2.0 0.1 5.0 13.6 3.8 13.7 supplemental figure S3H
High 98.0 99.9 95.0 0.6 0.0 1.3
BRIP1 NA Population 43.6 34.0 45.7 100.0 100.0 99.7 Figure 3I and online
Moderate 52.3 65.0 47.4 0.0 0.0 0.3 supplemental figure 3I
High 4.1 1.0 6.9 0.0 0.0 0.0
M 50 Population 2.1 0.1 4.8 93.0 99.3 91.4 Figure 3J and online
Moderate 43.5 38.9 44.5 6.8 0.7 8.1 supplemental figure 3J
High 54.5 61.1 50.7 0.3 0.0 0.5
The ‘population’ risk category is defined as lifetime risk ofCancer genetics
J Med Genet: first published as 10.1136/jmedgenet-2021-107904 on 29 November 2021. Downloaded from http://jmg.bmj.com/ on January 10, 2022 by guest. Protected by copyright.
Figure 3 Predicted lifetime EOC risk for a woman who has a PV in one of the high-risk or intermediate-risk genes included in the model, based on the
different predictors of risk (RFs and PRS), for two family histories. (A,B) Lifetime risk for a carrier of a PV in BRCA1; (C,D) lifetime risk for a carrier of a PV in
BRCA2; (E,F) lifetime risk for a carrier of a PV in RAD51D; (G,H) lifetime risk for a carrier of a PV in RAD51C; (I,J) lifetime risk for a carrier of a PV in BRIP1.
(A,C,E,G,I) Risks for an unknown family history; (B,D,F,H,J) risks for a woman whose mother is diagnosed with EOC at age 50. Predictions based on UK
ovarian cancer incidences. EOC, epithelial tubo-ovarian cancer; PRS, Polygenic Risk Score; PV, pathogenic variant; RF, risk factor.
Lee A, et al. J Med Genet 2021;0:1–12. doi:10.1136/jmedgenet-2021-107904 7Cancer genetics
J Med Genet: first published as 10.1136/jmedgenet-2021-107904 on 29 November 2021. Downloaded from http://jmg.bmj.com/ on January 10, 2022 by guest. Protected by copyright.
Figure 4 Calibration of the absolute and relative predicted 5-year EOC risks, showing the observed and expected risks by quintile. The bars show the 95%
CIs for the observed risks. Relative risks were calculated relative to the overall mean of observed and predicted risks. AUC, area under the receiver operating
characteristic curve.
provide a somewhat greater level of risk stratification than Other RFs for EOC that have been reported in the literature
the 36-variant PRS. However, discrimination is greater when include breast feeding42 and age at menarche and menopause.25
both are considered jointly. These results were in line with the However, the evidence for these RFs is still limited. Our model
observed risk distributions in the validation dataset, but direct is flexible enough to allow for additional RFs to be incorporated
comparisons were not possible due to the different variants in the future.
included in the PRSs and limited RFs in the validation study. We validated the 5-year predicted risks on the basis of FH, RFs
The results also show that significant levels of risk recategorisa- and PRS available in an independent dataset from a prospective
tion can occur for carriers of PVs in moderate-risk or high-risk trial.2 A key strength was that EOC was a primary outcome in
susceptibility genes. UKCTOCS. All cases were reviewed and confirmed by an inde-
The comprehensive risk model is based on a synthetic approach pendent outcome review committee.2 The results indicated that
previously used for BC30 and makes several assumptions. In absolute and RRs were well calibrated overall and in the top
particular, we assumed that the risks associated with known quintiles of predicted risk. However, there was some underpre-
RFs and the PRS combine multiplicatively. We have not assessed diction of EOC in the bottom quintile. This could be due to
this assumption in the present study; however, published studies differences in the RF distributions in those who volunteer to
found no evidence of deviations from the multiplicative model participate in research (self-selected more healthy individuals43)
for the combined effect of the RFs and the PRS,28 suggesting compared with the general population or due to random varia-
that this assumption is reasonable. The model assumes that the tions in the effects of the RFs in UKCTOCS compared with other
RFs are also independent of the residual polygenic component studies. Alternatively, the multiplicative assumption may break
that captures the effect of FH. However, for the RFs included, down in the lowest- risk category. Further, large prospective
we used estimates from published studies that have adjusted for cohorts will be required to determine whether the underpredic-
the other known EOC RFs. The observation that the model was tion in the lowest risk category reflects a systematic miscalibra-
calibrated on the RR scale in the UKCTOCS validation study tion of the model or is due to chance. Although the AUC based
also suggests that these assumptions are broadly valid. on model components in this validation study was modest; it is
Similarly, the model assumes that the relative effect-sizes of not surprising given that only a subset of the model predictors
RFs and the PRS are similar in women carrying PVs in BRCA1, were used, and UKCTOCS recruited primarily low-risk women.
BRCA2, RAD51C, RAD51D and BRIP1 to those without PVs in Inclusion of the optimal PRS,34 all RFs and information on PVs
these genes. Evidence from studies of BRCA1 and BRCA2 PV in the five genes that account for a large fraction of the EOC
carriers suggests that this assumption is plausible: PRSs for EOC FRR are expected to lead to an increase in AUC.
have been shown to be associated with similar RRs in the general The current validation study has some limitations. The under-
population and in BRCA1 and BRCA2 PV carriers.34 38 39 The lying model accounts for FH information on both affected and
current evidence also suggests that known RFs have similar effect unaffected family members, but the UKCTOCS recruitment
sizes in BRCA1 and BRCA2 PV carriers as in non-carriers.40 41 questionnaire did not include information on unaffected family
No studies have so far assessed the joint effects of RAD51C, members. Family sizes and ages for unobserved family members
RAD51D and BRIP1 PVs with the PRS, but the observation that were imputed using demographic data. In addition, since infor-
FH modifies EOC risk for RAD51C/D PV carriers29 suggests that mation on whether the affected family members were from the
similar arguments are likely to apply. Large prospective studies paternal or maternal side was absent, we assumed all the affected
are required to address these questions in more detail. We were family members were from the same (maternal) side. This may
not able to validate these assumptions explicitly in UKCTOCS result in inaccuracies in risk predictions. A further limitation is
because gene-panel testing data were not available. that UKCTOCS was undertaken to assess screening of low-risk
8 Lee A, et al. J Med Genet 2021;0:1–12. doi:10.1136/jmedgenet-2021-107904Cancer genetics
J Med Genet: first published as 10.1136/jmedgenet-2021-107904 on 29 November 2021. Downloaded from http://jmg.bmj.com/ on January 10, 2022 by guest. Protected by copyright.
women and therefore is not necessarily representative of a true (#13529) and the Canadian Institutes of Health Research (#155865), the Ministère
population cohort, as women with a FH of two or more relatives de l’Économie et de l’Innovation du Québec through Genome Québec, the Quebec
Breast Cancer Foundation, the CHU de Quebec Foundation and the Ontario Research
with EOC or who were known carriers of BRCA1/2 PVs were Fund. FMW is co-Director of the multi-institutional CanTest Collaborative, which is
not eligible to participate in the randomised controlled trial. funded by Cancer Research UK (C8640/A23385). MT was funded by the European
Data were not available on the rare moderate-risk and high-risk Union Seventh Framework Programme (2007–2013)/European Research Council
PVs, and we were only able to assess a PRS with 15 variants, (310018).
rather than the more informative 36-variant PRS. Therefore, it Competing interests DFE, ACA, APC, AL and TC are listed as creators of
has not been possible to validate the full model presented here. the BOADICEA model, which has been licensed to Cambridge Enterprise for
Future analyses in other cohorts will be required to further vali- commercialisation. UM has shares in Abcodia awarded to her by UCL.
date the full model. Patient consent for publication Not required.
In summary, we have presented a methodological framework Ethics approval The study was approved by local ethical review committees. UK
for a comprehensive EOC risk prediction model that considers Collaborative Trial of Ovarian Cancer Screening was approved by the UK North West
the currently known genetic and epidemiological RFs and Multicentre Research Ethics Committees (North West MREC 00/8/34) on 21 June
2000 with site-specific approval from the local regional ethics committees and the
explicit FH. The model allows users to obtain consistent, indi- Caldicott guardians (data controllers) of the primary care trusts. The SNP protocol
vidualised EOC risks. It can also be used to identify target popu- was approved by NRES Committee North West - Liverpool Central (14/NW1026) in
lations for studies to assess novel prevention strategies (such June 2014.
as salpingectomy) or early detection approaches by identifying Provenance and peer review Not commissioned; externally peer reviewed.
those at higher risk of developing the disease for enrolment into
Data availability statement The model is freely available online (www.canrisk.
such studies. Future independent studies should aim to validate org). For access to UK Collaborative Trial of Ovarian Cancer Screening (UKCTOCS)
the full model, including the full PRS and rare PVs in diverse dataset, which is subject to General Data Protection Regulations rules, please
settings. The model is available via the CanRisk Tool (www. contact the UKCTOCS Biobank coordinator (s.apostolidou@ucl.ac.uk). The data
canrisk.org), a user-friendly web tool that allows users to obtain access process is outlined online (http://uklwc.mrcctu.ucl.ac.uk/access-process/).
future risks of developing EOC. Supplemental material This content has been supplied by the author(s). It
has not been vetted by BMJ Publishing Group Limited (BMJ) and may not have
Author affiliations been peer-reviewed. Any opinions or recommendations discussed are solely those
1
Centre for Cancer Genetic Epidemiology, Department of Public Health and Primary of the author(s) and are not endorsed by BMJ. BMJ disclaims all liability and
Care, University of Cambridge, Cambridge, UK responsibility arising from any reliance placed on the content. Where the content
2
Centre for Cancer Genetic Epidemiology, Department of Oncology, University of includes any translated material, BMJ does not warrant the accuracy and reliability
Cambridge, Cambridge, UK of the translations (including but not limited to local regulations, clinical guidelines,
3
MRC Clinical Trials Unit, Institute of Clinical Trials & Methodology, University College terminology, drug names and drug dosages), and is not responsible for any error
London, London, UK and/or omissions arising from translation and adaptation or otherwise.
4
The Primary Care Unit, Department of Public Health and Primary Care, University of Open access This is an open access article distributed in accordance with the
Cambridge, Cambridge, UK Creative Commons Attribution 4.0 Unported (CC BY 4.0) license, which permits
5
Department of Women’s Cancer, University College London Institute for Women’s others to copy, redistribute, remix, transform and build upon this work for any
Health, London, UK purpose, provided the original work is properly cited, a link to the licence is given,
6
Department of Epidemiology and Public Health, University College London and indication of whether changes were made. See: https://creativecommons.org/
Research, London, UK licenses/by/4.0/.
7
CRUK Barts Cancer Centre, Wolfson Institute of Preventive Medicine, London, UK
8
Department of Gynaecological Oncology, Barts Health NHS Trust, London, UK ORCID iDs
9
Department of Health Services Research, London School of Hygiene & Tropical Andrew Lee http://orcid.org/0000-0003-0677-0252
Medicine, London, UK Xin Yang http://orcid.org/0000-0003-0037-3790
10
Center for Bioinformatics and Functional Genomics, Cedars-Sinai Medical Center Ranjit Manchanda http://orcid.org/0000-0003-3381-5057
Samuel Oschin Comprehensive Cancer Institute, Los Angeles, California, USA Susan J Ramus http://orcid.org/0000-0003-0005-7798
11
University of New South Wales, School of Women’s and Children’s Health, Paul Pharoah http://orcid.org/0000-0001-8494-732X
Randwick, New South Wales, Australia Antonis C Antoniou http://orcid.org/0000-0001-9223-3116
12
Adult Cancer Program, Lowy Cancer Research Centre, University of New South
Wales, Sydney, New South Wales, Australia
13
Department of Medical Genetics, NIHR Cambridge Biomedical Research Centre,
University of Cambridge, Cambridge, UK
REFERENCES
1 Cancer Research UK. Ovarian Cancer Statistics [Ovarian cancer statistics for the UK].
Available: https://www.cancerresearchuk.o rg/health-professional/cancer-statistics/
Twitter Ranjit Manchanda @ProfManchanda statistics-b y-cancer-type/ovarian-c ancer
Acknowledgements The authors are particularly grateful to those throughout the 2 Jacobs IJ, Menon U, Ryan A, Gentry-Maharaj A, Burnell M, Kalsi JK, Amso NN,
UK who are participating in the trial and to the centre leads and the entire medical, Apostolidou S, Benjamin E, Cruickshank D, Crump DN, Davies SK, Dawnay A, Dobbs
nursing and administrative staff who work on the UK Collaborative Trial of Ovarian S, Fletcher G, Ford J, Godfrey K, Gunu R, Habib M, Hallett R, Herod J, Jenkins H,
Cancer Screening. Karpinskyj C, Leeson S, Lewis SJ, Liston WR, Lopes A, Mould T, Murdoch J, Oram D,
Rabideau DJ, Reynolds K, Scott I, Seif MW, Sharma A, Singh N, Taylor J, Warburton F,
Contributors Conceptualisation: ACA, PPDP and DFE. Methodology: AL, XY, ACA, Widschwendter M, Williamson K, Woolas R, Fallowfield L, McGuire AJ, Campbell S,
DFE, PPDP and JT. Software: AL, XY, APC, TC and SA. Investigation: AL, XY, ACA, Parmar M, Skates SJ. Ovarian cancer screening and mortality in the UK Collaborative
PPDP, DFE, SAG, SJR, FG, RM, FWM and MT. Data curation: AGM, AR and GL. Formal trial of ovarian cancer screening (UKCTOCS): a randomised controlled trial. Lancet
analysis: AL, XY, JT and NM. Funding acquisition: ACA, IJ, UM and RM. Resources: 2016;387:945–56.
PPDP, AGM, AR, JT, SAG, SJR, IJ, UM and RM. Supervision: ACA. Visualisation: AL and 3 Rosenthal AN, Fraser LSM, Philpott S, Manchanda R, Burnell M, Badman P, Hadwin
XY. Writing, original draft: AL, XY and ACA. Writing, review and editing: all authors. R, Rizzuto I, Benjamin E, Singh N, Evans DG, Eccles DM, Ryan A, Liston R, Dawnay
Funding This work has been supported by grants from Cancer Research UK A, Ford J, Gunu R, Mackay J, Skates SJ, Menon U, Jacobs IJ, United Kingdom Familial
(C12292/A20861 and PPRPGM-Nov20\100002). The analysis is part of PROMISE, Ovarian Cancer Screening Study collaborators. Evidence of stage shift in women
which was funded through Cancer Research UK PRC Programme Grant A12677 diagnosed with ovarian cancer during phase II of the United Kingdom familial ovarian
and by The Eve Appeal. University College London investigators received support cancer screening study. J Clin Oncol 2017;35:1411–20.
from the National Institute for Health Research University College London Hospitals 4 Ludwig KK, Neuner J, Butler A, Geurts JL, Kong AL. Risk reduction and survival benefit
Biomedical Research Centre and from MRC core funding (MR_UU_12023). KCTOCS of prophylactic surgery in BRCA mutation carriers, a systematic review. Am J Surg
was core funded by the Medical Research Council (G9901012 and G0801228), 2016;212:660–9.
Cancer Research UK (C1479/A2884) and the Department of Health with additional 5 Manchanda R, Legood R, Antoniou AC, Gordeev VS, Menon U. Specifying the ovarian
support from the Eve Appeal. The work received support through the PERSPECTIVE cancer risk threshold of ’premenopausal risk-reducing salpingo-oophorectomy’ for
I&I project which is funded by the Government of Canada through Genome Canada ovarian cancer prevention: a cost-effectiveness analysis. J Med Genet 2016;53:591–9.
Lee A, et al. J Med Genet 2021;0:1–12. doi:10.1136/jmedgenet-2021-107904 9Cancer genetics
J Med Genet: first published as 10.1136/jmedgenet-2021-107904 on 29 November 2021. Downloaded from http://jmg.bmj.com/ on January 10, 2022 by guest. Protected by copyright.
6 Manchanda R, Legood R, Pearce L, Menon U. Defining the risk threshold for D, Winship IM, Macrae F, Möslein G, Mecklin J-P, Nielsen M, Møller P. Cancer risks
risk reducing salpingo-oophorectomy for ovarian cancer prevention in low risk by gene, age, and gender in 6350 carriers of pathogenic mismatch repair variants:
postmenopausal women. Gynecol Oncol 2015;139:487–94. findings from the prospective Lynch syndrome database. Genet Med 2020;22:15–25.
7 Parker WH, Feskanich D, Broder MS, Chang E, Shoupe D, Farquhar CM, Berek JS, 19 Kuchenbaecker KB, Ramus SJ, Tyrer J, Lee A, Shen HC, Beesley J, Lawrenson K,
Manson JE. Long-term mortality associated with oophorectomy compared with McGuffog L, Healey S, Lee JM, Spindler TJ, Lin YG, Pejovic T, Bean Y, Li Q, Coetzee
ovarian conservation in the nurses’ health study. Obstet Gynecol 2013;121:709–16. S, Hazelett D, Miron A, Southey M, Terry MB, Goldgar DE, Buys SS, Janavicius R,
8 Rocca WA, Gazzuola-Rocca L, Smith CY, Grossardt BR, Faubion SS, Shuster LT, Kirkland Dorfling CM, van Rensburg EJ, Neuhausen SL, Ding YC, Hansen TVO, Jønson L, Gerdes
JL, Stewart EA, Miller VM. Accelerated accumulation of multimorbidity after bilateral A-M, Ejlertsen B, Barrowdale D, Dennis J, Benitez J, Osorio A, Garcia MJ, Komenaka
oophorectomy: a population-based cohort study. Mayo Clin Proc 2016;91:1577–89. I, Weitzel JN, Ganschow P, Peterlongo P, Bernard L, Viel A, Bonanni B, Peissel B,
9 Parker WH, Jacoby V, Shoupe D, Rocca W. Effect of bilateral oophorectomy on women’s Manoukian S, Radice P, Papi L, Ottini L, Fostira F, Konstantopoulou I, Garber J, Frost
long-t erm health. Womens Health 2009;5:565–76. D, Perkins J, Platte R, Ellis S, Godwin AK, Schmutzler RK, Meindl A, Engel C, Sutter C,
10 Gaba F, Manchanda R. Systematic review of acceptability, cardiovascular, neurological, Sinilnikova OM, Damiola F, Mazoyer S, Stoppa-Lyonnet D, Claes K, De Leeneer K, Kirk
bone health and HRT outcomes following risk reducing surgery in BRCA carriers. Best J, Rodriguez GC, Piedmonte M, O’Malley DM, de la Hoya M, Caldes T, Aittomäki K,
Pract Res Clin Obstet Gynaecol 2020;65:46–65. Nevanlinna H, Collée JM, Rookus MA, Oosterwijk JC, Tihomirova L, Tung N, Hamann
11 Jervis S, Song H, Lee A, Dicks E, Harrington P, Baynes C, Manchanda R, Easton DF, U, Isaccs C, Tischkowitz M, Imyanitov EN, Caligo MA, Campbell IG, Hogervorst FBL,
Jacobs I, Pharoah PPD, Antoniou AC. A risk prediction algorithm for ovarian cancer Olah E, Diez O, Blanco I, Brunet J, Lazaro C, Pujana MA, Jakubowska A, Gronwald
incorporating BRCA1, BRCA2, common alleles and other familial effects. J Med Genet J, Lubinski J, Sukiennicki G, Barkardottir RB, Plante M, Simard J, Soucy P, Montagna
2015;52:465–75. M, Tognazzo S, Teixeira MR, Pankratz VS, Wang X, Lindor N, Szabo CI, Kauff N, Vijai
12 Loveday C, Turnbull C, Ramsay E, Hughes D, Ruark E, Frankum JR, Bowden G, J, Aghajanian CA, Pfeiler G, Berger A, Singer CF, Tea M-K, Phelan CM, Greene MH,
Kalmyrzaev B, Warren-Perry M, Snape K, Adlard JW, Barwell J, Berg J, Brady AF, Brewer Mai PL, Rennert G, Mulligan AM, Tchatchou S, Andrulis IL, Glendon G, Toland AE,
C, Brice G, Chapman C, Cook J, Davidson R, Donaldson A, Douglas F, Greenhalgh Jensen UB, Kruse TA, Thomassen M, Bojesen A, Zidan J, Friedman E, Laitman Y, Soller
L, Henderson A, Izatt L, Kumar A, Lalloo F, Miedzybrodzka Z, Morrison PJ, Paterson M, Liljegren A, Arver B, Einbeigi Z, Stenmark-Askmalm M, Olopade OI, Nussbaum
J, Porteous M, Rogers MT, Shanley S, Walker L, Eccles D, Evans DG, Renwick A, RL, Rebbeck TR, Nathanson KL, Domchek SM, Lu KH, Karlan BY, Walsh C, Lester J,
Seal S, Lord CJ, Ashworth A, Reis-Filho JS, Antoniou AC, Rahman N, Breast Cancer Hein A, Ekici AB, Beckmann MW, Fasching PA, Lambrechts D, Van Nieuwenhuysen E,
Susceptibility Collaboration (UK). Germline mutations in RAD51D confer susceptibility Vergote I, Lambrechts S, Dicks E, Doherty JA, Wicklund KG, Rossing MA, Rudolph A,
to ovarian cancer. Nat Genet 2011;43:879–82. Chang-Claude J, Wang-Gohrke S, Eilber U, Moysich KB, Odunsi K, Sucheston L, Lele
13 Loveday C, Turnbull C, Ruark E, Xicola RMM, Ramsay E, Hughes D, Warren-Perry M, S, Wilkens LR, Goodman MT, Thompson PJ, Shvetsov YB, Runnebaum IB, Dürst M,
Snape K, Eccles D, Evans DG, Gore M, Renwick A, Seal S, Antoniou AC, Rahman N, Hillemanns P, Dörk T, Antonenkova N, Bogdanova N, Leminen A, Pelttari LM, Butzow
Breast Cancer Susceptibility Collaboration (UK). Germline RAD51C mutations confer R, Modugno F, Kelley JL, Edwards RP, Ness RB, du Bois A, Heitz F, Schwaab I, Harter P,
susceptibility to ovarian cancer. Nat Genet 2012;44:475–6. author reply 6. Matsuo K, Hosono S, Orsulic S, Jensen A, Kjaer SK, Hogdall E, Hasmad HN, Azmi MAN,
14 Ramus SJ, Song H, Dicks E, Tyrer JP, Rosenthal AN, Intermaggio MP, Fraser L, Gentry- Teo S-H, Woo Y-L, Fridley BL, Goode EL, Cunningham JM, Vierkant RA, Bruinsma F,
Maharaj A, Hayward J, Philpott S, Anderson C, Edlund CK, Conti D, Harrington P, Giles GG, Liang D, Hildebrandt MAT, Wu X, Levine DA, Bisogna M, Berchuck A, Iversen
Barrowdale D, Bowtell DD, Alsop K, Mitchell G, Cicek MS, Cunningham JM, Fridley BL, ES, Schildkraut JM, Concannon P, Weber RP, Cramer DW, Terry KL, Poole EM, Tworoger
Alsop J, Jimenez-Linan M, Poblete S, Lele S, Sucheston-Campbell L, Moysich KB, Sieh SS, Bandera EV, Orlow I, Olson SH, Krakstad C, Salvesen HB, Tangen IL, Bjorge L, van
W, McGuire V, Lester J, Bogdanova N, Dürst M, Hillemanns P, Odunsi K, Whittemore Altena AM, Aben KKH, Kiemeney LA, Massuger LFAG, Kellar M, Brooks-Wilson A,
AS, Karlan BY, Dörk T, Goode EL, Menon U, Jacobs IJ, Antoniou AC, Pharoah PDP, Kelemen LE, Cook LS, Le ND, Cybulski C, Yang H, Lissowska J, Brinton LA, Wentzensen
Gayther SA, AOCS Study Group, Ovarian Cancer Association Consortium. Germline N, Hogdall C, Lundvall L, Nedergaard L, Baker H, Song H, Eccles D, McNeish I, Paul
mutations in the BRIP1, BARD1, PALB2, and NBN genes in women with ovarian J, Carty K, Siddiqui N, Glasspool R, Whittemore AS, Rothstein JH, McGuire V, Sieh
cancer. J Natl Cancer Inst 2015;107. doi:10.1093/jnci/djv214. [Epub ahead of print: W, Ji B-T, Zheng W, Shu X-O, Gao Y-T, Rosen B, Risch HA, McLaughlin JR, Narod SA,
27 08 2015]. Monteiro AN, Chen A, Lin H-Y, Permuth-Wey J, Sellers TA, Tsai Y-Y, Chen Z, Ziogas
15 Yang X, Leslie G, Doroszuk A, Schneider S, Allen J, Decker B, Dunning AM, Redman J, A, Anton-Culver H, Gentry-Maharaj A, Menon U, Harrington P, Lee AW, Wu AH,
Scarth J, Plaskocinska I, Luccarini C, Shah M, Pooley K, Dorling L, Lee A, Adank MA, Pearce CL, Coetzee G, Pike MC, Dansonka-Mieszkowska A, Timorek A, Rzepecka IK,
Adlard J, Aittomäki K, Andrulis IL, Ang P, Barwell J, Bernstein JL, Bobolis K, Borg Åke, Kupryjanczyk J, Freedman M, Noushmehr H, Easton DF, Offit K, Couch FJ, Gayther S,
Blomqvist C, Claes KBM, Concannon P, Cuggia A, Culver JO, Damiola F, de Pauw A, Pharoah PP, Antoniou AC, Chenevix-Trench G, KH L, ND L, B-T J, AH W, Easton DF,
Diez O, Dolinsky JS, Domchek SM, Engel C, Evans DG, Fostira F, Garber J, Golmard L, Offit K, Couch FJ, Gayther S, Pharoah PP, Antoniou AC, Chenevix-Trench G, tCoIoMoB
Goode EL, Gruber SB, Hahnen E, Hake C, Heikkinen T, Hurley JE, Janavicius R, Kleibl B, EMBRACE, GEMO Study Collaborators, Breast Cancer Family Registry, HEBON,
Z, Kleiblova P, Konstantopoulou I, Kvist A, Laduca H, Lee ASG, Lesueur F, Maher ER, KConFab Investigators, Australian Cancer Study (Ovarian Cancer Investigators),
Mannermaa A, Manoukian S, McFarland R, McKinnon W, Meindl A, Metcalfe K, Mohd Australian Ovarian Cancer Study Group, Consortium of Investigators of Modifiers of
Taib NA, Moilanen J, Nathanson KL, Neuhausen S, Ng PS, Nguyen-Dumont T, Nielsen BRCA1 and BRCA2. Identification of six new susceptibility loci for invasive epithelial
SM, Obermair F, Offit K, Olopade OI, Ottini L, Penkert J, Pylkäs K, Radice P, Ramus SJ, ovarian cancer. Nat Genet 2015;47:164–71.
Rudaitis V, Side L, Silva-Smith R, Silvestri V, Skytte A-B, Slavin T, Soukupova J, Tondini C, 20 Phelan CM, Kuchenbaecker KB, Tyrer JP, Kar SP, Lawrenson K, Winham SJ, Dennis
Trainer AH, Unzeitig G, Usha L, van Overeem Hansen T, Whitworth J, Wood M, Yip CH, J, Pirie A, Riggan MJ, Chornokur G, Earp MA, Lyra PC, Lee JM, Coetzee S, Beesley
Yoon S-Y, Yussuf A, Zogopoulos G, Goldgar D, Hopper JL, Chenevix-Trench G, Pharoah J, McGuffog L, Soucy P, Dicks E, Lee A, Barrowdale D, Lecarpentier J, Leslie G, Aalfs
P, George SHL, Balmaña J, Houdayer C, James P, El-Haffaf Z, Ehrencrona H, Janatova CM, Aben KKH, Adams M, Adlard J, Andrulis IL, Anton-Culver H, Antonenkova N,
M, Peterlongo P, Nevanlinna H, Schmutzler R, Teo S-H, Robson M, Pal T, Couch F, Aravantinos G, Arnold N, Arun BK, Arver B, Azzollini J, Balmaña J, Banerjee SN,
Weitzel JN, Elliott A, Southey M, Winqvist R, Easton DF, Foulkes WD, Antoniou AC, Barjhoux L, Barkardottir RB, Bean Y, Beckmann MW, Beeghly-Fadiel A, Benitez J,
Tischkowitz M. Cancer Risks Associated With Germline PALB2 Pathogenic Variants: An Bermisheva M, Bernardini MQ, Birrer MJ, Bjorge L, Black A, Blankstein K, Blok MJ,
International Study of 524 Families. J Clin Oncol 2020;38:674–85. Bodelon C, Bogdanova N, Bojesen A, Bonanni B, Borg Åke, Bradbury AR, Brenton JD,
16 Lilyquist J, LaDuca H, Polley E, Davis BT, Shimelis H, Hu C, Hart SN, Dolinsky JS, Couch Brewer C, Brinton L, Broberg P, Brooks-Wilson A, Bruinsma F, Brunet J, Buecher B,
FJ, Goldgar DE. Frequency of mutations in a large series of clinically ascertained Butzow R, Buys SS, Caldes T, Caligo MA, Campbell I, Cannioto R, Carney ME, Cescon
ovarian cancer cases tested on multi-gene panels compared to reference controls. T, Chan SB, Chang-Claude J, Chanock S, Chen XQ, Chiew Y-E, Chiquette J, Chung WK,
Gynecol Oncol 2017;147:375–80. Claes KBM, Conner T, Cook LS, Cook J, Cramer DW, Cunningham JM, D’Aloisio AA,
17 Pal T, Akbari MR, Sun P, Lee J-H, Fulp J, Thompson Z, Coppola D, Nicosia S, Sellers Daly MB, Damiola F, Damirovna SD, Dansonka-Mieszkowska A, Dao F, Davidson R,
TA, McLaughlin J, Risch HA, Rosen B, Shaw P, Schildkraut J, Narod SA. Frequency of DeFazio A, Delnatte C, Doheny KF, Diez O, Ding YC, Doherty JA, Domchek SM, Dorfling
mutations in mismatch repair genes in a population-based study of women with CM, Dörk T, Dossus L, Duran M, Dürst M, Dworniczak B, Eccles D, Edwards T, Eeles R,
ovarian cancer. Br J Cancer 2012;107:1783–90. Eilber U, Ejlertsen B, Ekici AB, Ellis S, Elvira M, Eng KH, Engel C, Evans DG, Fasching
18 Dominguez-Valentin M, Sampson JR, Seppälä TT, Ten Broeke SW, Plazzer J-P, Nakken PA, Ferguson S, Ferrer SF, Flanagan JM, Fogarty ZC, Fortner RT, Fostira F, Foulkes WD,
S, Engel C, Aretz S, Jenkins MA, Sunde L, Bernstein I, Capella G, Balaguer F, Thomas H, Fountzilas G, Fridley BL, Friebel TM, Friedman E, Frost D, Ganz PA, Garber J, García MJ,
Evans DG, Burn J, Greenblatt M, Hovig E, de Vos Tot Nederveen Cappel WH, Sijmons Garcia-Barberan V, Gehrig A, Gentry-Maharaj A, Gerdes A-M, Giles GG, Glasspool R,
RH, Bertario L, Tibiletti MG, Cavestro GM, Lindblom A, Della Valle A, Lopez-Köstner Glendon G, Godwin AK, Goldgar DE, Goranova T, Gore M, Greene MH, Gronwald J,
F, Gluck N, Katz LH, Heinimann K, Vaccaro CA, Büttner R, Görgens H, Holinski-Feder Gruber S, Hahnen E, Haiman CA, Håkansson N, Hamann U, Hansen TVO, Harrington
E, Morak M, Holzapfel S, Hüneburg R, Knebel Doeberitz Mvon, Loeffler M, Rahner N, PA, Harris HR, Hauke J, Hein A, Henderson A, Hildebrandt MAT, Hillemanns P, Hodgson
Schackert HK, Steinke-Lange V, Schmiegel W, Vangala D, Pylvänäinen K, Renkonen- S, Høgdall CK, Høgdall E, Hogervorst FBL, Holland H, Hooning MJ, Hosking K, Huang
Sinisalo L, Hopper JL, Win AK, Haile RW, Lindor NM, Gallinger S, Le Marchand L, R-Y, Hulick PJ, Hung J, Hunter DJ, Huntsman DG, Huzarski T, Imyanitov EN, Isaacs
Newcomb PA, Figueiredo JC, Thibodeau SN, Wadt K, Therkildsen C, Okkels H, Ketabi Z, C, Iversen ES, Izatt L, Izquierdo A, Jakubowska A, James P, Janavicius R, Jernetz M,
Moreira L, Sánchez A, Serra-Burriel M, Pineda M, Navarro M, Blanco I, Green K, Lalloo Jensen A, Jensen UB, John EM, Johnatty S, Jones ME, Kannisto P, Karlan BY, Karnezis
F, Crosbie EJ, Hill J, Denton OG, Frayling IM, Rødland EA, Vasen H, Mints M, Neffa F, A, Kast K, Kennedy CJ, Khusnutdinova E, Kiemeney LA, Kiiski JI, Kim S-W, Kjaer SK,
Esperon P, Alvarez K, Kariv R, Rosner G, Pinero TA, Gonzalez ML, Kalfayan P, Tjandra Köbel M, Kopperud RK, Kruse TA, Kupryjanczyk J, Kwong A, Laitman Y, Lambrechts D,
10 Lee A, et al. J Med Genet 2021;0:1–12. doi:10.1136/jmedgenet-2021-107904Cancer genetics
J Med Genet: first published as 10.1136/jmedgenet-2021-107904 on 29 November 2021. Downloaded from http://jmg.bmj.com/ on January 10, 2022 by guest. Protected by copyright.
Larrañaga N, Larson MC, Lazaro C, Le ND, Le Marchand L, Lee JW, Lele SB, Leminen 29 Yang X, Song H, Leslie G, Engel C, Hahnen E, Auber B, Horváth J, Kast K, Niederacher
A, Leroux D, Lester J, Lesueur F, Levine DA, Liang D, Liebrich C, Lilyquist J, Lipworth D, Turnbull C, Houlston R, Hanson H, Loveday C, Dolinsky JS, LaDuca H, Ramus SJ,
L, Lissowska J, Lu KH, Lubinński J, Luccarini C, Lundvall L, Mai PL, Mendoza-Fandiño Menon U, Rosenthal AN, Jacobs I, Gayther SA, Dicks E, Nevanlinna H, Aittomäki K,
G, Manoukian S, Massuger LFAG, May T, Mazoyer S, McAlpine JN, McGuire V, Pelttari LM, Ehrencrona H, Borg Åke, Kvist A, Rivera B, Hansen TVO, Djursby M, Lee
McLaughlin JR, McNeish I, Meijers-Heijboer H, Meindl A, Menon U, Mensenkamp A, Dennis J, Bowtell DD, Traficante N, Diez O, Balmaña J, Gruber SB, Chenevix-Trench
AR, Merritt MA, Milne RL, Mitchell G, Modugno F, Moes-Sosnowska J, Moffitt M, G, Jensen A, Kjær SK, Høgdall E, Castéra L, Garber J, Janavicius R, Osorio A, Golmard
Montagna M, Moysich KB, Mulligan AM, Musinsky J, Nathanson KL, Nedergaard L, L, Vega A, Couch FJ, Robson M, Gronwald J, Domchek SM, Culver JO, de la Hoya
Ness RB, Neuhausen SL, Nevanlinna H, Niederacher D, Nussbaum RL, Odunsi K, Olah M, Easton DF, Foulkes WD, Tischkowitz M, Meindl A, Schmutzler RK, Pharoah PDP,
E, Olopade OI, Olsson H, Olswold C, O’Malley DM, Ong K-R, Onland-Moret NC, Orr Antoniou AC, kConFab Investigators. Ovarian and breast cancer risks associated with
N, Orsulic S, Osorio A, Palli D, Papi L, Park-Simon T-W, Paul J, Pearce CL, Pedersen pathogenic variants in RAD51C and RAD51D. J Natl Cancer Inst 2020;112:1242–50.
IS, Peeters PHM, Peissel B, Peixoto A, Pejovic T, Pelttari LM, Permuth JB, Peterlongo 30 Lee A, Mavaddat N, Wilcox AN, Cunningham AP, Carver T, Hartley S, Babb de Villiers
P, Pezzani L, Pfeiler G, Phillips K-A, Piedmonte M, Pike MC, Piskorz AM, Poblete SR, C, Izquierdo A, Simard J, Schmidt MK, Walter FM, Chatterjee N, Garcia-Closas M,
Pocza T, Poole EM, Poppe B, Porteous ME, Prieur F, Prokofyeva D, Pugh E, Pujana Tischkowitz M, Pharoah P, Easton DF, Antoniou AC. Boadicea: a comprehensive breast
MA, Pujol P, Radice P, Rantala J, Rappaport-Fuerhauser C, Rennert G, Rhiem K, Rice cancer risk prediction model incorporating genetic and nongenetic risk factors. Genet
P, Richardson A, Robson M, Rodriguez GC, Rodríguez-Antona C, Romm J, Rookus Med 2019;21:1708–18.
MA, Rossing MA, Rothstein JH, Rudolph A, Runnebaum IB, Salvesen HB, Sandler 31 Pal Choudhury P, Maas P, Wilcox A, Wheeler W, Brook M, Check D, Garcia-Closas M,
DP, Schoemaker MJ, Senter L, Setiawan VW, Severi G, Sharma P, Shelford T, Siddiqui Chatterjee N. iCARE: an R package to build, validate and apply absolute risk models.
N, Side LE, Sieh W, Singer CF, Sobol H, Song H, Southey MC, Spurdle AB, Stadler Z, PLoS One 2020;15:e0228198.
Steinemann D, Stoppa-Lyonnet D, Sucheston-Campbell LE, Sukiennicki G, Sutphen 32 Pal Choudhury P, Brook MN, Hurson AN, Lee A, Mulder CV, Coulson P, Schoemaker MJ,
R, Sutter C, Swerdlow AJ, Szabo CI, Szafron L, Tan YY, Taylor JA, Tea M-K, Teixeira Jones ME, Swerdlow AJ, Chatterjee N, Antoniou AC, Garcia-Closas M. Comparative
MR, Teo S-H, Terry KL, Thompson PJ, Thomsen LCV, Thull DL, Tihomirova L, Tinker AV, validation of the BOADICEA and Tyrer-Cuzick breast cancer risk models incorporating
Tischkowitz M, Tognazzo S, Toland AE, Tone A, Trabert B, Travis RC, Trichopoulou A, classical risk factors and polygenic risk in a population-based prospective cohort of
Tung N, Tworoger SS, van Altena AM, Van Den Berg D, van der Hout AH, van der women of European ancestry. Breast Cancer Res 2021;23.
Luijt RB, Van Heetvelde M, Van Nieuwenhuysen E, van Rensburg EJ, Vanderstichele 33 Lee AJ, Cunningham AP, Tischkowitz M, Simard J, Pharoah PD, Easton DF, Antoniou
A, Varon-Mateeva R, Vega A, Edwards DV, Vergote I, Vierkant RA, Vijai J, Vratimos A, AC. Incorporating truncating variants in PALB2, CHEK2, and ATM into the BOADICEA
Walker L, Walsh C, Wand D, Wang-Gohrke S, Wappenschmidt B, Webb PM, Weinberg breast cancer risk model. Genet Med 2016;18:1190–8.
CR, Weitzel JN, Wentzensen N, Whittemore AS, Wijnen JT, Wilkens LR, Wolk A, Woo 34 Dareng EO, Tyrer J, Barnes DR, Jones MR, Yang X, Aben KKH, Adank MA, Agata SA,
M, Wu X, Wu AH, Yang H, Yannoukakos D, Ziogas A, Zorn KK, Narod SA, Easton DF, Andrulis IL, Anton-Culver H, Antonenkova NN, Aravantinos G, Arun BK, Augustinsson
Amos CI, Schildkraut JM, Ramus SJ, Ottini L, Goodman MT, Park SK, Kelemen LE, A, Balmaña J, Bandera EV, Barkardottir RB, Barrowdale D, Beckmann MW, Beeghly-
Risch HA, Thomassen M, Offit K, Simard J, Schmutzler RK, Hazelett D, Monteiro AN, Fadiel A, Benitez J, Bermisheva M, Bernardini MQ, Bjorge L, Black A, Bogdanova
Couch FJ, Berchuck A, Chenevix-Trench G, Goode EL, Sellers TA, Gayther SA, Antoniou NV, Bonanni B, Borg A, Brenton J, Budzilowska A, Butzow R, Buys SS, Cai H, Caligo
AC, Pharoah PDP, AOCS study group, EMBRACE Study, GEMO Study Collaborators, MA, Campbell I, Cannioto R, Cassingham H, Chang-Claude J, Chanock SJ, Chen K,
HEBON Study, KConFab Investigators, OPAL study group. Identification of 12 new Chiew Y-E, Chung WK, Claes KBM, Colanna S, Cook LS, Couch FJ, Daly MB, Dao F,
susceptibility loci for different histotypes of epithelial ovarian cancer. Nat Genet Davies E, de la Hoya M, de Putter R, DePersia A, Devilee P, Diez O, Ding YC, Doherty
2017;49:680–691. JA, Domchek SM, Dörk T, du Bois A, Dürst M, Eccles DM, Eliassen HA, Engel C, Evans
21 Collaborative Group on Epidemiological Studies of Ovarian Cancer. Ovarian cancer DG, Fasching P, Flanagan JM, Foretova L, Fortner RT, Friedman E, Ganz PA, Garber J,
and body size: individual participant meta-analysis including 25,157 women with Gensini F, Giles GG, Glendon G, Godwin AK, Goodman MT, Greene MH, Gronwald J,
ovarian cancer from 47 epidemiological studies. PLoS Med 2012;9:e1001200. Hahnen E, Haiman CA, Håkansson N, Hamann U, Hansen TVO, Harris HR, Hartman M,
22 Collaborative Group On Epidemiological Studies Of Ovarian Cancer, Beral V, Gaitskell Heitz F, Hildebrandt MAT, Høgdall E, Høgdall CK, Hopper JL, Huang R-Y, Huff C, Hulick
K, Hermon C, Moser K, Reeves G, Peto R. Menopausal hormone use and ovarian PJ, Huntsman DG, Imyanitov EN, Isaacs C, Anna Jakubowska A, James P, Janavicius R,
cancer risk: individual participant meta-analysis of 52 epidemiological studies. Lancet Jensen A, Johannsson OT, John EM, Jones M, Kang D, Karlan BY, Karnezis A, Kelemen
2015;385:1835–42. LE, Khusnutdinova E, Kiemeney LA, Kim B-G, Kjaer SK, Komenaka I, Kupryjanczyk
23 Li K, Hüsing A, Fortner RT, Tjønneland A, Hansen L, Dossus L, Chang-Claude J, J, Kurian AW, Kwong A, Lambrechts D, Larson MC, Lazaro C, ND L, Leslie G, Lester
Bergmann M, Steffen A, Bamia C, Trichopoulos D, Trichopoulou A, Palli D, Mattiello J, Lesueur F, Levine D, Li L, Li J, Loud JT, KH L, Lubiński J, Machackova E, Mai PL,
A, Agnoli C, Tumino R, Onland-Moret NC, Peeters PH, Bueno-de-Mesquita HB, Gram Manoukian S, Marks J, Kim Matsuno R, Matsuo K, May T, McGuffog L, McLaughlin
IT, Weiderpass E, Sánchez-Cantalejo E, Chirlaque M-D, Duell EJ, Ardanaz E, Idahl JR, McNeish IA, Mebirouk N, Menon U, Miller A, Milne RL, Minlikeeva A, Modugno
A, Lundin E, Khaw K-T, Travis RC, Merritt MA, Gunter MJ, Riboli E, Ferrari P, Terry K, F, Montagna M, Moysich KB, Munro E, Nathanson KL, Neuhausen SL, Nevanlinna
Cramer D, Kaaks R. An epidemiologic risk prediction model for ovarian cancer in H. Polygenic risk modelling for prediction of epithelial ovarian cancer risk. MedRxiv
Europe: the EPIC study. Br J Cancer 2015;112:1257–65. 2020.
24 Pearce CL, Stram DO, Ness RB, Stram DA, Roman LD, Templeman C, Lee AW, Menon 35 Yang X, Leslie G, Gentry-Maharaj A, Ryan A, Intermaggio M, Lee A, Kalsi JK, Tyrer
U, Fasching PA, McAlpine JN, Doherty JA, Modugno F, Schildkraut JM, Rossing MA, J, Gaba F, Manchanda R, Pharoah PDP, Gayther SA, Ramus SJ, Jacobs I, Menon U,
Huntsman DG, Wu AH, Berchuck A, Pike MC, Pharoah PDP, Huntsman DG, AH W. Antoniou AC. Evaluation of polygenic risk scores for ovarian cancer risk prediction in a
Population distribution of lifetime risk of ovarian cancer in the United States. Cancer prospective cohort study. J Med Genet 2018;55:546–54.
Epidemiol Biomarkers Prev 2015;24:671–6. 36 Whittemore AS, Halpern J. Two-stage sampling designs for external validation of
25 Rosner BA, Colditz GA, Webb PM, Hankinson SE. Mathematical models of ovarian personal risk models. Stat Methods Med Res 2016;25:1313–29.
cancer incidence. Epidemiology 2005;16:508–15. 37 Terry MB, Liao Y, Whittemore AS, Leoce N, Buchsbaum R, Zeinomar N, Dite GS,
26 Gaitskell K, Coffey K, Green J, Pirie K, Reeves GK, Ahmed AA, Barnes I, Beral V, Abbiss Chung WK, Knight JA, Southey MC, Milne RL, Goldgar D, Giles GG, McLachlan S-A,
H, Abbott S, Alison R, Allen N, Armstrong M, Baker K, Balkwill A, Banks E, Barnes I, Friedlander ML, Weideman PC, Glendon G, Nesci S, Andrulis IL, John EM, Phillips K-A,
Beral V, Black J, Blanks R, Bradbury K, Brown A, Cairns B, Canfell K, Canoy D, Chadwick Daly MB, Buys SS, Hopper JL, MacInnis RJ. 10-Year performance of four models of
A, Crossley B, Crowe F, Ewart D, Ewart S, Fletcher L, Floud S, Gathani T, Gerrard L, breast cancer risk: a validation study. Lancet Oncol 2019;20:504–17.
Goodill A, Green J, Guiver L, Hozak M, Lingard I, Kan SW, Kirichek O, Langston N, Liu 38 Barnes DR, Rookus MA, McGuffog L, Leslie G, Mooij TM, Dennis J, Mavaddat N,
B, Moser K, Pirie K, Reeves G, Shaw K, Sherman E, Strange H, Sweetland S, Tipper S, Adlard J, Ahmed M, Aittomäki K, Andrieu N, Andrulis IL, Arnold N, Arun BK, Azzollini J,
Travis R, Trickett L, Wright L, Yang O, Young H, Banks E, Beral V, Carpenter L, Dezateux Balmaña J, Barkardottir RB, Barrowdale D, Benitez J, Berthet P, Białkowska K, Blanco
C, Green J, Patnick J, Peto R, Sudlow C. Tubal ligation and incidence of 26 site-specific AM, Blok MJ, Bonanni B, Boonen SE, Borg Åke, Bozsik A, Bradbury AR, Brennan P,
cancers in the Million women study. Br J Cancer 2016;114:1033–7. Brewer C, Brunet J, Buys SS, Caldés T, Caligo MA, Campbell I, Christensen LL, Chung
27 Pfeiffer RM, Park Y, Kreimer AR, Lacey JV, Pee D, Greenlee RT, Buys SS, Hollenbeck WK, Claes KBM, Colas C, Collonge-Rame M-A, Cook J, Daly MB, Davidson R, de la
A, Rosner B, Gail MH, Hartge P. Risk prediction for breast, endometrial, and ovarian Hoya M, de Putter R, Delnatte C, Devilee P, Diez O, Ding YC, Domchek SM, Dorfling
cancer in white women aged 50 Y or older: derivation and validation from population- CM, Dumont M, Eeles R, Ejlertsen B, Engel C, Evans DG, Faivre L, Foretova L, Fostira F,
based cohort studies. PLoS Med 2013;10:e1001492. Friedlander M, Friedman E, Frost D, Ganz PA, Garber J, Gehrig A, Gerdes A-M, Gesta
28 Clyde MA, Palmieri Weber R, Iversen ES, Poole EM, Doherty JA, Goodman MT, Ness P, Giraud S, Glendon G, Godwin AK, Goldgar DE, González-Neira A, Greene MH,
RB, Risch HA, Rossing MA, Terry KL, Wentzensen N, Whittemore AS, Anton-Culver H, Gschwantler-Kaulich D, Hahnen E, Hamann U, Hanson H, Hentschel J, Hogervorst FBL,
Bandera EV, Berchuck A, Carney ME, Cramer DW, Cunningham JM, Cushing-Haugen Hooning MJ, Horvath J, Hu C, Hulick PJ, Imyanitov EN, Isaacs C, Izatt L, Izquierdo A,
KL, Edwards RP, Fridley BL, Goode EL, Lurie G, McGuire V, Modugno F, Moysich KB, Jakubowska A, James PA, Janavicius R, John EM, Joseph V, Karlan BY, Kast K, Koudijs
Olson SH, Pearce CL, Pike MC, Rothstein JH, Sellers TA, Sieh W, Stram D, Thompson M, Kruse TA, Kwong A, Laitman Y, Lasset C, Lazaro C, Lester J, Lesueur F, Liljegren A,
PJ, Vierkant RA, Wicklund KG, Wu AH, Ziogas A, Tworoger SS, Schildkraut JM. Risk Loud JT, Lubiński J, Mai PL, Manoukian S, Mari V, Mebirouk N, Meijers-Heijboer HEJ,
prediction for epithelial ovarian cancer in 11 United States–Based case-control Meindl A, Mensenkamp AR, Miller A, Montagna M, Mouret-Fourme E, Mukherjee S,
studies: incorporation of epidemiologic risk factors and 17 confirmed genetic loci. Am Mulligan AM, Nathanson KL, Neuhausen SL, Nevanlinna H, Niederacher D, Nielsen
J Epidemiol 2016;184:555–69. FC, Nikitina-Zake L, Noguès C, Olah E, Olopade OI, Ong K-R, O’Shaughnessy-Kirwan
Lee A, et al. J Med Genet 2021;0:1–12. doi:10.1136/jmedgenet-2021-107904 11You can also read