Computer-Controlled Voltage/Current Source and Response Monitoring System for Electrochemical Investigations
←
→
Page content transcription
If your browser does not render page correctly, please read the page content below
Int. J. Electrochem. Sci., 16 (2021) Article ID: 210659, doi: 10.20964/2021.06.04

 International Journal of
 ELECTROCHEMICAL
 SCIENCE
 www.electrochemsci.org

Computer-Controlled Voltage/Current Source and Response
Monitoring System for Electrochemical Investigations
Zoran Stevic1, Misa Stevic2, Ilija Radovanovic3, Predrag Stolic4, Milos Milesevic5, Milos Marjanovic6,
Milan Radivojević7, Sanja Petronic8
1
 University of Belgrade, Technical faculty Bor, School of Electrical Engineering;
2
 Elsys, Belgrade
3
 School of Electrical Engineering, University of Belgrade, Innovation Center of School of Electrical
Engineering in Belgrade, Serbia
4
 University of Belgrade, Technical Faculty Bor
5
 School of Electrical Engineering, University of Belgrade
6
 MS Kablovi, Paracin, Serbia
7
 Mining and Metallurgy Institute Bor, Bor, Serbia
8
 The Academy of Applied Technical Studies Belgrade, Katarine Ambrozic 3, Belgrade, Serbia
*
 E-mail: zstevic@tfbor.bg.ac.rs

Received: 28 January 2020 / Accepted: 26 March 2021 / Published: 30 April 2021

In this paper, a computer-controlled voltage and current source, together with a response monitoring system
for electrochemical investigations, is presented. The measuring system consisted of two major parts:
the measuring hardware (HW) and the proprietary software. The hardware included the data acquisition
USB card NI USB 6211 from National Instruments Company as well as all needed circuits (the analogue
front end, the signal conditioning circuits, and power supplies). The software is based on the LabVIEW
platform from National Instruments, and it is designed to control the signal generation and
measurements, to cancel the noise in the signals, and to calibrate the device. The supported
electrochemical methods are potential, potentiostatic and galvanostatic measurements, as well as the
cyclic voltammetry and impedance measurments. The system was thoroughly tested, and it was
determined that the system characteristics fulfil the requirements for most of the electrochemical and
bioelectrochemical measurements, supercapacitor characteristics investigations, and much more. The
overall system is modular; the HW and SW can easily be upgraded to support different methods and
purposes and, therefore, the performance of the system.

Keywords: electrochemical instrumentation, LabVIEW, computer-controlled voltage/current source,
computer measurement, Electrochemical Impedance Spectroscopy
Int. J. Electrochem. Sci., 16 (2021) Article ID: 210659 2

1. INTRODUCTION

 In the last decade, the number of different systems based on electrochemical solutions, such as
accumulator batteries, capacitors, and supercapacitors, together with various sensors has grown [1–5].
For example, batteries are typical devices with low specific power and high specific energy, while
conventional capacitors can have high specific power but low specific energy. Therefore,
supercapacitors fulfil the wide area between accumulator batteries and conventional capacitors in terms
of specific power and specific energy. However, these components have one thing in common: their
constantly improving characteristics, such as recent Li–Po batteries have higher capacities than the
batteries a decade ago, various low-cost sensors with high precision are invented, while sensors size is
reduced and end response improved.
 All the previously mentioned progress would not be possible without different electrochemical
investigations based on various material testing methods, characteristics measurements, and response
monitoring [6]. There are a number of standard methods for testing electrochemical systems, but these
methods are very expensive and not affordable for users. In this paper, a simple and affordable computer-
supported system that allows most standard testing methods will be presented.
 The computer-controlled response monitoring system for electrochemical investigations with
voltage and current sources is a universal, easily customisable device intended for various investigation
and research purposes [7]. It can be used in physical electrochemistry, electrochemical corrosion, battery
testing, fuel cell testing, solar cell testing, sensor development, and more [8,9]. The system is designed
for electrochemical laboratories, institutes, and faculties, where it could be used instead of standard
equipment, while maintaining the quality of the results and measurement accuracy.
 The idea behind the assembly of this system is modularity. The main system components are
physically separated and can easily be changed/replaced. As mentioned in the abstract, the supported
methods by default are the potential measurements, potentiostatic and galvanostatic measurements,
cyclic voltammetry and impedance measurements. Each method uses a different application, while every
application is detached from each other and, therefore, can easily be adopted for any user-needed
purpose. Additionally, it is also possible to develop custom applications or to customise existing
applications. When it comes to the hardware part of the system, the concept is similar. The system
consists of three major modules: the data acquisition module, the analogue front-end module, and the
power supply unit (PSU). Each is physically separated from the other. Therefore, it is easier to upgrade
the system in order to achieve even better properties, such as the input and output impedance of the
voltage and current generators, frequency characteristics, and measurement accuracy, or to add more
input measuring channels if needed [10–12].

2. HARDWARE

 Today, computer-assisted platforms and similar design methods are often used for engineering,
product development, and for creating end-user products. When it comes to laboratory experiments,
computer-assisted platforms are widely used due to their modularity and, therefore, upgradeability. They
Int. J. Electrochem. Sci., 16 (2021) Article ID: 210659 3 also offer a powerful computing performance platform with other capabilities, such as experimental simulations, which could be executed either in the laboratory or remotely over the Internet connection [13,14]. Instead of classical measurement equipment, general purpose personal computers, inexpensive acquisition card and related software are increasingly being used. When combined with an application- specific user interface, a system suitable for collecting, measuring and processing data and controlling various experiments can easily be achieved [15]. These systems can be adapted for various purposes and user needs, from low-cost systems to high performance ones, while high precision, sampling rate, and accuracy can be achieved. A system for control and measurement based on a PC and external interface for monitoring the response of the electrochemical system and signal generation was developed. The external interface is compatible with any Microsoft Windows® 7 or newer based PC with USB2.0 or higher interface. The USB connector is used for data transfer, while the separate AC plug is used to power the device and, therefore, to ensure that no additional PC requirements or other devices are needed for operation. In order to meet the requirements of the control and measurement system, the circuit was designed with the characteristics shown in Table 1, and the principal scheme is shown in Fig. 1. Table 1. Electrical characteristics of the system. Number of voltage outputs 1 Number of current outputs 1 Voltage output range ±10 V Maximum output current 500 mA Voltage/current output resolution ±0.15 μV/±10 pA Number of voltage inputs 2 ±0.2 V, ±1 V, ±5 V, ±10 Input voltage ranges V Voltage input accuracy ±3 µV Input impedance 1010 Ω Sampling rate 250 kS/s The hardware part of the system is divided in three major parts: Data acquisition module Analog front-end module Power supply unit
Int. J. Electrochem. Sci., 16 (2021) Article ID: 210659 4

 Figure 1. The principal scheme of the system.

2.1 Data acquisition module

 For the measurement and system control, a commercially available data acquisition card was
used: NI USB-6211 (the USB multifunction input/output device from National Instruments company).
Compared to other successors in the same price range, it has a fairly high performance. It is a complete
solution for a user-configurable data acquisition device, offering analogue and digital inputs and outputs
and two 32-bit counters. It also has integrated high-speed variable gain amplifiers on analogue input
channels so that users can set the input range on each channel individually. All these features make it a
very useful solution for various applications, including the control and design of laboratory equipment
and instruments, academic research, data logging, in-vehicle data acquisition, and more [16]. Having
portability in mind, the device is completely controlled and powered over the USB interface.

Table 2. Specifications and features of the NI USB 6211 acquisition card.

 16 (single ended)/8
 Number of input analogue channels (AI)
 (differential)
 Number of output analogue channels (AO) 2
 Number of input digital channels (DI) 4
 Number of output digital channels (DO) 4
 Sampling rate 250 kS/s (multiplexed)
 ±0.2 V, ±1 V, ±5 V,
 I/O voltage ranges
 ±10 V
 AD convertor resolution 16 bit
 DA convertor resolution 16 bit
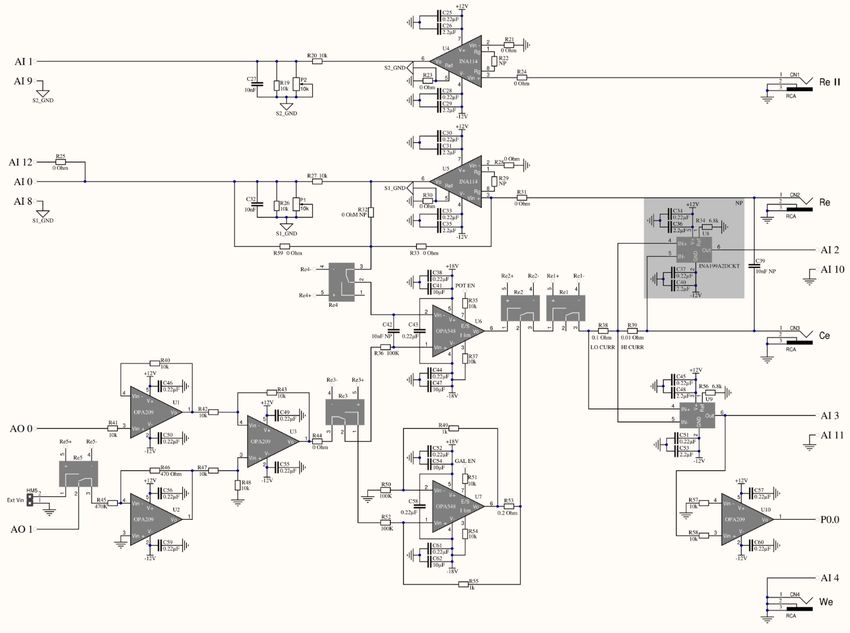
Int. J. Electrochem. Sci., 16 (2021) Article ID: 210659 5

 The generation of voltage and current signals, the processing of analogue signals coming from
the sensing electrodes, and the monitoring of the system's response to these signals was processed by a
previously mentioned data acquisition card. The most important features of the NI USB-6211 are shown
in Table 2.

2.2 Analog front-end module

 The generation of voltage and current output signals, as well as the monitoring of the system's
response to these signals is performed through a set of electronic circuits, which forms the analogue front
end (AFE). The input signals from reference electrodes 1 and 2 are buffered with amplifiers A1 and A2
and sent to the acquisition module (Fig. 2). Consequently, high input impedance of the system is
achieved, and, therefore, the stability of the system is improved due to the fact that the electrodes by
themselves can have a large internal resistance.
 The analogue voltage outputs from the acquisition module (AO CH0 and AO CH1) can both be
used simultaneously, depending on the user requirements. However, there is a difference in system
behaviour depending on the analogue output used. The voltage from output AO CH1 is divided by 1000
and then sent to the summing amplifier, while the voltage from output AO CH0 is sent directly. That
means that the output AO CH1 can generate the output signals within a ±10 mV range on the output of
the summing amplifier. Following the previous, the signal is brought to a series of relays (Re1, Re2),
whose purpose is to switch between the potentiostat or galvanostat used for the system output signal
generation. The potentiostat (U6=OPA548 in Fig. 2) amplifies the output voltage from the summing
amplifier by 1, and, therefore, the maximum output voltage of the whole system is ±10 V. However, its
maximum output current is 500 mA, which is far higher than the outputs from the DA converter or any
other internal amplifiers. The galvanostat (U7=OPA548 in Fig. 2), on the other hand, has a ratio of 1
V/50 mA, which means that the maximum output current is 500 mA in case that the control signal is at
its maximum of 10 V. Knowing that the output AO CH1 is divided by 1000 before its summing with A0
CH0, in potentiostatic mode, it can generate a system output voltage of up to ±10 mV, while in the
galvanostatic mode currents of up to 500 µA can be generated. As already mentioned, both analogue
outputs from the DA converter can be used simultaneously, so it is possible to keep both the voltage
output range of AO CH0 (±10 V) and the resolution of the AO CH1 on the same output channel from
the system (counter electrode). In potentiostat mode, the absolute maximum resolution is 10
mV/216=0.15 µV, while in galvanostatic mode it is 0.5 mA/216=7.63 pA. However, due to component
tolerances, various environmental effects on the system, signal noises, etc. in the electrical characteristics
of the system (shown in Table 1), the resolution of the AO CH0 DA converter output is chosen. The
overall system design with the features described above is the original design and the authors’ own
creation. In Fig. 2, the analogue front-end circuit diagram is shown.
Int. J. Electrochem. Sci., 16 (2021) Article ID: 210659 6

 Figure 2. The schematic diagram of the analogue front-end module.
Int. J. Electrochem. Sci., 16 (2021) Article ID: 210659 7

2.3 Power supply unit

 The power supply unit consists of two separate switched-mode-based 220 V AC input and 18 V
DC output modules. The main reason for using the switched-mode power supply is due to its advantages:
high efficiency (>80%), small size, high output current (maximum of 3A), compact design, and light
weight. However, there are well-known disadvantages of the switched-mode-based power supplies:
output voltage ripple, glitches, and spikes. On the other hand, all three mentioned disadvantages require
a single solution: solid output voltage filtering. Having that in mind, the analogue front-end module has
the on-board power supply filtering section, which greatly reduces the noise from the power supply.
Besides that, for powering the measurement amplifiers and other sensitive parts of the system, the
voltage regulator circuits are used to ensure a clean and stable power supply.

3. SOFTWARE

 The software platform used for this particular system is LabVIEW (from National Instruments
company) due to its high standard in the area of modern virtual instruments [17,18]. LabVIEW is based
on the principles of virtual instruments with a graphical user interface. The graphical user interface has
two windows: the front panel and the block diagram.
 LabVIEW is an object-oriented, graphical programming language. Therefore, the user interface
is built using a set of various tools and objects. The user interface is known as the front panel. The code
is then added by using graphical representations of functions to control the front panel objects, shown
on the block diagram. In this paper, the front panels, as well as block diagrams, are shown below for the
most common electrochemical methods.
 For external connections over the AD-DA converter, the NI data acquisition driver collection is
used. The installation of these packages and the AD-DA converter results in a powerful development
and measurement system that can be used for system control and signal processing.
 Applications have been made for various electrochemical investigation methods. The
potentiostatic and galvanostatic methods, as well as cyclic voltammetry, are presented in this paper.
Every application consists of a unique block diagram and front panel, making them user friendly.
Therefore, choosing between different methods is done by running the appropriate application. In that
way, it is ensured that no access code is present and that the system is well optimised and running stable.
Besides that, the front panels are made in a minimalistic style, so that user can quickly set all needed
parameters and monitor the results. In addition to the possibility of continuous monitoring of the flow of
the process, it is also possible to continuously record data in the appropriate file on the computer. The
data is recorded as raw measurement values in time, and the specified file are saved in TXT format,
which allows the obtained data to be further processed (DSP, Data Science, etc.) and interpreted by any
external data visualisation and analysis software. This feature enables the existing system to be integrated
into other systems and to achieve certain compatibility between them.
Int. J. Electrochem. Sci., 16 (2021) Article ID: 210659 8

3.1 Galvanostatic method

 The galvanostatic method refers to an experimental technique whereby the working electrode is
used as an output of the system, maintaining a constant current in the electrolyte used in the experiment.
In galvanostatic tests, the potential of the reference electrode is plotted in a potential versus time diagram
at constant current. This technique is most widely used to measure corrosion rate and electrochemical
reactions. It is used for controlled bi-directional polarisation of metal surfaces in electrolytes in order to
observe cathodic and anodic behaviours.
 The voltage levels on the AI CH0 and AI CH1 channels of the acquisition card were processed
(Fig. 2). After filtering and averaging, the potential value (eta[V]) was obtained, which represents the
galvanostatic response, and is displayed on the eta[V] indicator and on the time diagram.
 The current intensity is achieved by the voltage-controlled current generator, which is included
in AFE. The control voltage is set by the DAQ assistant block in relation to 1 V/50 mA. The length of
the galvanostatic impulse is controlled by setting the tp[s] since the application compares the wanted
impulse length with the current time and then defines the end of the impulse. Similar to the pulse length,
all the other parameters can be set in the front panel of the application: output current I[mA], beginning
potential Ebeg[V], the duration of the impulse tp[s], tp[min] and tp[h], and pause time, t0, which is also
given in the format of seconds, minutes, and hours. Besides the control boxes, the control panel also
contains the indicators of the actual current, and the overvoltage and time have been shown on the panel
as well as the E=f(t) graph, which can later be saved as an image in PNG format.
 The wanted measurement record file name and path are chosen right after starting the application.
That way, the application is capable of recording the measurements in the file in real time so that in the
case of any system or experiment failure (i.e., power outage), all the data recorded up to that very moment
is saved.

3.2 Polarization curves

 By recording the family of galvanostatic curves for different current densities and reading the
corresponding overvoltage, a set of points for the polarisation curve was obtained. The current is
introduced in a logarithmic scale in order to linearise the curve in the Tafel region. At the point of
intersection of the tangents to the anodic and cathodic polarisation curves, a corrosion current is obtained.

3.3 Potentiostatic method

 In the potentiostatic method, similarly as in the galvanostatic method, the pulse is first defined.
Afterwards, the user sets the tp[s], the total time of the experiment (period) tu[s], and the condition for
stopping the time loop. As is usual with all voltage methods, the current reading is performed, using AI
CH2 and AI CH3 in this case, depending on the wanted range and resolution, and the assigned voltage
is on the zero-output channel AO0 (Fig. 2).
Int. J. Electrochem. Sci., 16 (2021) Article ID: 210659 9

3.4. Cyclic voltammetry

 In this method, current measurements were made using the channels AI CH2 and AI CH3, while
channels AO CH0 and AO CH1 were used for setting the output voltage (Fig. 2), as in the potentiostatic
method. The current measurement and assignment of the output voltage (channel AO CH0 and AO CH1)
were the same with the potentiostatic method, but the output voltage was variable over time. Therefore,
the user has to set the following: the beginning value of the output potential (Ebeg), the final potential
(Efin), and the potential sweep rate (dE/dt). All these settings are available on the front panel of the
application, known as the control boxes.
 The output voltage and the current reading resolutions also remain the same as in the
potentiostatic method. However, because of the nature of the method, requiring constant changing of the
output voltage, the different, slightly more complex application is needed. The main difference in
comparison with the potentiostatic method application is that the cyclic voltammetry application
calculates the desired output voltage in real time, while executing the cycle, according to the following
equations:

 = ⋅ + ; t ≤ t1

 = − ⋅ + 2 − ; t > t1

 where E is the actual potential, t is time, k is the sweep rate, t1 is the rise time, Ebeg is the beginning
potential, Emax is the maximum potential, and Emin is the minimum potential.

4. RESULTS AND DISCUSSION

 A prototype of the developed system and parameter adjustments were made. Using the 5½ digit
voltmeter PRIMA B7-21A, EAST TESTER LCR METER ET 4410, and lock-in laboratory multi-meter
KEITHLEY 193A SYSTEM DMM, the measurement system was calibrated for the selected range.
Then, the complete system was tested and tuned using the accompanying software. Setting the offset and
gain constants was reduced to the input constants of the LabVIEW application. The measurement errors
were less than 0.1% in all ranges.
 Signal-to-noise ratio measurements of the system were also performed. The system was
thoroughly tested under various conditions using RTB 2002, which is a premium 2-channel oscilloscope
from Rohde & Schwarz, with the accompanying software, R&S Application Bundle RTB-PK1.
 There are several commercial instruments that can be purchased on the market, but their prices
are much higher, and their characteristics are either slightly better or slightly weaker [19]. A comparison
with a popular Gamry instrument with similar characteristics is made here. The results obtained using
this measurement system are compared with those obtained in the same electrochemical conditions using
the commercial galvanostat-potentiostat Gamry Interface 1010E [20] as the reference instrument. A
Int. J. Electrochem. Sci., 16 (2021) Article ID: 210659 10

series of experiments and comparative analyses [21–23] were executed, and the representative results
obtained by the different methods of the electrochemical tests are presented here.

4.1 Galvanostatic method

 Experimental diagrams for a carbon electrode in a 1 M aqueous solution of sodium nitrate
(NaNO3) at an amperage of 100 mA/g and a pulse duration of 800 s are shown in Fig. 3. Activated carbon
(Aktivkohle, MERCK) was used as a basic active material, and polyvinylidene difluoride (PVDF) was
used as a binder [2,24,25]. The diagrams obtained by the reference instrument, Gamry Interface 1010E,
and the tested system are presented. The maximum deviation was below 0.5%, which is within the
allowed limits, and this can be caused by a change in laboratory conditions.

Figure 3. Galvanostatic diagrams obtained by the reference instrument and the tested measurement
 system.

4.2 Polarization curves

 Polarisation curves for mild steel 0345 recorded in an aqueous 1 M NaCl solution by the
reference instrument, Gamry Interface 1010E, and the tested system are shown in Fig. 4. The maximum
deviation was below 0.4%, which is within the allowed limits.
Int. J. Electrochem. Sci., 16 (2021) Article ID: 210659 11

Figure 4. Polarization curves obtained by the reference instrument and the tested measurement system.

4.3 Cyclic voltammetry

 Cyclic voltammograms for a carbon electrode in a 1 M aqueous solution of sodium nitrate
(NaNO3) at the overpotential changes speed of 2 mV/s are shown in Fig. 5. Activated carbon was used
as the basic active material PVDF. The obtained results showed that no major difference in test results
were present between the two systems that were used.

Figure 5. Cyclic voltammograms obtained by the reference instrument and the tested measurement
 system.
Int. J. Electrochem. Sci., 16 (2021) Article ID: 210659 12

4.4 Potentiostatic method

 A time diagram of the responsive current for the carbon electrode in a 1 M aqueous solution of
sodium nitrate (NaNO3) at a potentiostatic pulse with an intensity of 100 mV and a duration of 500 s is
shown in Fig. 6. The maximum deviation was below 0.4%, which is within the allowed limits.

Figure 6. Potentiostatic diagrams obtained by the reference instrument and the tested measurement
 system.

 The measurement system tests show that all expectations were fulfilled and that the basis for
further improvements (WEB and CLOUD laboratory, IoT technology, etc.) was founded.

5. CONCLUSION

 The default version of the system was thoroughly tested in many different conditions with
material samples, and the obtained results were compared with test results of referent commercial
devices. The obtained results proved that it is possible to match the most significant characteristics of
more expensive devices for most of the investigation methods using the presented low-cost device.
 The appropriate hardware (data acquisition device with desired external analogue front end) in
conjunction with a personal computer equipped with the software developed in the LabVIEW
environment is a very powerful, customisable measurement system applicable in scientific and research
fields. Due to its characteristics, it can be adopted to meet low-cost requirements or, on the other hand,
to serve as a more expensive but faster and more precise device. Thanks to its open architecture, it can
Int. J. Electrochem. Sci., 16 (2021) Article ID: 210659 13

successfully replace a large number of specialised and very often high-cost measurement equipment.
The presented system can be further used in new areas and scientific fields, as well as developed by
adding new methods and virtual instruments. Currently, this measurement system is in use in electronics,
electrical engineering, and physics for educational purposes. It could easily be adapted for chemistry and
physical chemistry.
 Since the system is the author's own creation and since the hardware and software are fully
customisable, in further developments the system could be adapted for remote operation and data sharing
among users, which would increase the usability of the described system. Besides the ability to record
the results in a suitable file, cloud support is also considered as a very powerful potential upgrade to the
existing system.

ACKNOWLEDGEMENTS
This research was funded by the Ministry of Education, Science and Technological Development of the
Republic of Serbia, with contract numbers 451-03-9/2020-14/200131 and 451-03-68/2020-14/200223.

References

1. H. Deng, M. Zhu, T. Jin, C. Cheng, J. Zheng and Y. Qian, Int. J. Electrochem. Sci., 15 (2020) 16
2. S. Martinović, M. Vlahović, E. Ponomaryova, I. V. Ryzhkov, M. Jovanović, T. Volkov Husović and
 Z. Stević, Int. J. Electrochem. Sci., 12 (2017) 7287
3. C. Liu and Z. Zhang, Electrochemical Materials Design for Micro-Supercapacitors In
 Supercapacitor Design and Applications, Editor Zoran Stević, Intech, (2016) Rijeka, Croatia.
4. Z. Yunusa, M. N. Hamidon, A. Kaiser and Z. Awang, Sensors & Transducers, 4 ( 2014) 61.
5. J. Grimshaw, Electrochemical Reactions and Mechanisms in Organic Chemistry, Elsevier, ( 2000)
 Amsterdam, Netherlands.
6. Z. Stević, Z. Andjelković and D. Antić, Sensors, 8 (2008) 1819.
7. B. Paton, Introduction to NI ELVIS, National Instruments Corporation, (2009) Austin, Texas.
8. Z. Stevic, M. Rajcic-Vujasinovic and I. Radovanovic, Int. J. Electrochem. Sci., 9 (2014) 7110.
9. Z. Stević, M. Rajčić Vujasinović and A. Dekanski, Sensors, 9 (2009) 7365.
10. G. Saggio, Principles of Analog Electronics, CRC Press, (2014) Boca Raton, Florida.
11. P. Purkait, B. Biswas, S. Das and C. Koley, Electrical and Electronics Measurements and
 Instrumentation, McGraw Hill Education India Private Limited, (2013) New Delhi, India.
12. D. F. A. Edwards, Electronic Measurement Techniques, 2nd ed.; Butterworth-Heinemann, (1991)
 Oxford, United Kingdom.
13. J. Yun, I. Y. Ahn, J. S. Song and J. Kim, Sensors, 19 (2019) 4567.
14. S. K. Yadav, S. Raj and S. S. Roy, Int. J. Adv. in R&T, 2 (2013) 1025.
15. K. Rojek, R. Schmechel and N. Benson, Meas. Sci. Technol., 31 (2020) 015901.
16. National Instruments Team, NI USB-621x User Manual, National Instruments Corporation, (2009)
 Austin, Texas.
17. National Instruments Team, Getting Started with LabVIEW, National Instruments Corporation,
 (2013) Austin, Texas.
18. S. Folea, LabVIEW - practical applications and solutions, Intech, (2011) Rijeka, Croatia.
19. T. Dobbelaere, P. M. Vereecken and C. Detavernier, HardwareX, 2 (2017) 34.
20. Gamry Instruments, Manual2, https://www.gamry.com/assets/Uploads/Interface-1000-Operators-
 Manual2.pdf
21. Gamry Instruments, Echem Analyst™ software, https://www.gamry.com/assets/Uploads/Echem-
 Analyst-QSG-988-00016-rev-2-for-web.pdf
Int. J. Electrochem. Sci., 16 (2021) Article ID: 210659 14

22. M. Smiljanić, Z. Rakočević and S. Štrbac, Int. J. Electrochem. Sci., 8 (2013) 4941.
23. M.D. M. Dryden and A. R. Wheeler, PLOS One, 10 (2015) e0140349.
24. Q. Abbas, D. Pajak, E. Frackowiak and F. Béguin, Electrochim. Acta, 140 (2014) 132.
25. Z. Zhu, S. Tang, J. Yuan, X. Qin, Y. Deng, R. Qu and G.M. Haarberg, Int. J. Electrochem. Sci., 11
 (2016) 8270.

© 2021 The Authors. Published by ESG (www.electrochemsci.org). This article is an open access
article distributed under the terms and conditions of the Creative Commons Attribution license
(http://creativecommons.org/licenses/by/4.0/).
You can also read