Coordinated Behavior on Social Media in 2019 UK General Election - arXiv
←
→
Page content transcription
If your browser does not render page correctly, please read the page content below

Coordinated Behavior on Social Media in 2019 UK General Election

                                            Leonardo Nizzoli,12∗ Serena Tardelli,12∗† Marco Avvenuti,2 Stefano Cresci,1 Maurizio Tesconi1
                                                                                     1
                                                                                     Institute of Informatics and Telematics, Pisa, Italy
                                                                              2
                                                                                  Dept. of Information Engineering, University of Pisa, Italy
arXiv:2008.08370v1 [cs.SI] 19 Aug 2020

                                                                     Abstract                                        Meanwhile, groundbreaking advances in specific areas of
                                                                                                                  computing are causing profound changes to the online infor-
                                           Coordinated online behaviors are an important part of infor-           mation landscape. Advances in artificial intelligence brought
                                           mation and influence operations, as they allow a more effec-           to the rise of deepfakes – synthetic media where the origi-
                                           tive disinformation’s spread. Most studies on coordinated be-          nal source has been modified via deep learning techniques.
                                           haviors involved manual investigations and the few existing
                                           computational approaches make bold assumptions or over-
                                                                                                                  Deepfakes allow crafting arbitrary texts that resemble the
                                           simplify the problem to make it tractable.                             writing style of a target person, as well as to produce audio
                                                                                                                  and video samples where a target person’s face and voice
                                           Here, we propose a new network-based framework for un-
                                           covering and studying coordinated behaviors on social media.
                                                                                                                  are used to make it look like the person said something that
                                           Our proposal extends existing systems and goes beyond lim-             he or she actually never said. Unsurprisingly, these pow-
                                           iting binary classifications of coordinated and uncoordinated          erful techniques have already been used for creating fake
                                           behaviors. It allows to uncover different patterns of coordina-        news (Zellers et al. 2019), fake profile pictures for deceit-
                                           tion and to estimate the degree of coordination that charac-           ful accounts1 , and to impersonate famous characters and
                                           terizes different communities. We apply our framework to a             politicians on video. With deepfakes, detecting disinforma-
                                           dataset collected during the 2019 UK General Election, de-             tion based on an article’s content, or detecting fake personas
                                           tecting and characterizing coordinated communities that par-           by analyzing their posts and pictures might not be feasible
                                           ticipated in the electoral debate. Our work conveys both theo-         anymore (Boneh et al. 2019).
                                           retical and practical implications, and provides more nuanced
                                                                                                                     However, each IO must spread to and “infect” a large
                                           and fine-grained results for studying online manipulation.
                                                                                                                  number of users for it to be successful, independently on
                                                                                                                  its aims and the tools used to deceive. This often mandates
                                                                                                                  large and coordinated social media efforts in order for the
                                                                 Introduction                                     campaign to obtain a significant outreach, to exert influ-
                                         In recent years, information or influence operations (IOs)               ence, and thus to have an impact. In light of this considera-
                                         have been frequently carried out on social media with the                tion, since 2018 all major platforms showed great interest in
                                         aim to mislead and to manipulate. IOs can take different                 studying coordinated inauthentic behavior (CIB)2 . Despite
                                         shapes, target different individuals, online crowds or com-              often appearing together, coordination and inauthenticity are
                                         munities, and have diverse goals (Starbird, Arif, and Wil-               two distinct concepts. For example, activists and other grass-
                                         son 2019). Among the strategic tools used by perpetrators                roots initiatives typically feature coordinated but authentic
                                         are fake news, propaganda, hateful speech, astroturfing, col-            behaviors. Conversely, one might maneuver a single fake ac-
                                         luding users (e.g., paid trolls), and automation (e.g., social           count with the intent to mislead, thus exhibiting inauthentic
                                         bots). Since the Donald Trump election and the Brexit ref-               but uncoordinated behavior. The majority of existing efforts
                                         erendum in 2016, each of these tools became the focus of                 for studying CIB involved a great deal of manual investi-
                                         extensive scientific attention. The ongoing endeavors have               gations and computational approaches are still few and far
                                         already led to a huge body of work on these issues and to a              between. Among the challenges are the ambiguity and fuzi-
                                         plethora of different solutions for solving them. Despite the            ness of CIB itself: What exactly is a coordinated behavior?
                                         efforts, the efficacy of the proposed solutions is debated, and          What is an inauthentic behavior? How many organized ac-
                                         IOs still appear to pose a serious threat to our democracies             counts are needed for a (meaningful) coordinated behavior
                                         and societies (Barrett 2019).                                            to surface? Unfortunately, there are no agreed-upon answers
                                            ∗                                                                        1
                                              These authors contributed equally.                                       https://www.wired.com/story/facebook-removes-accounts-ai-
                                            †                                                                     generated-photos/
                                              Corresponding author. serena.tardelli@iit.cnr.it
                                                                                                                     2
                                         Copyright c 2020, Association for the Advancement of Artificial               https://about.fb.com/news/2018/12/inside-feed-coordinated-
                                         Intelligence (www.aaai.org). All rights reserved.                        inauthentic-behavior/
to these questions and, thus, operationalizing these concepts    tect and characterize coordinated online behaviors. Among
and developing computational methods for their analysis,         them, the most similar approach to our present work was
represent open challenges. In particular, no successful at-      proposed in (Pacheco et al. 2020; Pacheco, Flammini, and
tempt has been reported so far for automatically distinguish-    Menczer 2020), which we extend and generalize. Pacheco
ing between authentic and inauthentic coordination (Vargas,      et al. propose to extract behavioral traces of online activ-
Emami, and Traynor 2020). Instead, a few interesting works       ity and use them to build a bipartite network. Then, they
have been recently proposed for the simpler task of detecting    project this network onto the accounts, obtaining a user-
and studying coordinated behaviors, disregarding intent and      similarity network. Next, they filter low-weight edges by
authenticity. In the present work, we also focus on this task.   applying a restrictive, arbitrary similarity threshold. The re-
To this end, the few existing techniques make bold assump-       maining connected nodes are so similar to be deemed co-
tions or oversimplifications, such as using fixed thresholds     ordinated. Finally, they compute and analyze the connected
to obtain a binary distinction between coordinated and un-       components of the filtered network, and each component
coordinated behaviors (Pacheco et al. 2020). Coordination        is considered as a distinct group of coordinated users. We
however is a complex, non-binary concept, similarly to au-       have several differences with respect to (Pacheco et al. 2020;
tomation (Cresci 2020) and inauthenticity (Starbird 2019).       Pacheco, Flammini, and Menczer 2020), the most impact-
   Here, we go beyond existing approaches for studying           ful one being that we do not apply a similarity-based fil-
coordinated behaviors by proposing a new network-based           ter. Their choice results in a sharp definition of coordinated
framework that relaxes previous assumptions, and that ex-        users, which are subsequently investigated, while uncoordi-
tends and generalizes existing works. Within our framework,      nated ones are ignored. However, this sharp distinction is
coordination is defined as an unexpected, suspicious or ex-      an artifact introduced to simplify the analysis. In our frame-
ceptional similarity between any number of users. We do          work we do not apply a similarity-based filter, but we iter-
not provide a binary classification of coordinated vs unco-      atively perform community detection at different levels of
ordinated users, but instead we estimate the extent of coor-     coordination. In this way, we are able to study the whole
dination. In practice, our framework builds a user-similarity    extent of coordination among the accounts, uncovering dif-
network. Then, we obtain the multi-scale backbone of the         ferent patterns and dynamics of coordination that would not
network by retaining only statistically-relevant links and       be visible with a simpler approach.
nodes. Next, we iteratively perform community detection             The work discussed in (Giglietto et al. 2020b; 2020a) fo-
on subsets of increasingly coordinated users. Our approach       cuses on a specific instance of CIB. Authors propose a 2-step
does not require fixed thresholds for defining coordination.     process for the detection of coordinated link sharing behav-
Rather, it allows to study the whole extent of coordina-         ior, and they test it on a Facebook dataset. In the first step,
tion found in the data, from weakly-coordinated users to         they detect groups of entities that all shared a given link, al-
strongly-coordinated ones. Finally, we experiment with a set     most at the same time. In the second step, the coordinated
of network measures for studying and characterizing coordi-      networks are identified by connecting only those entities
nated communities. We test our framework on Twitter in the       that repeatedly shared the same links. Inauthenticity is then
context of the 2019 UK General Election (GE), showing the        manually assessed by analyzing shared domains and stories.
usefulness of our approach.                                      The proposed algorithm requires two parameters: one for
   Our main contributions are as follows:                        defining near-simultaneous link sharing, and the other for
• We move beyond existing approaches for detecting co-           defining repetitive link sharing. Similarly to (Pacheco et al.
  ordination by proposing a more nuanced, non-binary,            2020), these parameters represent fixed similarity thresholds
  network-based framework.                                       used for filtering. Also Assenmacher et al. propose a 2-step
                                                                 framework for detecting IOs (Assenmacher et al. 2020b;
• We uncover coordinated communities that operated dur-
                                                                 2020a). Initially, they apply unsupervised stream clustering
  ing the 2019 UK GE, and we discuss them in light of their
                                                                 and trend detection techniques to social media streams of
  role in electoral debate.
                                                                 text, identifying groups of similar users. Then, they propose
• We find and discuss different patterns of coordination, that   to apply standard offline analyses, including manual inspec-
  emerge from the behavior of different communities. This        tion via visualizations and dashboards, for assessing inau-
  is made possible by our non-binary approach to coordina-       thenticity. Another study leverages a ground-truth of coor-
  tion, and it demonstrates the power of our framework.          dinated accounts involved in a disinformation campaign to
• We empirically demonstrate that coordination and au-           identify network measures for detecting IOs (Keller et al.
  tomation are orthogonal concepts. Thus, our framework          2020). Authors conclude that the traces left by coordina-
  can complement long-studied techniques for detecting au-       tion among astroturfing agents are more informative than
  tomation, manipulation and inauthenticity.                     the typical individual account characteristics used for other
                                                                 related tasks (e.g., social bot detection). In addition, they
• We create and publicly share a large dataset for the 2019      also develop an astroturfing detection methodology based on
  UK GE, comprising 11M tweets shared by 1,2M users.             the previously identified coordination patterns. In (Fazil and
                                                                 Abulaish 2020) is proposed a multi-attributed graph-based
                     Related Work                                approach for detecting CIB in Twitter. Authors model each
Due to the many existing challenges, to date only few works      user with a 6-dimensional feature vector, compute pairwise
have attempted to develop computational means to de-             similarities obtaining a user-similarity graph and finally ap-
ply Markov clustering, labeling the resulting clusters as in-              hashtag                  leaning     users         tweets
authentic coordinated groups. In (Fazil and Abulaish 2020),                #GE2019                      N     436,356      2,640,966
high coordination automatically implies inauthenticity.                    #GeneralElection19           N     104,616        274,095
   Instead of proposing a new technique, the study in (Var-                #GeneralElection2019         N     240,712        783,805
gas, Emami, and Traynor 2020) focuses on determining the                   #VoteLabour                  L     201,774        917,936
usefulness and reliability of previously-proposed network-                 #VoteLabour2019              L      55,703        265,899
based metrics of coordination. Several authors, including                  #ForTheMany                  L      17,859          35,621
some of those previously mentioned, report positive re-                    #ForTheManyNotTheFew         L      22,966          40,116
sults for the detection of inauthentic behavior via the anal-              #ChangeIsComing              L       8,170          13,381
                                                                           #RealChange                  L      78,285         274254
ysis of suspicious coordination (Ratkiewicz et al. 2011;
                                                                           #VoteConservative            C      52,642        238,647
Keller et al. 2020; Fazil and Abulaish 2020). However, the                 #VoteConservative2019        C      13,513          34,195
results of (Vargas, Emami, and Traynor 2020) show that,                    #BackBoris                   C      36,725        157,434
when evaluated in non-trivial real-world scenarios, such pre-              #GetBrexitDone               C      46,429        168,911
viously proposed approaches are unable to distinguish be-
                                                                           total                        –     668,312      4,983,499
tween authentic (e.g., activists, fandoms) and inauthentic co-
ordination. These results confirm that coordination and inau-
thenticity are different concepts, and that high coordination          Table 1: Statistics about data collected via hashtags.
does not necessarily imply inauthenticity.
                                                                                           production               interactions
                              Dataset                                   account          leaning   tweets       retweets         replies
By leveraging Twitter Streaming APIs, we collected a large              @jeremycorbyn      L         788       1,759,823        414,158
dataset of tweets related to the 2019 UK GE. Our data col-              @UKLabour          L       1,002         325,219         79,932
lection covered one month prior to election day, from 12 Nov            @BorisJohnson      C         454         284,544        382,237
to 12 Dec 2019, included. During that period, we collected              @Conservatives     C       1,398         151,913        169,736
each tweet that contained at least one hashtag from a list we           total              –       3,642       2,521,499      1,046,063
created. Our list contains the most popular hashtags, both
those used by the two main parties, as well the neutral ones.         Table 2: Statistics about data collected from accounts.
Table 1 lists all hashtags used at this step, the corresponding
political leaning (N: neutral, L: labour, C: conservative), as
well the data we collected. The tweets column only counts
                                                                   2. Select similarity measure. Both in our framework and in
quoted retweets if the quote text contains one of the hashtags
                                                                      previous work (Pacheco et al. 2020), unexpected similar-
in table. The remaining quoted retweets are still included in
                                                                      ity between users is used as a proxy for coordination. Sim-
our dataset, but they are not counted in Table 1. In addition to
                                                                      ilarity can be computed in many different ways. Hence,
the aforementioned hashtags-based collection, we also col-
                                                                      this step deals with the selection of a similarity measure.
lected all tweets published by the official accounts of the 2
                                                                      Examples of valid options are the cosine similarity be-
parties and their leaders, together with all the interactions
                                                                      tween user feature vectors encoding account profile char-
(i.e., retweets and replies) they received. Table 2 shows the
                                                                      acteristics, as done in (Fazil and Abulaish 2020), or the
accounts and the collected data. Our final dataset for this
                                                                      Jaccard similarity between the sets of hashtags used by
study is the combination of data shown in Tables 1, 2 and
                                                                      each user, or between the sets of followings or retweeted
quoted retweets, and includes 11,264,820 tweets published
                                                                      accounts.
by 1,179,659 distinct users. The dataset is publicly available
for research purposes3 .                                           3. Build user similarity network. In this step we compute
                                                                      pairwise user similarities between all users identified at
                       Method overview                                step 1, by means of the metric selected at step 2. We lever-
                                                                      age user similarities to build a weighted undirected user
In this section, we describe our network-based framework              similarity network G(E, V, W ), that encodes behavioral
for detecting coordinated behaviors. Our detailed methodol-           and interaction patterns between users.
ogy is composed of the following 6 main steps, summarized
in Figure 1:                                                       4. Filter user similarity network. When studying real-
                                                                      world datasets of large IOs, the network resulting from
1. Select starting set of users. The first step concerns the se-      step 3 can be simply too big to analyze and even to visu-
   lection of those users to investigate. For instance, given a       alize. Hence, a filtering step is needed. Contrarily to pre-
   large dataset, one might want to investigate most-active           vious work, we avoid simple filtering strategies based on
   users, such as superproducers or superspreaders, or all            fixed edge weight thresholds. We recall that edge weights
   users that tweeted with a particular hashtag, or even all          encode similarity, and to a certain extent coordination, be-
   followers of a given prominent user. Whatever the selec-           tween users. As such, applying a weight threshold t and
   tion criterion, this step returns a list of users to analyze.      discarding all edges e ∈ E whose weight w(e) < t would
                                                                      mean to arbitrarily perform a binary distinction between
    3
        Anonymized link to be revealed upon paper acceptance.         coordinated behaviors (w(e) ≥ t) and uncoordinated
1 2 3 4 5 6
s
el ects
tar
ti
ng sel
ects
imi
l
ari
ty buil
d f
il
ter perf
orm s
tudy
setofuser
s measur
e user
-si
mil
ari
ty user
-si
milar
it
y c
oor
dinati
on-awar
e coordi
nat
ed
networ
k network communi ty c
ommuni t
ies
detect
ion
e.g., e.
g., e.g., e.g., e.g.
,
super
spreader
s, has
htagsimi
lar
it
y, entropy-based, modulari
ty
, net
workmeasur
es,
super
producer
s ret
weetsi
milar
it
y st
ati
sti
calvali
dati
on mini
mum- cut aut
omati
on
Figure 1: Overview of the proposed framework for studying coordinated behavior.
ones (w(e) < t), which is a limiting and theoretically- tion, we put communities into context, and we character-
unmotivated choice. Instead, we propose to use complex ize their content production by applying natural language
networks-based multiscale filtering methods, such as any processing techniques. By leveraging our novel approach
of those discussed in (Garlaschelli and Loffredo 2008; to the detection of coordinated communities described at
Serrano, Boguná, and Vespignani 2009; Tumminello et step 5, we are able to obtain results of these analyses as a
al. 2011). These techniques retain statistically-meaningful function of the extent of coordination between users.
network structures, independently on their scale (i.e., edge
weight). As such, the network filtering step is not biased
towards certain levels of similarity and coordination, but Data: G(E, V, W ) // filtered user similarity network
Result: C
instead it erases network structures that convey limited in-
formation, allowing to focus on meaningful similarities. /* initialization */
1 C0 = perform community detection on G
5. Perform coordination-aware community detection. 2 C = hC0 i
The detection of coordinated groups of users is often 3 t0 = min(w ∈ W )
achieved via clustering and community detection. Given /* detect communities as a function of coordination */
the crude approach to filtering adopted in previous work, 4 i=1
the filtered user similarity network was considered to 5 while ti−1 + δw ≤ max(w ∈ W ) do
only contain highly-coordinated users. A single run of a 6 ti = ti−1 + δw // increment threshold by step δw
community detection algorithm was thus enough to high- 7 E − = {e ∈ E | w(e) < ti } // filter out edges
light coordinated networks. In our case, however, the fil- 8 Gei = G − E −
tered user similarity network still features diverse lev- 9 V − = {v ∈ Vie | d(v) = 0} // filter out nodes
els of coordination. As such, we need a more nuanced 10 Ge,v
i = Gei − V − // obtain subnetwork Ge,v i
approach for surfacing coordinated behaviors. Our ap- 11 initialize community detection with Ci−1
proach is based on an iterative process that takes into ac- 12 Ci = perform community detection on Ge,v i
count increasing levels of coordination, as shown in Al- 13 append Ci to C // trace evolving communities
14 i=i+1
gorithm 1. We begin by performing community detection
15 end
on the filtered network resulting from step 4, identifying
16 return C
the set C0 of communities. Then, at each iteration we ap-
ply an increasingly restrictive similarity threshold ti to Algorithm 1: Coordination-aware community de-
edge weights, thus removing certain edges and discon- tection.
nected nodes, and we repeat community detection on this
subnetwork Ge,v i . At each iteration, the community de- The main novelties of our approach with respect to pre-
tection algorithm is initialized with the set of communi- vious work, and particularly to (Pacheco et al. 2020), are
ties Ci−1 found at the previous iteration. This guarantees steps 4 and 5. In turn, our nuanced coordination detection
that the starting communities are kept, to a certain extent4 , approach also enables more in-depth analyses at step 6.
throughout all the process. As a result of the “moving”
threshold, we are able to study how the structure and the Surfacing coordination in 2019 UK GE
properties of coordinated communities change across the In the following, we describe how we implemented and ap-
whole spectrum of coordination. plied the aforementioned framework to uncover coordinated
6. Study coordinated communities. To study the structure behaviors on Twitter related to the 2019 UK GE. The con-
of coordinated communities and their patterns of coor- tent of this section roughly corresponds to steps 1 to 5 of
dination, we employ several network measures. In addi- our methodology, while step 6 (i.e., analysis of coordinated
communities) is described in the next section.
4 User similarity network. For our analysis, we posed our
Communities may still break or merge together, which we ac-
count for in our process. attention on the activity of superspreaders – coarsely de-
Figure 3: Edge weight distribution of the unfiltered and fil-
tered user similarity networks.
Finally, a user’s polarity is computed as the term-frequency
labour
weighted average of the polarities of the hashtags used by
conservative
that user.
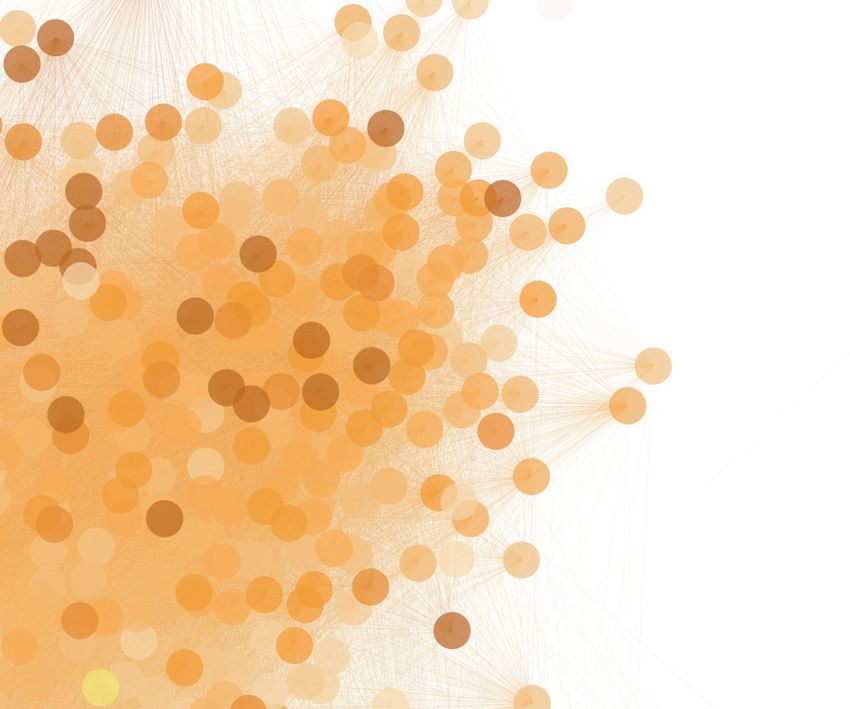
Figure 2: Filtered user similarity network of the 2019 UK Network interpretation. As shown in Figure 2, the user
GE. Colors encode user political leaning. similarity network presents a visible structure characterized
by several large communities and a few smaller ones. With
respect to political polarization, all users can be grouped into
3 main classes: labourists (red-colored), conservatives (blue-
fined as the most influential spreaders of information, in- colored), and neutral users (yellow-colored). We performed
cluding mis- and disinformation, in online social media (Pei a first sanity check by comparing structural properties of the
et al. 2014). Here, we defined superspreaders as the top 1% network with political ones. In particular, colors in the net-
of users that shared more retweets. This resulted in select- work appear to be clearly separated. In other words, commu-
ing for our analysis 10,782 users. Despite representing only nities derived from network structure appear to be extremely
the 1% of all users in the online electoral debate, super- politically homogeneous, and we do not have any cluster that
spreaders shared the 39% of all tweets and the 44.2% of contains users with markedly different colors. Moving for-
retweets. Thus, by focusing on them, we investigated the ward, the conservative cluster appears to be sharply sepa-
most prolific users and a considerable share of all mes- rated from the rest of the network, while the labourist and
sages. Next, we characterized each superspreader with a TF- neutral clusters are more intertwined with one another. This
IDF weighted vector of its retweeted tweet IDs. In other interesting property of our network closely resembles the
words, each user is modeled according to the tweets she political landscape in the UK ahead of the 2019 GE. In-
retweeted. The TF-IDF weight allows to reduce the rele- deed, one of the main topics of the debate was Brexit, which
vance of highly popular tweets in our dataset, and to empha- lead to a strong polarization between conservatives and all
size similarities that are due to retweets of unpopular tweets other parties (Schumacher 2019). In addition, the first-past-
– a much more suspicious behavior (Mazza et al. 2019; the-post UK voting system also motivated anti-Tory electors
Pacheco et al. 2020). Then, we computed user similarities to converge on the candidate of the party having the highest
as the cosine similarity of user vectors. Before studying the chances to defeat the conservative’s one in each constituency
network, we applied the technique proposed in (Serrano, – a strategy dubbed tactical voting5 . Our rich and informa-
Boguná, and Vespignani 2009) to retain only statistically- tive network clearly embeds and conveys these nuances.
relevant edges, thus obtaining the multiscale backbone of Coordinated communities. Building on these promising
our network, which we exploited for the remaining analy- preliminary results, we are now interested in a fine-grained
ses. The resulting filtered user similarity network contains analysis of the communities found in the user similarity net-
276,775 edges and is shown in Figure 2. In addition, Fig- work. In (Pacheco et al. 2020), this step was carried out by
ure 3 shows the distribution of edge weights in the filtered analyzing the connected components of their similarity net-
network. The filtering step preserved the rich, multiscale na- works. As anticipated, in order to be reasonably sure about
ture of the network. coordination, Pacheco et al. enforced very restrictive edge
Political leaning. In Figure 2, nodes are colored based weight filters, so as to only retain edges with very large
on their political leaning, as inferred from the hashtags that weights (e.g., users whose cosine similarity ≥ 0.9, on a 0
they used. In particular, we employed a label propagation to 1 scale). As a consequence of this aggressive filtering,
algorithm for assigning a polarity score to each hashtag in the networks were broken down into several disconnected
our dataset. The score for a given hashtag is inferred from
its co-occurrences with seeds of known polarity. We used the 5
https://www.theguardian.com/politics/2019/dec/08/tactical-
13 hashtags in Table 1 as the seeds for the label propagation. voting-guide-2019-keep-tories-out-remain-voter-general-election
LC H                                                                           CON LAB TVT SNP B60 ASE LCH
                                                                                                                                       more
                                                                                                                                       coord

                         SNP
                                                                            TVT
                                                                                                                                       less
                                                                                                                                       coord

                                                                                          B60

                                                                           ASE                    CO N
                          LAB

Figure 4: Coordinated communities found within the filtered user similarity network. Communities are color-coded. For each
color, intensity encodes the extent of coordination.

        (a)   CON.          (b)   LAB.          (c)   TVT.          (d)   SNP.          (e)   B60.             (f)        ASE.                 (g)   LCH.

      Figure 5: TF-IDF weighted hashtag clouds for the different coordinated communities. Hashtag polarity is color-coded.

components, hence the analysis of connected components.                     2.      LAB: Similarly, also the dense group of labour users
Instead, in our study the user similarity network features di-                   that we highlighted in Figure 2 has been identified as a
verse degrees of similarity and coordination, as testified by                    distinct community of labourists. These users are charac-
the distribution of edge weights in Figure 3. Therefore, we                      terized by hashtags supporting the party (votelabour), their
carried out this analysis by applying community detection,                       leader (jc4pm), and traditional labour flags like healthcare
and in particular the well-known Louvain algorithm (Blon-                        (saveournhs) and climate change (climatedebate). Notably, the
del et al. 2008). This step in our analysis corresponds to line                  absence of Brexit-related keywords seems to confirm the
1 of Algorithm 1. Detected communities (resolution = 1.5,                        alleged ambiguity of Jeremy Corbyn’s campaign on this
minimum size at t0 = 20) are outlined in Figure 4 and are                        topic6 .
briefly described in the following. Users exhibiting higher                 3.       TVT: The largest group of neutral users in Figure 2,
coordination with other users are assigned darker shades of                      tightly related to LAB users, was assigned to this com-
color. For each community we also computed its TF-IDF                            munity. These users debated topics related to liberal
weighted hashtag cloud, as shown in Figure 5, so as to high-                     democrats (votelibdem), anti-Tory (liarjohnson), anti-Brexit
light the debated topics.                                                        (stopbrexit) and to the campaigns promoting tactical voting
1.      CON: The community of conservative users that was                        (votetactically, tacticalvote).
     clearly visible in Figure 2 was also detected by our com-              4.     SNP: The remaining share of neutral users was assigned
     munity detection algorithm. It includes all major conser-                   to this community, related to the Scottish National Party
     vative users (e.g., @BorisJohnson and @Conservatives), and it               (SNP). The main hashtags used by members of this com-
     is characterized by a majority of hashtags supporting the
     conservative party (voteconservative), its leader (backboris) and         6
                                                                                 https://www.telegraph.co.uk/politics/2019/09/03/labours-
     Brexit (getbrexitdone).                                                policy-constructive-ambiguity-brexit-running-road/
munity support the party (votesnp) and ask for a new ref-
     erendum for the independence from the UK (indyref2020).
     The traditional hostility of SNP against Brexit and To-
     ries (Jackson et al. 2019) also explains the proximity of
     this cluster to the LAB and TVT ones.

5.       B60: This small cluster identifies activists involved
     in the so-called Backto60 initiative (backto60, 50swomen),
     which represents 4 million women born in the 1950s that
     are negatively affected by state pension age equalisation.
     Their instances have been addressed in the Labour mani-
     festo, while Conservatives denied their support to the ini-           Figure 6: Relationship between coordination and size of co-
     tiative despite Boris Johnson’s promises7 . The political             ordinated communities.
     connections of Backto60 activists are well reflected in our
     network, as represented by the B60 cluster being linked
     to both the LAB and TVT clusters.                                             Analysis of coordinated behaviors
                                                                           In previous work, once detected, coordinated communi-
6.       ASE: The tightly connected users in this cluster are              ties were visualized and manually inspected (Pacheco et al.
     all strongly leaning towards conservatives, as also clearly           2020). In other words, existing pipelines for automatically
     visible by their connections. However, their activities are           studying coordinated behaviors stop at the detection of co-
     mainly devoted towards attacking the Labour party and                 ordinated communities (step 5 in our framework), without
     its leader, rather than to support the Tories. As con-                providing insights into the patterns of coordination, which
     firmed from Figure 5f, some of the most relevant hash-                are left to human analysts. Contrarily, our multifaceted anal-
     tags of this cluster are against labours (labourlies, nevercorbyn)    ysis allows our framework to produce results for estimating
     and, in particular, are about the antisemitism allegations            the extent and for investigating the patterns of coordination.
     (labourantisemitism, votelabourvoteracism) that held the stage dur-      Visual inspection. Regarding the extent of coordination,
     ing the entire electoral campaign8 .                                  a visual inspection of Figure 4 already reveals interesting
                                                                           insights. For instance, large communities such as LAB and
7.      LCH: Finally, the last cluster is again composed of ac-            CON are simultaneously characterized by a multitude of
     tivists, similarly to the B60 cluster. This time activists            weakly-coordinated users (light-colored) and by a smaller
     were protesting against “loan charge”, a tax charge in-               core of strongly-coordinated ones (dark-colored). Instead,
     troduced to contrast a form of tax avoidance based on                 other communities only feature either weakly- or strongly-
     disguised remunerations. Anti-loan charge campaigners                 coordinated behaviors. For example, the SNP and TVT com-
     claim that it is a retrospective taxation that, due to the ab-        munities appear to be characterized by mildly-coordinated
     normally long period of application, caused involved peo-             behaviors, with only a few strongly-coordinated users that
     ple to return unsustainable amounts, also inducing several            are spread out in the network and not clustered together.
     suicides9 .                                                           On the opposite, the small communities of activists (B60,
                                                                           LCH and ASE) appear to be almost completely characterized
The analysis of the communities detected in our user simi-
                                                                           by strongly-coordinated behaviors, as represented by small,
larity network allowed to identify both large clusters, each
                                                                           compact, and dark-colored clusters.
corresponding to one of the major political forces involved
in the election, as well as much smaller ones. The small clus-                Network measures. In the following, we formalize these
ters are related to highly organized activists (B60, LCH) and              intuitions, and we propose a set of network measures for
political campaigns (ASE). The previous analysis provided                  quantifying them. By applying steps 5 and 6 of our frame-
some first results into the presence of coordinated behaviors              work, we are able to produce these results automatically for
in the 2019 UK GE and, in particular, it allowed to uncover                each uncovered coordinated community. In particular, the
groups that featured at least a small degree of coordination.              while-loop in Algorithm 1 repeatedly performs community
However, since our network embeds different degrees of co-                 detection on subnetworks obtained by iteratively removing
ordination among its users, it still does not provide results              edges (and the resulting disconnected nodes) based on their
towards the extent of such coordination and the patterns of                weight. We begin by removing weak edges, and we pro-
coordination that characterize such groups. These crucial                  ceed with stronger ones until we have removed all edges and
points are tackled in the next section.                                    nodes in the network. Since edge weight is a proxy for coor-
                                                                           dination, each subnetwork that we obtain with this process
                                                                           features a different degree of coordination. By studying the
     7
     https://pensionsage.com/pa/Backto60-granted-leave-to-                 evolution of coordinated communities throughout this sim-
appeal.php                                                                 ulation, we are able to characterize their patterns of coordi-
   8
     https://www.thetimes.co.uk/article/revealed-the-depth-of-             nation. In the following, we present results for each coordi-
labour-anti-semitism-bb57h9pdz                                             nated community in terms of standard network measures, as
   9                                                                       a function of coordination. Our measure of coordination is
     https://www.gov.uk/government/publications/disguised-
remuneration-independent-loan-charge-review/guidance                       the percentile rank of edge weights in the filtered network –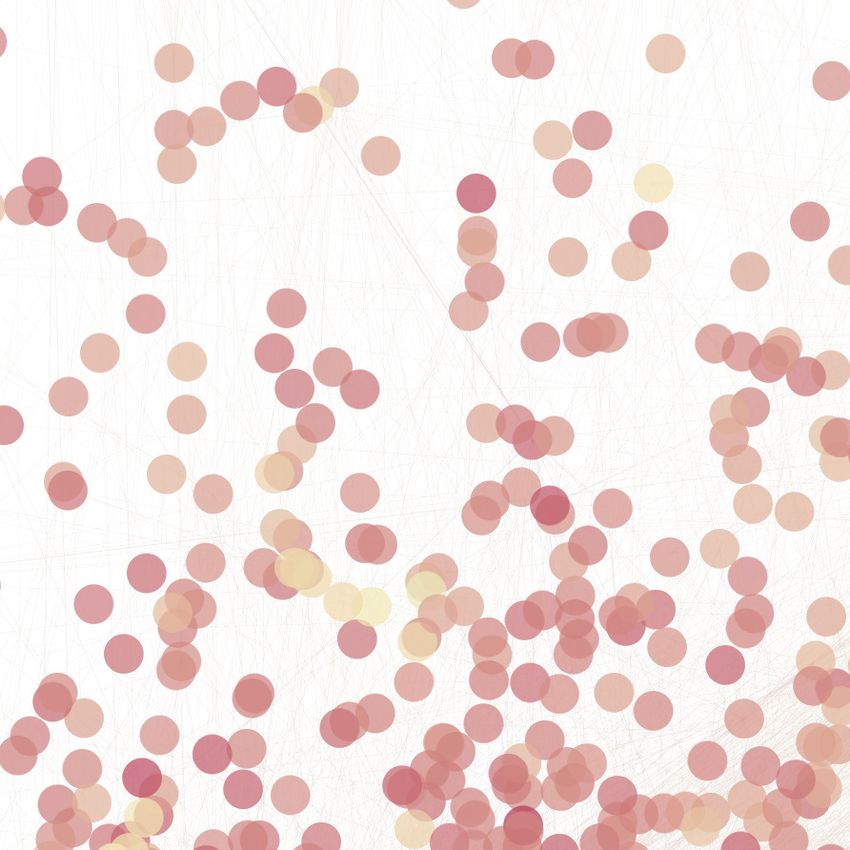
(a) Density.                           (b) Clustering coefficient.                       (c) Assortativity.

Figure 7: Network measures computed for each coordinated community, as a function of the extent of coordination. By studying
the whole extent of coordination among users, we are able to highlight the radically different patterns of coordination that
characterize different communities, as highlighted by opposite trends in given network measures.

that is, the percentile rank of the distribution shown in Fig-         plying that the most coordinated users in that community
ure 3. Percentile rank is the proportion of values in a distri-        are likely not colluded nor organized between themselves.
bution that a particular value is ≥ to. For example, a given           On the contrary, the most coordinated members of B60 are
result measured for a degree of coordination = 0.9, means              likely well-organized together, as shown by the density spike
that the result was obtained from a network that includes              observed when coordination ≥ 0.8. Clustering coefficient,
only the top-10% of strongest edges.                                   shown in Figure 7b, provides similar results with respect to
   The first aspect we consider is the size of coordinated             density. In fact, it shows decreasing trends for SNP, LCH
communities. Figure 6 shows how the number and the per-                and TVT, as well as rising trends for CON and LAB and, to
centage of nodes in each coordinated community changes,                a much greater extent, for B60. Trends in density and clus-
as a function of coordination. This analysis quantifies the            tering coefficient confirm that coordination ' 0.9 appears to
observations we previously derived by visual inspection.               be a representative value for LCH.
It clearly shows that some communities are characterized                  Finally, we evaluate the assortativity of coordinated net-
by stronger coordination than others. This is reflected by             works. Here, assortativity measures the extent to which
the plateaux that strongly-coordinated communities, such as            nodes with high degree are connected to other nodes
LCH and ASE, exhibit until some large values of coordina-              with high degree, and vice versa. Again, different patterns
tion. On the contrary, communities such as B60, LAB and                emerge. In particular, some coordinated communities (e.g.,
TVT exhibit a marked decreasing trend throughout all the               ASE and LAB) are moderately disassortative. This result rep-
spectrum of coordination. This analysis is also useful to-             resents a situation where a few nodes with high degree are
wards estimating a characteristic value of coordination for a          connected to many nodes with low degree, realizing a net-
given community. For instance, by using the elbow method,              work structure that is similar to a star. In turn, this high-
the LCH community could be described by a coordination                 lights a pattern of coordination characterized by a few hubs
value ' 0.9, since the vast majority of its members fea-               that are supported by many less important nodes – a pat-
ture a degree of coordination ≥ than that. Similarly, the ASE          tern that was already found to be informative when study-
community could be characterized by a coordination value               ing online manipulations (Nizzoli et al. 2020). Conversely,
' 0.55. These results also imply that, in general, each com-           the B60 community appears to be strongly assortative, es-
munity has its own characteristic value of coordination, and           pecially when considering coordination in the region of 0.8.
that methods that applying the same arbitrary fixed thresh-            This finding represents a situation where many similar nodes
old to all communities risk neglecting and erasing relevant            are connected to each other, reinforcing the idea of a clique
patterns.                                                              of coordinated peers. By combining all results shown in Fig-
   Next, we evaluate structural properties of coordinated              ure 7, the B60 community appears to be well-described by
communities. Density is a measure of the fraction of the ac-           a coordination value ' 0.8.
tual connections between nodes in a network, with respect to              Themes and narratives. Until now we have only lever-
all possible connections. This aspect is helpful towards as-           aged network measures to characterize coordinated commu-
sessing whether the most coordinated users are all linked to           nities. However, their content production can also reveal in-
one another, or whether they act in different regions of their         teresting insights into their preferred narratives. Here, we
community. Results shown in Figure 7a highlight interest-              propose and briefly experiment with a text-based analysis
ing patterns. First of all, some communities are overall more          that can be used to investigate the activity of coordinated
clustered than others, such as ASE and LCH. This is another            groups. In particular, we are interested in highlighting the
indicator of strongly-coordinated behaviors. Then, we have             differences in the content produced by the coordinated users
rising and decreasing density trends. In detail, SNP exhibits          in a community, with respect to all other – less coordi-
a negative correlation between density and coordination, im-           nated – users of that community. One way to reach our goal
(a) Mean Botometer scores.        (b) Suspended accounts.

                                                               Figure 9: Relationship between coordination and use of au-
          (a)   B60.                    (b)   LCH.             tomation. As shown, these appear to be two orthogonal and
                                                               largely uncorrelated concepts.
Figure 8: Application of word shift graphs for highlighting
narratives that characterize coordinated communities.
                                                               still debated10 . For these reasons, we compared our assess-
                                                               ments on coordination with the automation score provided
                                                               by Botometer (Yang et al. 2019). We used the maximum of
is by exploiting word shift graphs (Gallagher et al. 2020),    Botometer’s English and universal scores, both provided in
which allow comparing two corpora by highlighting those        the [0, 1] range, as our automation score. In addition, we also
terms that mostly contribute to differentiate them. We ap-     considered Twitter suspensions as an indicator of possible
ply word shift graphs in our context by selecting all tweets   automation or inauthenticity. Then, similarly to our previ-
shared by members of a community as the reference corpus,      ous analyses, we reported the mean automation scores and
and all tweets shared by strongly-coordinated users in that    the percentage of suspended users for the different coordi-
community as the comparison corpus. Meaningful strongly-       nated communities, as a function of coordination. Figure 9
coordinated users from a community can be picked by lever-     shows the results of this analysis. Automation appears to be
aging results of our previous network-based analyses. For      almost completely uncorrelated with coordination. Indepen-
instance, the B60 community can be assigned a coordina-        dently of coordination, results do not show meaningful dif-
tion value ' 0.8 while LCH can be characterized by co-         ferences between our communities, with the sole exception
ordination ' 0.9. Thus, in Figure 8 we highlight content       of LCH for which we measured overall higher automation
production differences between all users in B60 and LCH,       scores. Other communities are more affected by Twitter sus-
with respect to the users in those communities whose co-       pensions, such as both clusters of conservative users (CON
ordination ≥ 0.8 and 0.9, respectively. In figures, words      and ASE). Interestingly, we notice a marked downward trend
are ranked based on their contribution towards differentiat-   of suspensions for the B60 group, which might indicate an
ing coordinated and non-coordinated users. Yellow-colored      authentic, strongly-coordinated grassroots initiative.
words (right-hand side of each word shift graph) are in-          Overall, our results confirm that coordination and automa-
formative for coordinated users while blue-colored words       tion are two different and orthogonal concepts. On the one
(left-hand side) are informative for non-coordinated users.    hand, this suggests that using automation and bot detection
The informativeness of the different words towards char-       to study CIB might be ineffective and leading to inaccurate
acterizing coordinated users (i.e., their shift) is computed   results. On the other hand, it motivates to complement exist-
by means of Shannon entropy (Gallagher et al. 2020). As        ing analyses on IOs with new results that are based on the
shown, this analysis reveals that coordinated users embrace    study of coordinated behaviors.
much more specific narratives and themes with respect to
non-coordinated users. In fact, while both B60 and LCH                                 Conclusions
are characterized by generic labourist topics, coordinated
users in those communities fight for 50s women’s rights and    We addressed the problem of uncovering coordinated be-
against the loan charge tax.                                   haviors in social media. We proposed a new network-based
                                                               framework and we applied it for studying coordinated be-
   Use of automation. As a last experiment on coordi-          haviors in the 2019 UK General Election (GE). Our work
nated behavior, we are interested in evaluating the rela-      has both theoretical and practical implications.
tionship between coordination and use of automation. De-          From the theoretical standpoint of fighting IOs and CIB,
tection of automation (e.g., social bots) has been a matter    our framework goes beyond a binary definition of coordi-
of study for years, and has been one of the most widely        nated vs uncoordinated behaviors, and it allows to investi-
used approaches for investigating online deception and ma-     gate the whole spectrum of coordination. We reach this goal
nipulation (Cresci 2020). Many bot detection techniques        via an improved network filtering and a coordination-aware
have been proposed (Chavoshi, Hamooni, and Mueen 2016;
Varol et al. 2017; Cresci et al. 2018; Mazza et al. 2019),       10
                                                                    https://blog.twitter.com/en us/topics/company/2020/bot-or-
but their effectiveness towards tracking IOs and CIB is        not.html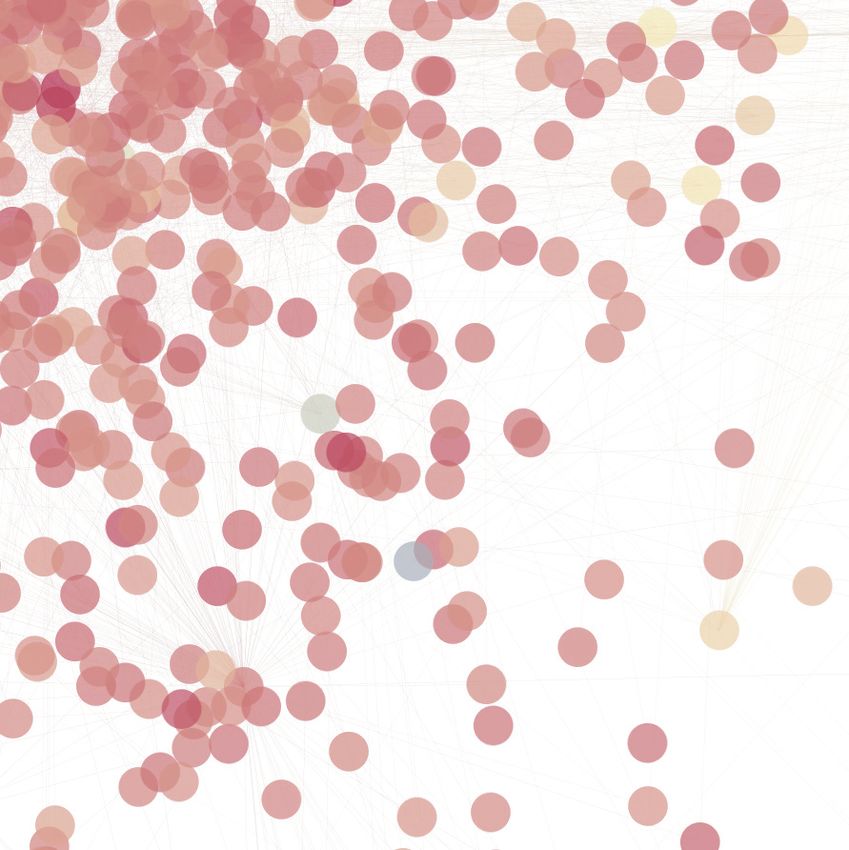
community detection process. Our nuanced approach allows                Giglietto, F.; Righetti, N.; Rossi, L.; and Marino, G. 2020a. Co-
to uncover different patterns of coordination. We demon-                ordinated link sharing behavior as a signal to surface sources of
strate that a certain extent of coordination is present in ev-          problematic information on facebook. In SMSociety’20.
ery online community, but that not all coordinated groups               Giglietto, F.; Righetti, N.; Rossi, L.; and Marino, G. 2020b. It takes
are equally interesting. Furthermore, while previous works              a village to manipulate the media: coordinated link sharing behav-
blindly applied fixed coordination thresholds to whole net-             ior during 2018 and 2019 italian elections. Information, Commu-
works, our approach allows to estimate the degree of coordi-            nication & Society 1–25.
nation that characterizes each different community, opening             Jackson, D.; Thorsen, E.; Lilleker, D.; and Weidhase, N. 2019. UK
up more accurate and fine-grained downstream analyses.                  Election Analysis 2019: Media, Voters and the Campaign. Techni-
   From the practical standpoint, we created and shared a               cal report, Bournemouth University.
Twitter dataset for the 2019 UK GE. Despite smaller num-                Keller, F. B.; Schoch, D.; Stier, S.; and Yang, J. 2020. Political
bers, we found that conservatives were overall more coor-               astroturfing on twitter: How to coordinate a disinformation cam-
dinated than labourists, and that they also featured a higher           paign. Political Communication 37(2):256–280.
degree of automation and Twitter suspensions. However, the              Mazza, M.; Cresci, S.; Avvenuti, M.; Quattrociocchi, W.; and
communities with the largest degree of coordination were                Tesconi, M. 2019. RTbust: Exploiting temporal patterns for botnet
not supporters of the main parties, but rather small groups of          detection on Twitter. In ACM WebSci’19. ACM.
activists and political antagonists.                                    Nizzoli, L.; Tardelli, S.; Avvenuti, M.; Cresci, S.; Tesconi, M.; and
   In summary, our work goes in the direction of embracing              Ferrara, E. 2020. Charting the landscape of online cryptocurrency
the growing complexity of important phenomena such as on-               manipulation. IEEE Access 8:113230–113245.
line deception and manipulation. Doing so would allow us                Pacheco, D.; Hui, P.-M.; Torres-Lugo, C.; Truong, B. T.; Flammini,
to come up with better models of our complex reality, which             A.; and Menczer, F. 2020. Uncovering coordinated networks on
would give us higher chances of providing accurate and reli-            social media. arXiv preprint arXiv:2001.05658.
able results. Despite still not being able to distinguish inau-         Pacheco, D.; Flammini, A.; and Menczer, F. 2020. Unveiling coor-
thentic coordinated behaviors from authentic ones, our work             dinated groups behind white helmets disinformation. In WWW’20
                                                                        Companion.
makes a step forward in this direction by providing more
nuanced and more accurate results.                                      Pei, S.; Muchnik, L.; Andrade Jr, J. S.; Zheng, Z.; and Makse, H. A.
                                                                        2014. Searching for superspreaders of information in real-world
                                                                        social media. Scientific reports 4:5547.
                          References
                                                                        Ratkiewicz, J.; Conover, M. D.; Meiss, M.; Gonçalves, B.; Flam-
Assenmacher, D.; Adam, L.; Trautmann, H.; and Grimme, C.                mini, A.; and Menczer, F. M. 2011. Detecting and tracking political
2020a. Semi-automatic campaign detection by means of text               abuse in social media. In AAAI ICWSM’11.
stream clustering. In AAAI FLAIRS’20.
                                                                        Schumacher, S. 2019. Brexit divides the UK, but partisanship
Assenmacher, D.; Clever, L.; Pohl, J. S.; Trautmann, H.; and            and ideology are still key factors. Technical report, Pew Research
Grimme, C. 2020b. A two-phase framework for detecting ma-               Center.
nipulation campaigns in social media. In SCSM’20.
                                                                        Serrano, M. Á.; Boguná, M.; and Vespignani, A. 2009. Extracting
Barrett, P. M. 2019. Disinformation and the 2020 Election: How          the multiscale backbone of complex weighted networks. PNAS
the social media industry should prepare. White paper. Center for       106(16).
Business and Human Rights, New York University.
                                                                        Starbird, K.; Arif, A.; and Wilson, T. 2019. Disinformation as
Blondel, V. D.; Guillaume, J.-L.; Lambiotte, R.; and Lefebvre, E.       Collaborative Work: Surfacing the Participatory Nature of Strategic
2008. Fast unfolding of communities in large networks. Journal of       Information Operations. In ACM CSCW’19.
statistical mechanics: theory and experiment 2008(10):P10008.
                                                                        Starbird, K. 2019. Disinformation’s spread: bots, trolls and all of
Boneh, D.; Grotto, A. J.; McDaniel, P.; and Papernot, N. 2019.          us. Nature 571:449–449.
How relevant is the Turing test in the age of sophisbots? IEEE
Security & Privacy 17(6):64–71.                                         Tumminello, M.; Micciche, S.; Lillo, F.; Piilo, J.; and Mantegna,
                                                                        R. N. 2011. Statistically validated networks in bipartite complex
Chavoshi, N.; Hamooni, H.; and Mueen, A. 2016. DeBot: Twitter           systems. PloS one 6(3):e17994.
bot detection via warped correlation. In IEEE ICDM’16.
                                                                        Vargas, L.; Emami, P.; and Traynor, P. 2020. On the detection
Cresci, S.; Di Pietro, R.; Petrocchi, M.; Spognardi, A.; and Tesconi,   of disinformation campaign activity with network analysis. arXiv
M. 2018. Social Fingerprinting: Detection of Spambot Groups             preprint arXiv:2005.13466.
Through DNA-Inspired Behavioral Modeling. IEEE TDSC 15(4).
                                                                        Varol, O.; Ferrara, E.; Davis, C. A.; Menczer, F.; and Flammini, A.
Cresci, S. 2020. A decade of social bot detection. CACM 63(10).         2017. Online human-bot interactions: Detection, estimation, and
Fazil, M., and Abulaish, M. 2020. A socialbots analysis-driven          characterization. In AAAI ICWSM’17.
graph-based approach for identifying coordinated campaigns in           Yang, K.-C.; Varol, O.; Davis, C. A.; Ferrara, E.; Flammini, A.; and
Twitter. Journal of Intelligent & Fuzzy Systems 38:2961–2977.           Menczer, F. 2019. Arming the public with artificial intelligence to
Gallagher, R. J.; Frank, M. R.; Mitchell, L.; Schwartz, A. J.; Rea-     counter social bots. Human Behavior and Emerging Technologies
gan, A. J.; Danforth, C. M.; and Dodds, P. S. 2020. Generalized         1(1).
word shift graphs: A method for visualizing and explaining pair-        Zellers, R.; Holtzman, A.; Rashkin, H.; Bisk, Y.; Farhadi, A.; Roes-
wise comparisons between texts. arXiv preprint arXiv:2008.02250.        ner, F.; and Choi, Y. 2019. Defending against neural fake news. In
Garlaschelli, D., and Loffredo, M. I. 2008. Maximum likelihood:         NeurIPS’19.
Extracting unbiased information from complex networks. Physical
Review E 78(1):015101.
You can also read