Coronagraphic Observations of Si X λ14301 and Fe XIII λ10747 Linearly Polarized Spectra Using the SOLARC Telescope
←
→
Page content transcription
If your browser does not render page correctly, please read the page content below
The Astrophysical Journal, 877:144 (10pp), 2019 June 1 https://doi.org/10.3847/1538-4357/ab1cb7
© 2019. The American Astronomical Society. All rights reserved.
Coronagraphic Observations of Si X λ14301 and Fe XIII λ10747 Linearly Polarized
Spectra Using the SOLARC Telescope
1
1
Gabriel I. Dima , Jeffrey R. Kuhn2 , and Thomas A. Schad1
National Solar Observatory, 22 Ohi‘a Ku St., Pukalani, HI 96768, USA; gdima@hawaii.edu
2
Institute for Astronomy, University of Hawaii, 34 Ohi‘a Ku St., Pukalani, HI 96768, USA
Received 2019 March 19; revised 2019 April 22; accepted 2019 April 24; published 2019 June 5
Abstract
The forbidden Si X emission line at 14301 Å has been identified as a potentially valuable polarized diagnostic for
solar coronal magnetic fields; however, the only polarized Si X measurements achieved to date have been during
eclipses and at comparatively low spatial and spectral resolution. Here we report spectropolarimetric observations
of both the Si X 14301 Å and more well-established Fe XIII 10747 Å coronal lines acquired with the 0.45 m
aperture SOLARC coronagraph atop Haleakalā. Using its fiber-based integral field spectropolarimeter, we derive
observations sampled at radial intervals of 0.05 R☉(i.e., ∼50″) with a spectral resolving power of ≈36,000.
Results for both lines, which represent averages over different active and nonactive regions of the corona, indicate
a relatively flat radial variation for the line widths and line centers and a factor of ≈2–3 decrease in polarized
brightness between 1.05 and 1.45 R☉. Averaging over all the measurements the mean and standard deviations of
line properties for Si X 14301 Å and Fe XIII 10747 Å are, respectively, FWHM of 3.0±0.4 Å and 1.6±0.1 Å,
line-integrated polarized brightness of 0.07±0.03 and 0.3±0.3 erg s−2 cm−2 sr−1, where the uncertainty quoted
reflects a large sample variance, and line center wavelengths 14300.7±0.2 Å and 10746.3±0.1 Å. The polarized
brightness for both lines may be underestimated by up to a factor of 5 due to limitations in the photometric
calibration. When accounting for this uncertainty we find consistency between our observations and previous
measurements of the two lines as well as theoretical calculations and affirm the potential of the Si X line as a
polarized diagnostic of the solar corona.
Key words: Sun: corona – Sun: infrared
1. Introduction effect is sensitive to the line-of-sight component of the
magnetic field intensity with the Zeeman splitting to Doppler
Polarimetric observations of infrared (IR) magnetic-dipole
(M1) emission lines provide a promising method for remote width ratio proportionally larger for forbidden lines at longer
sensing the magnetic field dictating the evolution of the solar wavelengths. Still, the weak nature of the coronal magnetic
corona (Judge 1998). Among the relatively few IR lines field and the line intensities makes measurements of the
available, the Si X 14301 Å line (2s2 2p 2P1/2–2s2 2p 2P3/2, circular polarization with sufficient signal-to-noise difficult.
referred to as Si1430 hereafter) is one of the brightest and is Harvey (1969) derived upper limits for the line-of-sight coronal
potentially an important magnetic field diagnostic. Spectro- magnetic field using the Zeeman effect in circularly polarized
scopic observations of Si1430, primarily of active regions measurements of the Fe XIV 5304 Å. More recently, the circular
obtained during solar eclipses (Münch et al. 1967; Olsen polarization of the Fe1075 line has been successfully measured
et al. 1971; Kuhn et al. 1996; Dima et al. 2018) or with and used to infer the coronal magnetic field intensity via the
coronagraphic techniques (Penn & Kuhn 1994), report that the Zeeman Effect (Lin et al. 2000, 2004). Meanwhile, despite a
Si1430 line intensity is typically within a few factors of the lack of measurements, Si1430 is expected to be one of the three
bright routinely observed Fe XIII 10747 Å line, hereafter most sensitive lines for coronal Zeeman magnetometry (Judge
Fe1075 (see, e.g., Tomczyk et al. 2007, 2008). Model et al. 2001), the other two being Fe1075 and the Si IX 39346 Å
calculations of coronal line intensities are generally consistent line. As a result, both the DL-NIRSP and Cryo-NIRSP
with the observations and further suggest that the Si1430 and instruments, two of the first light instruments of the upcoming
Fe1075 lines have similar brightness in the off-limb quiet National Science Foundation’s Daniel K. Inouye Solar
corona whose peak emission measure occurs near 1.4 MK (Del Telescope (DKIST, Rimmele et al. 2015) will provide
Zanna & DeLuca 2018). Under ionization equilibrium condi- spectropolarimetric observations of the Fe1075 and Si1430
tions, the temperature of peak ionization fraction for Si X is lines, with Cryo-NIRSP extending observations into the
approximately 1.4 MK, slightly lower than that of Fe XIII (i.e., infrared to measure Si IX 39346 Å.
1.7 MK) although the contribution functions of each line The M1 emission lines may also be linearly polarized. When
overlap significantly (Del Zanna et al. 2015). As for all the upper magnetic sublevels of a transition are significantly
forbidden IR lines, the Si1430 intensity is also sensitive to the influenced by photoexcitation, linear polarization is generated
coronal electron density and, for lower coronal densities, by resonant scattering of the anisotropic photospheric radiation
photoexcitation by the solar photospheric radiation field. field. Long-lived upper levels imply the Hanle effect is fully
The value of the infrared coronal emission lines for magnetic saturated in the corona; therefore, the linear polarization angle
field diagnostics results from the amplitude of their magneti- only constrains the direction of the magnetic field in the plane
cally sensitive polarized signals (see the review by Judge et al. of the sky. Meanwhile, the degree of linear polarization
2013). Circularly polarized emission generated by the Zeeman depends on the balance of collisional and radiative excitation
1
The Astrophysical Journal, 877:144 (10pp), 2019 June 1 Dima, Kuhn, & Schad
for a given level and subsequently depends on the electron polarization state of the incoming beam. The field of view for a
temperature and density as well as the field geometry and single pointing of the telescope is defined by the 16×4 optical
illumination conditions (Judge 2007). As discussed in Judge fiber bundle and its lenslet array. Each 250 μm fiber/lenslet
et al. (2006), the Si1430 line is expected to have polarized subtends a region ≈24″ in diameter; the full bundle samples an
behavior similar to the Fe1075 line, which is one of the most area of ≈0.4×0.1 R☉ for a single pointing. All 64 fibers are
strongly linearly polarized coronal lines. Both lines can be reconfigured into a linear array which forms the entrance slit to a
directly populated by photoexcitation from the ground state. near-Littrow configuration diffraction-grating-based spectrograph.
Furthermore, the numerical factor W2(Jl, Ju) (see Li et al. 2017) Light exiting each fiber is collimated by a 900 mm focal length off-
for the Si1430 upper level, which is proportional to the allowed axis parabolic mirror and directed to a 79 line/mm (63°. 5 blaze
fractional polarization, is 0.5 (comparable to 1 for Fe1075). To angle) echelle grating. The dispersed beam is then refocused by the
date, the only observation of the Si1430 linear polarization is same off-axis parabola through an order-sorting filter and onto an
from Dima et al. (2018), who used eclipse observations with LN2 cooled 256×256 Rockwell NICMOS HgCdTe infrared
very coarse spatial resolution (∼8 5, i.e., 0.5 R☉]) and low array with 40 μm pixel pitch (Swindle 2014). This corresponds to a
spectral resolution (R∼1000). Those measurements reported spectral pixel width of 0.116 and 0.144 Å and observed
unexpectedly high linearly polarized fractions of up to 7%. wavelength range of 29.7 Å and 36.9 Å for Si1430 and Fe1075
This paper reports new measurements of the linearly respectively. The fiber-to-fiber separation is approximately 4
polarized spectra of Si1430 using the higher spatial and pixels. The resolving power of the spectrograph, as estimated by
spectral resolving power of the Scatter-free Observatory for comparing the observed width of photospheric lines to a solar atlas,
Limb, Active Regions and Coronae (SOLARC; Kuhn et al. is approximately 36,000 for each line. Si1430 and Fe1075 are
2003). Such measurements are critical for establishing Si1430 observed at separate times and require a switch of filter, rotation of
as a polarized coronal diagnostic as well as for benchmarking the grating, separate precalibrated voltages for the LCVRs, and
atomic models used in calculating its polarization. Here we refocusing.
characterize the radial dependence of the Si1430 linearly
polarized amplitude, the spectral line width, and the Doppler
2.2. Data Acquisition and Calibration
velocity, and we further make comparisons with measurements
of Fe1075 obtained with the same instrument. One limitation of Polarimetric data were acquired with a four-state modulation
this study is that we only accurately measure the polarized scheme that sequentially measures the I+Q, I–Q, I+U, and I–U
intensity and not the total line intensity; therefore, we must polarized states. Final modulated images were obtained by
carefully interpret these measurements in light of numerous cycling through the modulation sequence and coadding
previous measurements of the total line intensity. To our exposures inside four file buffers. Each individual coronal
knowledge, this is the first coronagraphic detection of the exposure was 3 s. For Si1430, between 50 and 100 modulation
Si1430 linear polarization. cycles (i.e., 200–400 exposures; 10–20 minutes total integra-
tion time) per pointing were generally required to measure a
polarized signal at 3σlevel. Due to filter transmission and line
2. Observations
brightness differences, only 20 modulation cycles (4 minutes)
SOLARC spectropolarimetric observations of Si1430 and were required for Fe1075. Unilluminated dark exposures for
Fe1075 were obtained on seven individual days between 2016 detector calibrations were obtained throughout the day at the
March 31 and 2016 July 28 as represented in Figures 1 and 2 as same exposure times as the observations. Flat-field and
boxes superimposed on 193 Å images from Solar Dynamics photometric calibration data were acquired prior to and after
Observatory’s Atmospheric Imaging Assembly (SDO/AIA; science observations by pointing to solar disk center. To reduce
Lemen et al. 2012). The 193 Å channel is typically dominated the disk flux to a level measurable by the detector, we used
by emission from Fe XII for nonflaring regions and has a 0.05 s exposure times as well as a circular aperture stop with a
characteristic temperature of 1.3 MK (O’Dwyer et al. 2010; Del diameter of ≈1.3 cm placed at the telescope entrance pupil.
Zanna et al. 2011). In total, we measured Si1430 in 31 discrete This strategy allowed a fair calibration of the photometric
instrument pointings (see the discussion below) sampling intensities (see further discussion below); however, the
different portions of the active and quiet corona though only 18 illumination changes incident on the optical fibers as
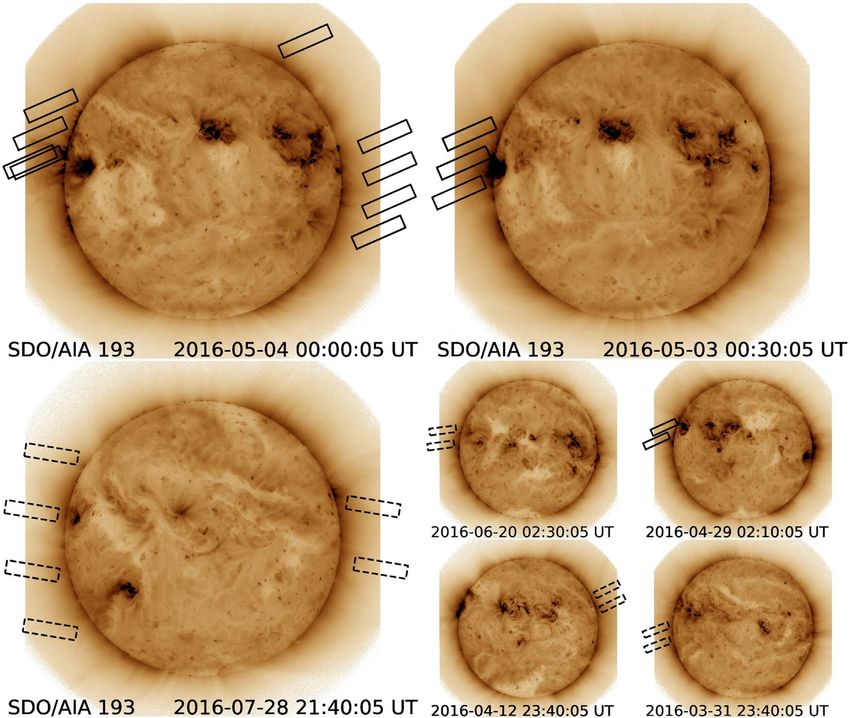
measurements are fully photometrically calibrated. For Fe1075, introduced by the aperture significantly altered the character
we obtain 16 discrete pointings all with full photometric of spectral interference fringes observed in the data. As a result,
calibration. this data failed to adequately flat-field the observed spectra.
Consequently, we treat the polarized data using only differ-
ential photometric techniques, meaning we do not have a
2.1. Instrumentation
calibrated measurement of the total intensity spectra.
SOLARC is an unobscured off-axis 0.46 m coronagraph located We also obtained similar calibration observations at disk
at 10,000 feet in elevation on Haleakalā Maui, HI, adjacent to center using a narrow ≈0.2 cm annular aperture with inner
where DKIST is under construction. This site frequently provides diameter ≈37.8 cm. However, in post-processing, we learned
excellent coronal observing conditions as well as reduced telluric that the ratio between the average annular and circular
absorption in the water bands near the Si1430 line. SOLARC uses aperture intensities was 15%–40% less than that expected by
a circular field stop at the telescope prime focus to occult the solar the ratio of the aperture areas and also showed variations
disk. Our measurements use an optical fiber bundle imaging across the fiber bundle. This is likely due to the fast focal ratio
spectropolarimeter, similar to Lin et al. (2004), installed down- of the beam incident on the lenslet array, which can result in
stream of a demagnifying lens near the telescope Gregorian focus. the overfilling of the fiber core and a lower relative
Ahead of the fiber bundle are two liquid crystal variable retarders transmission of rays in the outer portion of the entrance
(LCVRs) and a wire grid polarizer used to modulate the pupil. We found the effect to be fairly constant day-to-day and
2The Astrophysical Journal, 877:144 (10pp), 2019 June 1 Dima, Kuhn, & Schad
Figure 1. Targeted locations (rectangular boxes) of the SOLARC fiber bundle observations of the Si X 14301 Å line superimposed on SDO/AIA 193 Å images from
the day of observation. Timestamps correspond to the SDO/AIA image; the SOLARC observations span 19:00–02:30 UTC on a given day. The dashed boxes
represent measurements for which photometric calibration is unavailable. In the absence of simultaneous narrowband high spatial resolution images the error in
pointing is on the order of the width of an optical fiber (∼24″).
calibrated intensities are very likely underestimated by a
factor between 2 and 5.
2.3. Data Reduction
The final coadded science data are first dark calibrated by
subtracting an average dark exposure. Stokes I images are then
calculated by averaging all four modulation states, and Q and U
images were calculated by subtracting the I+Q and I–Q (I+U
and I–U) images and dividing by 2. No flat-field correction is
applied. Each fiber’s spectra is then individually extracted by
averaging over three detector rows adjacent to the brightest
pixel in each column for each fiber so to account for a small
misalignment between the spectral dispersion axis and the
detector rows (∼0.3 pixels across 256 pixels.) The wavelength
axis is determined by cross-correlating our measured spectrum
with a high resolution solar atlas spectrum that we first
convolve with a Gaussian to match our spectrograph’s
resolving power. Photometric calibration was performed using
the reduced aperture disk center observations. Due to the
Figure 2. Same as Figure 1 for the Fe XIII 10747 Å observations. increase in fringing with the reduced aperture, the disk center
continuum flux in detector units for each spectrum is defined as
to effect both the Fe1075 and Si1403 channels similarly. In an average of the signal over the same wavelength pixels as the
our data reduction discussed below, only the circular aperture emission lines, which is then scaled by the different exposure
data is used for photometric calibration. Consequently, our times and aperture areas. The signal at each wavelength in the
3The Astrophysical Journal, 877:144 (10pp), 2019 June 1 Dima, Kuhn, & Schad
coronal spectra at the emission line is then divided by the
measured disk center continuum and scaled according
to reference spectral radiance values near the lines: 1.0×10⁶
and 0.5×10⁶ erg s−2 cm−1 sr−1 Å−1 for the Fe1075 and
Si1430 lines respectively (Cox 2000).
2.3.1. Fringe Removal
The calculated Stokes spectra included interference fringes
introduced by the instrument with a period of ≈1 and 0.5 Å for
Si1430 and Fe1075, respectively. As the coronal emission lines are
typically characterized by Gaussian profiles with FWHM≈3.1
and ≈1.65 Å, i.e., more than three fringe periods, we are able to
use normal Fourier techniques to isolate the fringe signal from the
true signal. We find that a simple notch Fourier filter centered on
the fringe frequency removes the fringes without adversely
affecting the coronal emission line shape.
2.3.2. Intensity to Polarization Crosstalk Correction
Residual instrumental polarization manifests most strongly
as crosstalk between the total intensity and the polarized Figure 3. (Top) Distributions of continuum polarized fractions with respect to
spectra in our measured spectra. To remove this crosstalk, we the measured total continuum intensity near the Fe XIII 10747 Å line. These
numbers coincide with the errors in the coronal line polarization assuming the
apply a method similar to that of Sanchez Almeida & Lites continuum is not polarized. (Bottom) Distributions of continuum plus
(1992) but adapted to the coronal case, which involves multiple background intensity near the Si X 14301 Å and Fe XIII 10747 Å lines. As
source components as well as a polarized continuum. The discussed in the text these intensities may be underestimated by up to a factor
measured Stokes spectra [Im, Qm, Um], neglecting telluric of 5 due to the photometric calibration uncertainty.
absorption, can be written as
Im (l) » I (l) = IE (l) + IK + IB (l) , (1 ) method by Sanchez Almeida & Lites (1992) where the continuum
Q m (l) » Q E (l) + Q K + k IQ Im (l) , (2 ) is assumed to be unpolarized, and therefore kIQ » kIQ cal
=
Qm (l C) Im (l C) averaged over a portion of the continuum. It
Um (l) » UE (l) + UK + k IU Im (l) , (3 )
can be shown that the error in the measured coronal line
where the true intensity I is the addition of the emissive coronal polarization due to this approximation is
line intensity IE, the scattered coronal continuum IK (dominated in
this case by the spectrally flat K-corona), and the scattered light -QK - qK
DQ E = Q Ecal - Q E = IE = IE , (6 )
IK + IB
background intensity IB, which consists of circumsolar unpolarized
photospheric light scattered from the Earth’s atmosphere and/or (I
1 + IB
K
)
the SOLARC telescope optics. The coronal line and continuum
emission have Q-polarization, QE and QK, respectively, while the where qk is the fractional Q-polarization of the coronal
background intensity is assumed to be unpolarized. The correction continuum IK. Typically, IKThe Astrophysical Journal, 877:144 (10pp), 2019 June 1 Dima, Kuhn, & Schad
Figure 4. Calibrated polarized spectra of the Si X 14301 Å line (left) and Fe XIII 10747 Å (right) observed at different times on the east limb on 2016 May 3. The top
panels show the arrangement of the fiber entrances on the sky with numbers denoting the order of the fiber exits on the detector measured from the bottom of the array.
Dashed lines indicate constant radial contours in a heliocentric coordinate system. The SOLARC field stop edge is between 1 and 1.05 R☉. Fibers colored in red are
averaged and fitted in the lower left panels with Gaussian functions (solid red lines). The panels on the right show the aligned extracted spectra. Fiber numbers
correspond to the numbers in the top panels. Each subplot shows the crosstalk and photometrically calibrated I, Q, and U spectra. Note that no flat-field correction is
applied to Stokes I and the photometric calibration may be underestimating the values by a factor of 2–5.
we expect the continuum values for QK and UK to be insufficient to satisfy a 3σdetection threshold. We study
comparable. Therefore, we expect the uncertainty in Si1430 below the radial dependence of the polarized spectra without
polarization due to the crosstalk correction ΔQSi/ISi and taking into account the smaller scale structure of an individual
ΔUSi/ISi to be about 1.5 times larger than for Fe1075 and pointing or differences in targets. Therefore, in our analysis, we
likely smaller than 0.5%. The discrepancy between the errors improve the S/N by averaging the data into radial bins of
calculated using the two methods is consistent with an 0.05 R☉. As can be seen in the top panel of Figure 4 the number
underestimation of the background levels due to the photo- of fibers in each radial bin is a function of the relative
metric calibration by a factor between 2 and 5. orientation of the telescope field of view and the Sun. For
In summary, the scattered Si I 10749 Å photospheric line was consistency we apply the same binning to Fe1075 observations.
used to remove the crosstalk for the Fe1075 observations, while For each binned spectra, we then perform a least-squares fit to
for Si1430 we removed the crosstalk by assuming the the Q and U profiles simultaneously with Gaussian functions
continuum is unpolarized. All Q and U spectra analyzed below constrained to have the same central wavelength and line width
have had the intensity crosstalk removed through subtraction of but varying amplitudes. Example fits are shown in Figure 4.
kIQ Im and kIU Im using the derived values on a spectra-by-
spectra basis. 3.1. Linear Polarization Direction
An important test of the reliability of the data analysis can be
3. Results
performed by comparing the measured angle of linear
Fully calibrated polarized spectra of both Si1430 and Fe1075 polarization for the emission lines with respect to the local
acquired on 2016 May 3 in approximately the same coronal solar radial direction. The angle of polarization is simply given
region but separated by ∼2 hr are shown in Figure 4. For the by q = 0.5 arctan (U Q). Since both Fe1075 and Si1430 are
Fe1075 spectra, the polarized continuum on either side of the forbidden emission lines and the corona is not dominated by
line is fit with a first-order polynomial and subtracted. For this largely inclined fields, their linearly polarized orientation
observation, Q and U polarization in both lines is observed should primarily be distributed about the radial direction with
strongly across the entire optical fiber bundle field of view and the majority of values below the Van Vleck angle of 54°. 7 (Van
the angle of polarization denoted by the signs of the Q and U Vleck 1925). The Van Vleck angle is defined between the
polarization is consistent between the two lines. However, for exciting radiation axis and the magnetic field direction. Since
most Si1430 pointings, the signal-to-noise ratio (S/N) in the solar radial direction coincides with the radiation axis of
individual fibers for the coronal line center intensity is symmetry the dominant polarized orientation tends to be
5The Astrophysical Journal, 877:144 (10pp), 2019 June 1 Dima, Kuhn, & Schad
3.2. Line Widths
The measured full width at half maximum (FWHM) of the
fitted Q and U profiles for both the Fe1075 and Si1430 lines are
shown as a function of radial position in the left half of
Figure 6. The values reported here have been corrected for
instrumental broadening (wi) by subtracting wi2 from the
measured FWHM2. For SOLARC, we determined wi=0.3 Å
near Fe1075 by comparing the width of the photospheric Si I
10749 Å line to a high resolution atlas spectrum, giving a
spectrograph dispersion of R=λ/wi≈36,000. While we do
not measure the resolving power at 14301 Å, given the
spectrograph design, the resolving power is approximately
constant; therefore, for Si1430 we estimate wi∼0.4 Å. For
both lines the instrumental broadening is only a small fraction
of the line width compared to the Doppler broadening due to
thermal and nonthermal velocities.
Figure 5. Distributions of polarized angle directions with respect to the local We measure, on average, that both line widths remain
solar vertical direction. The top panel shows the entire sample of measure- relatively constant between 1.05 and 1.45 R☉. The mean value
ments. The inset defines schematically the acute angle Δpol between the
polarized direction of the line (solid line) and the local solar radial direction
and standard deviations for the FWHM over all measurements
(dashed line), which points toward disk center. The bottom panel shows a are 3.0±0.4 Å and 1.6±0.1 Å for the Si1430 and Fe1075
restricted sample of observations of the two lines taken on the same day and lines respectively. Penn & Kuhn (1994) reported FWHM
pointings at approximately the same coronal coordinates but separated by measurements for both Si1430 and Fe1075 derived from
several hours. Chosen bin widths of 5° reflect the average uncertainty in the nonpolarized spectra acquired over two days and within a
measured polarized angles for the lines.
single active region at a radial distance of 1.1R☉. Their values
(1.4 and 1.48 Å for Fe1075; 1.96 and 2.89 Å for Si1403) are
skewed toward radial. This is not an absolute rule and for
slightly below our measurements but still fall within our
certain magnetic field inclinations and observing geometries, observed ranges.
the linear polarization orientation of forbidden lines can be Singh et al. (2006) obtained slit-based spectrometric
tangential to the solar limb (e.g., see Figure 6 in Gibson et al. observations of the Fe1075 line scanning coronal regions
2016). However, at these high inclinations the polarized 500″×500″ on the E and W limbs of the Sun on six separate
fractions decrease significantly and are practically more days between 2003 September 14 and 2003 October 16. Their
difficult to measure. Arnaud & Newkirk (1987) produced a observations were taken at ≈5″ spatial resolution and showed
similar distributions of angles from many months of synoptic very weakly varying FHWM for the Fe1075 line between 1 and
observations of the Fe1075 line showing a strong preference 1.4 R☉. They report FWHM gradient fits to data in 100″ radial
for radial orientations. segments. Averaging all regions and days together for each
In Figure 5 distributions of the angle between the polarized segment shows mean FHWM gradients between −0.21±0.26
orientation and the local solar radial direction are shown. and 0.18±0.07 mÅ arcsec−1 over 0″−400″. These gradients
Observations for both lines fall within 40°. 0 of the local radial are shown in Figure 6 offset by 2 Å since Singh et al. (2006)
direction indicating no obvious bias in the measurements. The only report the absolute FWHM values for a single coronal
differences between the distributions in the top panel of region, whereas the gradient averages are reported over many
Figure 5 is likely due to the different sampled regions for the regions and days. The reported absolute FHWM values for the
samples of measurements. When restricting the sample of single observing region are on average ≈2 Å so over 3σ above
measurements for both lines to observations taken on 2016 the mean of our observations. Singh et al. (2003) reported
May 3 and pointing at the same coronal regions the two average line widths for Fe1075 around 1.9±0.1 Å over
distributions are more similar. However, the observations are several days of observation in 1997–1998. The offsets may be
due to a real difference in thermodynamic conditions in the
taken several hours apart so coronal rotation and evolution,
observed coronal regions and the distribution of line widths
pointing uncertainty, and measurement uncertainty all con-
measured in the corona by CoMP are consistent with the range
tribute to the differences observed in the reduced sample. The of values discussed here (Tomczyk et al. 2007).
majority of the Si1430 observations removed from the sample Emission line widths hold information about the thermal and
have low values for Δpol. This may be because the observations nonthermal motions of the emitting plasma and provide
on 2016 May 3 are dominated by the large active region near important diagnostics for coronal heating mechanisms. Follow-
the E limb, while the remaining days are observations taken in ing, e.g., Del Zanna & Mason (2018) an optically thin emission
more background coronal structures, which tend to be more line has a measured FWHM given by
radial. However, the Van Vleck effect makes this interpretation
ambiguous since nearly horizontal magnetic fields would show ⎛ l ⎞2 ⎛ 2k T ⎞
FWHM = wi2 + 4ln2 ⎜ 0 ⎟ ⎜ B i + vnt2 ⎟ , (7 )
the same polarized direction as nearly radial magnetic fields. ⎝ c ⎠ ⎝ Mi ⎠
Furthermore, limitations in pointing and the need to average
over large coronal regions to increase S/N complicate where wi is the instrumental broadening, λ0 is the peak rest
morphological interpretations of active regions based on the wavelength, c is the speed of light, kB is the Boltzmann
present observations. constant, Ti and Mi are the ion temperature and mass, and vnt is
6The Astrophysical Journal, 877:144 (10pp), 2019 June 1 Dima, Kuhn, & Schad
Figure 6. (Left) Radial variation of FWHM for Si X 14301 Å (upper panels) and Fe XIII 10747 Å (lower panels). The boxes represent the upper and lower quartiles
with the whiskers extending out to cover the entire span of measurements in each radial bin. The orange bars represent the median value of the measurements. Gray
boxes represent mean 68% confidence intervals (2σ) for the Gaussian line fits for observations in each radial bin. Attached on the right are panels showing the
distribution of the measurements with line widths with bin sizes equal to the mean 1σ Gaussian fit uncertainty. (Right) Same as left for the variation of the Doppler
shifts relative to the mean central wavelength for Si X 14301 Å (upper panels) and Fe XIII 10747 Å (lower panels).
the nonthermal velocity. Using Equation (7) and assuming the Studies of Doppler shifts in the corona are typically made in
ion temperatures for Si X and Fe XIII coincide with the peak the low corona at the corona/transition region boundary.
ionization fraction temperatures of 1.4 and 1.7 MK, we Observations at disk center indicate that cooler emission lines
estimate nonthermal velocities to be vnt=24±8 km s−1 and that formed below 1 MK tend to show redshifts up to
15±4 km s−1, respectively. This result is comparable to the 10 km s−1, while hotter lines formed above 1 MK like Mg X
typical nonthermal broadening reported in the transition region 625 Å and Fe XII 1349 Å show blueshifts up to 10 km s−1
(Sandlin et al. 1977; Peter & Judge 1999). However, Doppler
and corona of 18 km s−1 (Del Zanna & Mason 2018).
shifts for both types of lines are observed to decrease to near
zero at the limb. On disk observations of resolved active region
loops showed Doppler shifts as large as 15 km s−1 (Xie et al.
3.3. Line Centers 2017). It is possible that during dynamic events like flares and
Determining the central wavelength of the Si1430 line is coronal mass ejections the Doppler shifts for coronal lines
relevant to future observations because the line is approxi- observed above the limb to exceed the velocities reported here
mately centered inside a narrow (6 Å ≈126 km s−1 wide) and Doppler shift the Si1430 emission line further into the
atmospheric transmission band. In Figure 6 we show the spread atmospheric absorption bands. For Si1430 it can be shown that
in measured Doppler shifts for the two lines. Each observation even for Doppler shifts as large as ±30 km s−1 the line profile
was corrected for solar rotation by subtracting the linear is largely unaffected by typical atmospheric absorption bands
velocity calculated for the center of each measurement bin present near the summit of Haleakalā.
using the average coronal rotation curves reported by
Antonucci & Dodero (1977). Doppler shifts due to the Earth’s 3.4. Polarized Brightness
spin and orbital motion are less than 0.7 km s−1 for all our Polarized brightness and polarized fraction are defined as
observations and were neglected. Errors in the wavelength
calibration are no larger than one pixel width, which PB = Q2 + U 2, (8 )
corresponds to ≈3 km s−1 for both lines. It is noticeable that PB
Si1430 shows much larger spread (standard deviation fpol = , (9 )
5 km s−1) at all radii than Fe1075 (standard deviation of I
3 km s−1). This effect is likely due to larger measurement errors where I, Q, and U represent the wavelength integrated line
associated with Si1430 due to the lower S/N compared to the radiances. Figure 7 shows the radial variation of the measured
Fe1075 line. Part of the noise is due to random photon noise polarized brightness for the photometrically calibrated observa-
and part of it is due to systematic residual fringing in the tions. Our polarized brightness observations of the Fe1075 line
polarized spectra with periods comparable to the line widths. are on average a factor of 3 smaller at all radii than average
The average line center wavelength measured for Si1430 is radial measurements of the line reported by Arnaud & Newkirk
λmean=14300.7±0.2 Å. This is consistent with the values
(1987) between 1977 October and 1980 October. One
reported by Penn & Kuhn (1994; λ0 = 14300.84 ± 0.06 Å),
interpretation of this result is that the average intensity of the
Olsen et al. (1971; 14310 ± 10 Å), and Münch et al. (1967;
14305 ± 4 Å). For Fe1075 we measured λmean= 10746.3± Fe1075 line has decreased between 1978 and 2016 when our
0.1 Å, which is consistent with Penn & Kuhn (1994; observations were obtained due to variation in the phase of
λ0 = 10746.17 ± 0.05 Å). Lyot (1939) reported a rest wave- the solar cycle. Their observations were obtained during the
length of 10746.80±0.15 Å for the Fe1075 line. However, as ascending phase of cycle 21 while we observed close to the end
discussed by Penn & Kuhn (1994) the discrepancy can be of cycle 24. Arnaud & Newkirk (1987) do report an increase in
explained by a 1% error in the plate scale used by Lyot. mean emission line radiances for Fe1075 by a factor of 1.3 and
7The Astrophysical Journal, 877:144 (10pp), 2019 June 1 Dima, Kuhn, & Schad
Figure 7. Upper panels show the wavelength integrated line polarized brightness (PB) variation with radius for Si X 14301 Å and Fe XIII 10747 Å. Open boxes
represent the upper and lower quartiles of the data in each radial bin with an orange line indicating the median. Whiskers show the full span of the measurements in
each bin. Gray boxes represent mean 68% confidence intervals (2σ) for the Gaussian line fits for observations in each radial bin. Middle panels show inferred line
radiances assuming polarized fractions fpol=1%–10% and multiplied by a correction factor of 3 to account for lost throughput in the fibers as discussed in the text.
The solid black line shows the median value in each bin with the vertical bars indicating the full range of measurements assuming fpol=4%. Lower panels are
analogous to the middle panels but show inferred line center intensity values normalized to disk center units assuming polarized fractions fpol=1%–10%. Previous
calibrated measurements of the two emission lines are shown for comparison (Münch et al. 1967; Olsen et al. 1971; Arnaud & Newkirk 1987; Penn & Kuhn 1994;
Kuhn et al. 1996) together with theoretical radiances from Judge (1998) and Del Zanna & DeLuca (2018).
a factor of 3 for Fe XIV 5303 Å between the years 1977 report average linearly polarized measurements of Fe1075 between
and 1980. radii 1.1–1.4 R☉ with fpol≈5%–10%. Low spatial resolution
Alternatively, given the uncertainty in our photometric observations (≈0.5 R☉) of Si1430 obtained around the solar limb
calibration, it is not unreasonable that we are underestimating during the 2006 total solar eclipse showed on average
the polarized brightness measurements by a factor of 3. fpol=7±4% (Dima et al. 2018). We also scale the measured
Studying the discrepancy in throughput when observing the polarized brightness for both lines by a factor of 3 so that the
disk center with the annular and circular apertures we do not Fe1075 measurements agree with those by Arnaud & Newkirk
see a difference when observing near the Fe1075 or Si1430 (1987). Assuming this correction factor it can be seen that our
spectral regions. Assuming that our average polarized bright- measurements paint a more consistent picture with previous
ness measurements for Fe1075 are similar to those reported by intensity observations for both lines (Figure 7). For polarized
Arnaud & Newkirk (1987) and that the correction factor is the fractions around 4% for Si1430 we note agreement with previous
same for both lines we can estimate the corrected polarized intensity measurements within the scatter of the measurements.
brightness for Si1430 to be on average three times larger These polarized fractions also agree with the values for Si1430
as well. measured during the 2006 total eclipse and reported by Dima et al.
Due to the flat-field issues discussed above, the line intensities (2018).
are not measured. Instead we infer total line radiances from the Measurement errors are dominated by the background signal
measured polarized brightness by using Equation (9) and assuming rather than the line intensity. Errors for Fe1075 are on average
a range of possible fractions, i.e., fpol=1%–10%. The choice of larger than for Si1430 because of the smaller number of
values for the polarized fractions is motivated by previous coadded exposures and larger background levels. Radial bins at
observations of the Fe1075 and Si1430 lines. Drawing from low radii also tend to average over fewer fibers thus having
measurements taken over several years, Arnaud & Newkirk (1987) slightly lower noise.
8The Astrophysical Journal, 877:144 (10pp), 2019 June 1 Dima, Kuhn, & Schad
4. Discussion an understanding of emission line widths requires observation
of multiple lines from the same region.
Using SOLARC and its imaging spectropolarimeter, we
The DKIST first light instruments include two near-IR
have reported new measurements of the linearly polarized
spectropolarimeters that will observe the Si1430 and Fe1075
spectra of the Si X 14301 Å coronal line and compared them to lines: the Diffraction Limited Near Infrared Spectropolarimeter
observations of Fe XIII 10747 Å. As discussed in the Introduc- (DL-NIRSP, Elmore et al. 2014) and the Cryogenic Near Infra-
tion, the Si X line is a prime target for coronal magnetic field Red Spectro-Polarimeter (Cryo-NIRSP, Fehlmann et al. 2016).
measurements. On average, our measurements have shown that DL-NIRSP is an integral field fiber-based spectropolarimeter
the polarized brightness for both lines decreases slowly with that can observe both Fe1075 and Si1430 simultaneously. As
radius. From Equation (9) the polarized brightness can be discussed by Plowman (2014) full Stokes simultaneous
written as the product between fpol and the total intensity of line measurements of two coronal forbidden lines have enough
I. The parameter fpol is a function of the atomic alignment of the information to recover all three components of the magnetic
upper level of the transition (Casini & Judge 1999). The atomic field for certain magnetic field orientations. DL-NIRSP will
alignment in turn is a function of the anisotropy of the exciting also simultaneously measure the He I 10830 Å and Si1430 line
radiation (function of height), the amount of photoexcitation for pair, which may provide a diagnostic for the vector magnetic
the line, the magnetic field orientation, electron density, and to field based on the Hanle effect and scattering linear polarization
a smaller degree temperature (Judge et al. 2006). On average (Dima et al. 2016). While DL-NIRSP emphasizes simultaneity,
electron density decreases with height while radiation aniso- Cryo-NIRSP is designed for coronal observing with a larger
tropy increases leading to an increase in fpol with radius. This is FOV and higher throughput. Cryo-NIRSP will combine a slit-
not necessarily true at high spatial resolutions since, for based spectropolarimeter that can observe the Si1430 and
example, an overdense tall coronal loop might have a lower fpol Fe1075 serially, with a narrowband polarimetric context imager
than a neighboring coronal region that is not overdense. The that offers some possibility for simultaneous multiline
orientation of the magnetic field relative to the local radiation observations. The physical context of the observations being
axis of symmetry, which is often taken to coincide with the made will determine how to define simultaneity. Some coronal
local radial direction, influences fpol, with inclined fields structures will persist unchanged over longer periods of time
decreasing the polarized fraction compared to more radial field while others will change much faster. Having multiple
orientations. On large spatial averages the corona tends to be instruments capable of polarimetric observations of the IR
more radial and the polarized emission tends to also be lines will provide redundancy and flexibility to future DKIST
dominated by emission from radially oriented regions. All these observations.
factors support an average increase with radius of fpol. This is
consistent with average observations of the Fe1075 line The National Solar Observatory (NSO) is operated by the
reported by Arnaud & Newkirk (1987) that show polarized Association of Universities for Research in Astronomy, Inc.
fractions increasing to 10% by 1.4 R☉. However, even as fpol (AURA), under cooperative agreement with the Nation Science
increases, the average photoexcited line intensity decreases Foundation. We gratefully acknowledge support from the NSF
since the photospheric radiation field becomes diluted. Because through grant No. ATM-1358270. The SDO data are provided
Si1430 and Fe1075 are both excited from the ground level of courtesy of NASA/SDO and the AIA, EVE, and HMI science
the ions we expect the lines to show a similar behavior with teams.
increasing radius. However, other coronal emission lines with
different photoexcitation rates will produce different radial ORCID iDs
profiles. Gabriel I. Dima https://orcid.org/0000-0002-6003-4646
Observations of transition region and coronal emission lines Jeffrey R. Kuhn https://orcid.org/0000-0003-1361-9104
show excess (nonthermal) broadening of the order 18 km s−1 Thomas A. Schad https://orcid.org/0000-0002-7451-9804
(see the review by Del Zanna & Mason 2018). A unified
interpretation of these excesses has not been fully reached and References
may involve different scenarios depending on where the excess
is observed and whether it evolves with radius. While some Antonucci, E., & Dodero, M. A. 1977, SoPh, 53, 179
studies show emission line excesses decreasing with radius in Arnaud, J., & Newkirk, G. J. 1987, A&A, 178, 263
Casini, R., & Judge, P. G. 1999, ApJ, 522, 524
polar coronal holes (Hahn & Savin 2013) others report no Cox, A. N. 2000, Allenʼs Astrophysical Quantities (New York: AIP Press)
variation or mixed evolution in observations near the equator Del Zanna, G., & DeLuca, E. E. 2018, ApJ, 852, 52
(Singh et al. 2006). Our observations average many pointings Del Zanna, G., Dere, K. P., Young, P. R., Landi, E., & Mason, H. E. 2015,
over large coronal regions away from the polar coronal holes A&A, 582, A56
Del Zanna, G., & Mason, H. E. 2018, LRSP, 15, 5
and do not show a systematic evolution with radius for either of Del Zanna, G., O’Dwyer, B., & Mason, H. E. 2011, A&A, 535, A46
the two lines. Interpreting the thermal and nonthermal Dima, G., Kuhn, J., & Berdyugina, S. 2016, FrASS, 3, 13
contributions to the line width involves making assumptions Dima, G. I., Kuhn, J. R., Mickey, D., & Downs, C. 2018, ApJ, 852, 23
about the temperature of the ions being equal to the temperature Elmore, D. F., Rimmele, T., Casini, R., et al. 2014, Proc. SPIE, 9147, 914707
Fehlmann, A., Giebink, C., Kuhn, J. R., et al. 2016, Proc. SPIE, 9908, 99084D
of the electrons. This effectively holds the thermal width Gibson, S., Kucera, T., White, S., et al. 2016, FrASS, 3, 8
constant with radius and line changes are associated to changes Hahn, M., & Savin, D. W. 2013, ApJ, 776, 78
in nonthermal motions due to Alfvén wave damping. Seely Harvey, J. W. 1969, PhD thesis, National Solar Observatory
et al. (1997) used simultaneous observations of emission lines Judge, P. G. 1998, ApJ, 500, 1009
Judge, P. G. 2007, ApJ, 662, 677
from multiple elements formed at different temperatures to Judge, P. G., Casini, R., Tomczyk, S., Edwards, D. P., & Francis, E. 2001,
show that excess widths can also be explained by higher ion Coronal Magnetometry: A Feasibility Study, Tech. Rep. NCAR/TN-
temperatures with smaller nonthermal velocities. It is clear that 466-STR
9The Astrophysical Journal, 877:144 (10pp), 2019 June 1 Dima, Kuhn, & Schad
Judge, P. G., Habbal, S., & Landi, E. 2013, SoPh, 288, 467 Peter, H., & Judge, P. G. 1999, ApJ, 522, 1148
Judge, P. G., Low, B. C., & Casini, R. 2006, ApJ, 651, 1229 Plowman, J. 2014, ApJ, 792, 23
Kuhn, J. R., Coulter, R., Lin, H., & Mickey, D. L. 2003, Proc. SPIE, Rimmele, T., McMullin, J., Warner, M., et al. 2015, IAUGA, 29, 2255176
4853, 318 Sanchez Almeida, J., & Lites, B. W. 1992, ApJ, 398, 359
Kuhn, J. R., Penn, M. J., & Mann, I. 1996, ApJL, 456, L67 Sandlin, G. D., Brueckner, G. E., & Tousey, R. 1977, ApJ, 214, 898
Lemen, J. R., Title, A. M., Akin, D. J., et al. 2012, SoPh, 275, 17 Seely, J. F., Feldman, U., Schühle, U., et al. 1997, ApJL, 484, L87
Li, H., Landi Degl’Innocenti, E., & Qu, Z. 2017, ApJ, 838, 69 Singh, J., Ichimoto, K., Sakurai, T., & Muneer, S. 2003, ApJ, 585, 516
Lin, H., Kuhn, J. R., & Coulter, R. 2004, ApJL, 613, L177 Singh, J., Sakurai, T., Ichimoto, K., Muneer, S., & Raveendran, A. V. 2006,
Lin, H., Penn, M. J., & Tomczyk, S. 2000, ApJL, 541, L83 SoPh, 236, 245
Lyot, B. 1939, MNRAS, 99, 580 Swindle, T. R. 2014, PhD thesis, Univ. Hawai’i
Münch, G., Neugebauer, G., & McCammon, D. 1967, ApJ, 149, 681 Tomczyk, S., Card, G. L., Darnell, T., et al. 2008, SoPh, 247, 411
O’Dwyer, B., Del Zanna, G., Mason, H. E., Weber, M. A., & Tripathi, D. 2010, Tomczyk, S., McIntosh, S. W., Keil, S. L., et al. 2007, Sci, 317, 1192
A&A, 521, A21 van de Hulst, H. C. 1950, BAN, 11, 135
Olsen, K. H., Anderson, C. R., & Stewart, J. N. 1971, SoPh, 21, 360 Van Vleck, J. H. 1925, PNAS, 11, 612
Penn, M. J., & Kuhn, J. R. 1994, ApJ, 434, 807 Xie, H., Madjarska, M. S., Li, B., et al. 2017, ApJ, 842, 38
10You can also read