High-Efficiency "Green" Quantum Dot Solar Cells
←
→
Page content transcription
If your browser does not render page correctly, please read the page content below
Article
pubs.acs.org/JACS
High-Efficiency “Green” Quantum Dot Solar Cells
Zhenxiao Pan,† Iván Mora-Seró,‡ Qing Shen,§,¶ Hua Zhang,† Yan Li,† Ke Zhao,† Jin Wang,†
Xinhua Zhong,*,† and Juan Bisquert‡,∥
†
Key Laboratory for Advanced Materials, Institute of Applied Chemistry, East China University of Science and Technology, Shanghai
200237, China
‡
Photovoltaic and Optoelectronic Devices Group, Department de Física, Universitat Jaume I, 12071 Castelló, Spain
§
Department of Engineering Science, the University of Electro-Communications, 1-4-1 Chofugaoka, Chofu, Tokyo 182-8585, Japan
¶
CREST, Japan Science and Technology Agency (JST), 4-1-8 Honcho, Kawaguchi, Saitama 332-0012, Japan
∥
Department of Chemistry, Faculty of Science, King Abdulaziz University, Jeddah, Saudi Arabia
*
S Supporting Information
ABSTRACT: Semiconductor quantum dots (QDs) are
extremely interesting materials for the development of
photovoltaic devices, but currently the present the drawback
is that the most efficient devices have been prepared with toxic
heavy metals of Cd or Pb. Solar cells based on “green” QDs
totally free of Cd or Pbpresent a modest efficiency of 2.52%.
Herein we achieve effective surface passivation of the ternary
CuInS2 (CIS) QDs that provides high photovoltaic quality
core/shell CIS/ZnS (CIS-Z) QDs, leading to the development
of high-efficiency green QD solar cells that surpass the
performance of those based on the toxic cadmium and lead
chalcogenides QDs. Using wide absorption range QDs, CIS-Z-
based quantum dot sensitized solar cell (QDSC) configuration
with high QD loading and with the benefit of the recombination reduction with type-I core/shell structure, we boost the power
conversion efficiency of Cd- and Pb-free QDSC to a record of 7.04% (with certified efficiency of 6.66%) under AM 1.5G one sun
irradiation. This efficiency is the best performance to date for QDSCs and also demonstrates that it is possible to obtain
comparable or even better photovoltaic performance from green CIS QDs to the toxic cadmium and lead chalcogenides QDs.
■ INTRODUCTION
Low-cost photovoltaic technology is an effective way to solve
TiO2,16−19 hybrid-sensitization with use of CdS, CdSe,18−25 or
alloying with Se, etc.,26,27 have been devoted to enhance the
fossil fuel exhaustion and global warming concern.1,2 Quantum photovoltaic performance of CIS-based QDSCs, but some of
dot (QD) solar cells are attracting increasing scientific and these strategies are not compatible with green solar cells since
industrial interests as a promising low-cost candidate for the not totally Cd-free devices are produced. Regretfully, the appeal
third-generation solar cell due to band gap tunability, high of CIS QD sensitizer is counterbalanced by the mean
absorption coefficient, and solution processability.3−8 Further- performance of the resulting cell devices with reported best
more, multiple exciton generation phenomenon and extraction PCE of 5.3%,15 but using CdS passivation. Slightly higher
of hot electrons have the potential to be harnessed for the efficiencies of 5.5%, 5.1% certified, have been obtained for
theoretical power conversion efficiency (PCE) of these cells to CuInSeS QDs also with CdS passivation.27 These efficiencies
surpass the Shockley−Queisser limit (31%).9−11 Currently, QD lag significantly behind those of Cd-containing QD-based
solar cells are mainly focused on highly toxic cadmium and lead QDSCs (6−7%)30−32 or Pb-based depleted heterojunction QD
chalcogenides,3−8,12−14 which make the future commercial solar cells (7−8%).33,34 Furthermore, the highly toxic element
application doubtful based on health and environmental issues. cadmium is still used in almost all CIS-based QDSCs with
In this sense, the development of a “green” alternative based on relatively high PCE.20−27 In the case of Cd-free, the reported
Cd- and Pb-free devices is extremely interesting. best PCE is only 2.52%.16,17,28,29 Therefore, developing Cd-,
CuInS2 (CIS) QDs are an attractive less-toxic alternative to Pb-free CIS-based QDSC with good performance is critical for
Cd- or Pb-based QDs with high absorption coefficient (∼105 their commercial application and also becomes a great
cm−1) and near-optimal bulk band gap energy (1.5 eV).15 CIS challenge.
QDs have been used in the quantum dot sensitized solar cell
(QDSC) configuration.16−29 Recently great efforts, such as Received: April 30, 2014
introducing interfacial buffer layer between QD sensitizer and Published: May 30, 2014
© 2014 American Chemical Society 9203 dx.doi.org/10.1021/ja504310w | J. Am. Chem. Soc. 2014, 136, 9203−9210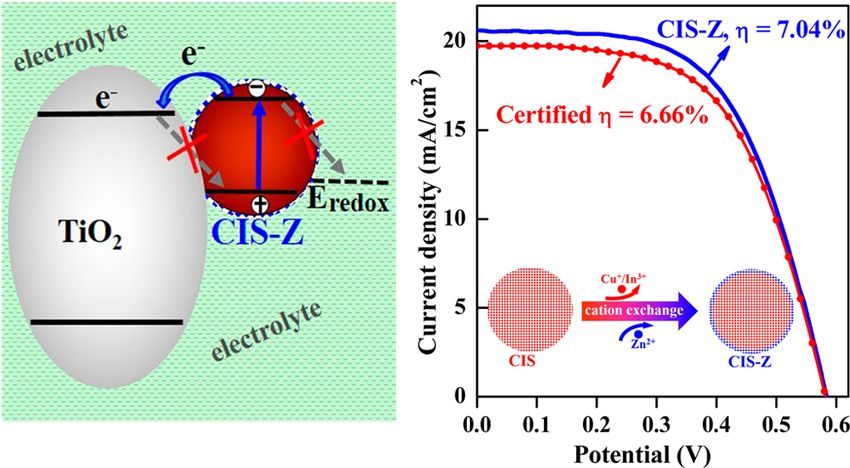
Journal of the American Chemical Society                                                                                                              Article

   The relatively poor performance of QDSCs, especially the                  In(OAc)3 (0.1 mmol) were loaded in a flask containing 2.0 mL
CIS based ones, is at least partially due to the existence of trap-          of OAm and 4.0 mL of ODE. The resulting mixture solution
state defects in QD sensitizers, which induce both internal                  was subsequently heated to 180 °C under argon flow, and then
charge carrier recombination inside QDs (before carrier                      0.4 mmol of sulfur dissolved in 0.4 mL of OAm was injected
injection into the transporting media) and photoexcited                      into the reaction system and stayed for 20 min. The purified
electron recombination from metal oxide matrix to QD                         CIS QDs were obtained by precipitation and centrifugation
sensitizer (after carrier injection), and therefore lower PCE of             procedure with use of acetone. The purified CIS QDs were
the resulting cell device.35−38 Due to the high surface atom                 dispersed in 2.0 mL of OAm and 4.0 mL of ODE and degassed
ratio and relatively low synthetic temperature, surface trapping             under vacuum at 40 °C for 20 min. For synthesis of CIS-Z QDs
defect is common in colloidal QDs,39 and the situation is more               with 0.7 monolayer of ZnS shell, the above solution was then
severe for ternary CIS in comparison with binary II−VI QDs                   heated to 100 °C and 0.04 mmol of Zn(OAc)2 stock solution
since ternary nanocrystals tolerate a large range of non-                    (obtained by dissolving 0.44 g of Zn(OAc)2 in 1.6 mL of OAm
stoichiometric compositions and their more complex crystal                   and 18.4 mLof ODE) was injected into the reaction system and
structure leads to a significant density of donor and acceptor                kept at this temperature for 30 min to employ the cation
trap states located in the band gap.40 The overgrowth of a wider             exchange procedure. After precipitation and centrifugation
band gap inorganic shell (in particular ZnS) around QDs to                   procedure, purified CIS-Z QDs are obtained. The ZnS
form type-I core/shell structure is a well-established approach              thickness is dependent on both the reaction time and
to eliminate/minimize trap-state defects and improve lumines-                concentration of the Zn precursor adopted.
cent emission efficiency and stability of QDs.41,42 Meanwhile,                     Sensitization of TiO2 Film and Fabrication of Solar
surface passivation has also been extensively implemented in                 Cells. The preparation of TiO2 mesoporous film electrodes
photoanode post-treatment by deposition of ZnS layer over the                (9.0 ± 0.5 μm transparent layer together with 6.0 ± 0.5 μm
sensitized electrode via successive ionic layer adsorption and               light scattering layer) is the same as with our previous
reaction (SILAR) route to reduce the QD/TiO2/electrolyte                     work.30,31 MPA-capped water-soluble QDs were obtained from
interface recombination and therefore improve the PCE of the                 the initial oil-soluble QDs via ligand exchange procedure as
cell devices.38,43−45 However, in this route ZnS can only                    described previously.47−49 QD sensitizers are immobilized on
deposit on the outer exposed surface of QD sensitizer as a loose             TiO2 films by pipetting the obtained MPA-capped QD aqueous
particle-packing network and therefore cannot effectively                     dispersion (with absorbance of 2.0 at excitonic absorption
reduce the intrinsic defect existing in QD sensitizer and cannot             onset) onto the TiO2 film and staying for 3 h and then rinsing
create a barrier at the QD/TiO2 interface to reduce the                      with water and ethanol sequentially. After deposition, the QD-
recombination from electron in TiO2 to hole/trap in QD.22,37                 sensitized TiO2 films were coated with ZnS for 4 cycles by
Furthermore, to our best knowledge, the utilization of                       dipping alternately into 0.1 M Zn(OAc)2 methanol solution
preprepared type-I core/shell QDs directly as sensitizer in                  and 0.1 M Na2S solutions for 1 min/dip.
QDSC has not been reported, even though the demonstration                       The cells were constructed by assembling the brass-based
of this concept has been carried out by sensitization of TiO2                Cu2S counter electrode and QD-sensitized TiO2 film electrode
single crystal with CdSe/ZnS QDs.46                                          using a 50-μm thick Scotch spacer with a binder clip. The Cu2S
   Herein, we target at developing high-efficiency QDSCs based                 counter electrodes were prepared by immersing brass foil in 1.0
on inherently well-passivated CIS/ZnS (CIS-Z) type-I core/                   M HCl solution at 75 °C for 30 min. Polysulfide aqueous
shell structured QD sensitizer. Oleylamine-capped CIS QDs                    solution is used as electrolyte, consisting of 2.0 M Na2S, 2.0 M
with excitonic absorption edge extending to the near infrared                S, and 0.2 M KCl. The brass foil was vulcanized immediately.
(NIR) region were first prepared at high temperature. Then a                      Characterization. Transition electron microscopy (TEM)
thin layer of ZnS shell was overcoated around the CIS core                   images were obtained using a JEOL JEM-2100 instrument. The
through partial cation exchange route, followed by phase                     absorption and PL emission spectra were recorded on a
transfer via ligand exchange to get a bifunctional linker                    Shimadzu UV-2600 and a Cary Eclipse (Varian) spectropho-
molecule mercaptopropionic (MPA)-capped water-soluble                        tometer, respectively. The J−V curves of cell devices were
CIS-Z QDs. The hydrophilic CIS-Z QDs were immobilized                        measured using a Keithley 2400 source meter under
onto mesoporous TiO2 film electrode via self-assembling by                    illumination by an AM 1.5G solar simulator (Oriel, 91160).
dropping MPA-capped QD aqueous solution onto the film                         A NREL standard Si solar cell was used to calibrate the power
electrode. The constructed Cd-free green CIS-Z solar cell                    of the simulated light to 1000 W/m2. The photoactive area was
shows a best PCE of 7.04% (with certified efficiency of 6.66%)                  0.237 cm2 defined by a black metal mask. Incident photon-to-
under AM 1.5 G one full sun illumination, which is a new                     electron conversion efficiency (IPCE) curves were measured on
record efficiency for green QD solar cells in any configuration                 a Keithley 2000 multimeter under the illumination of a 300 W
and also a new record for QDSC with any QD sensitizer.30−32

■
                                                                             tungsten lamp with a Spectral Product DK240 monochromator.
                                                                             Electrochemical impedance spectroscopy (EIS) measurements
    EXPERIMENTAL SECTION                                                     were employed with use of an impedance analyzer (Zahner,
   Chemicals. Indium acetate (In(OAc)3, 99.99%), oleylamine                  Zennium) in dark conditions at forward bias from 0 to −0.55 V,
(OAm, 97%), 1-octadecene (ODE, 90%), zinc acetate (Zn-                       applying a 20 mV ac sinusoidal signal over the constant applied
(OAc)2, 99.99%), and sulfur powder (99.99%) were purchased                   bias with the frequency ranging from 1 MHz to 0.1 Hz. The
from Aldrich. Copper iodide (CuI, 99.998%) and 3-                            fact that photovoltaic parameters kept nearly constant before
mercaptopropionic acid (MPA, 97%) were obtained from                         and after EIS measurements can verify the effectiveness of the
Alfa Aesar. All chemicals were used as received without further              EIS data obtained. Intensity-modulated photocurrent and
processing.                                                                  photovoltage spectra (IMPS/IMVS) were measured on the
   Synthesis of CIS and CIS-Z QDs. For CIS QDs                               same electrochemical workstation (Zahner,) with a frequency
preparation, 14.0 mg of CuI (0.1 mmol) and 29.0 mg of                        response analyzer under an intensity-modulated (30−150 W
                                                                      9204                  dx.doi.org/10.1021/ja504310w | J. Am. Chem. Soc. 2014, 136, 9203−9210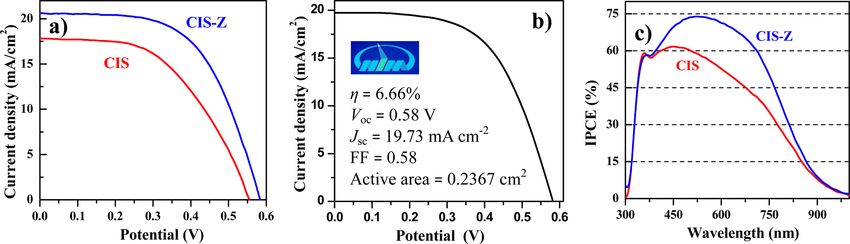
Journal of the American Chemical Society Article
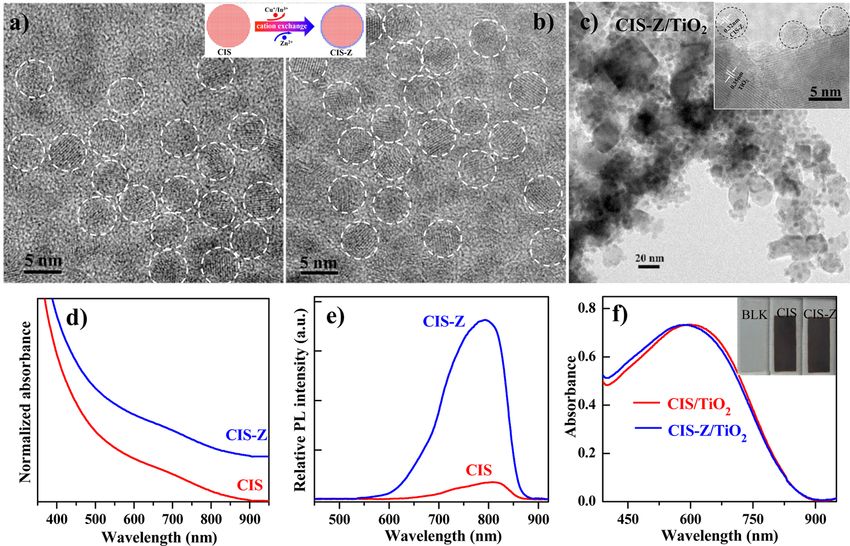
Figure 1. TEM images and optical spectra of CIS, derivative CIS-Z QD dispersions in toluene, and sensitized TiO2 films. (a)−(b) Wide-field TEM
images of CIS and CIS-Z QD dispersions, respectively. Inset illustrates the cation exchange process for CIS-Z QDs. (c) TEM images of CIS-Z QD
(the small particles, ∼5 nm) sensitized TiO2 film (the large particles ∼20 nm). Inset: HRTEM micrograph. (d)−(e) UV−vis absorption and PL
emission spectra (λex = 400 nm) of QD dispersions, respectively. (f) UV−vis absorption spectra of QD-sensitized TiO2 film electrodes. Inset,
comparative pictures of nonsensitized and sensitized electrodes with CIS and CIS-Z QDs.
m−2) blue light emitting diode (457 nm) driven by a Zahner extending to the NIR region of ∼850 nm with corresponding
(PP211) source supply. The modulated light intensity was 10% average size of 5.1 nm were synthesized. The synthesis of high-
or less than the base light intensity. The frequency range was quality CIS QDs (high PL emission efficiency, narrow size
set from 3 kHz to 0.1 Hz for IMPS and 1 kHz to 0.1 Hz for distribution) is well-developed, but strong coordinating ligand
IMVS. dodecanethiol (DDT) is often used as capping reagent.50−54
Two kinds of transient absorption (TA) setups were used to Regretfully, DDT-capped QD is difficult to immobilize on TiO2
characterize the samples in the femtosecond (fs) and electrode with a high surface coverage since DDT ligand cannot
nanosecond (ns) time range. In the fs setup, the laser source be completely displaced during the phase transfer procedure
was a titanium/sapphire laser (CPA-2010, Clark-MXR Inc.) due to the strong coordination capacity of the terminal thiol
with wavelength of 775 nm, repetition rate of 1 kHz, and pulse group.29 This is, in part, the reason why low QD loading and
width of 150 fs. The light was separated into two parts: one as a poor performance were obtained when DDT-capped CIS QDs
probe pulse, the other as a pump light to pump an optical were used as sensitizer in previous reports.25,26,28,29 This fact
parametric amplifier (OPA) (a TOAPS from Quantronix) to has pushed us to develop a DDT-free synthetic approach for
generate light pulses with wavelength tunable from 290 nm to 3 CIS QDs. Briefly, NIR absorption CIS QDs were synthesized
μm. In this study, a pump light wavelength of 388 nm and a by hot injection of sulfur-oleylamine solution into octadecene
probe beam wavelength of 580 nm were used. In the ns TA (ODE) media containing CuI and In(OAc)3 at 180 °C. The
setup, the pump light source was an OPO (Surelite II−10FP) transmission electron microscopy (TEM) images and optical
output excited by a Nd:YAG nanosecond pulse laser (Panther, spectra of the obtained CIS QDs are shown in Figure 1. The
Continuum, Electro-Optics Inc.). The pulse width was 5 ns, XRD pattern as shown in Figure S1 of the Supporting
and the repetition rate was 0.5 Hz. A pulse light with Information indicates that the CIS QDs exhibit tetragonal
wavelength of 570 nm was used as pump light to excite the chalcopyrite structure. It should be noted that the light
sample. The probe light was a fiber coupled CW semiconductor absorption range of our used CIS QDs is significantly wider
laser with a wavelength of 1300 nm to measure the electrons than those in previous reports (usually less than 700 nm). The
injected into TiO2. Thus, charge recombination dynamics limited light absorption range should be part of the reason for
between the electrons in TiO2 and holes in CIS QDs can be poor performance in previously reported solar cells.16−25,28,29
measured. Although the CIS QDs with optimal absorption onset can be
■
conveniently prepared via our adopted DDT-free approach, the
PL quantum yield (QY) of the resulting CIS QDs is nearly
RESULTS AND DISCUSSION zero. This indicates that high density of surface defect exists in
In order to obtain a high-efficiency QD solar cell, QD with a our obtained CIS QDs.41,42 The high defect density of QD
broad light-harvesting range is essential. Meanwhile, in the case sensitizer is fatal for the photovoltaic performance of the
of QDSC configuration high QD loading is also a prerequisite resulting QDSCs since the defect can serve as both internal
for high efficiency.38 Therefore, CIS QDs with absorption range recombination centers in QD itself, before charge injection into
9205 dx.doi.org/10.1021/ja504310w | J. Am. Chem. Soc. 2014, 136, 9203−9210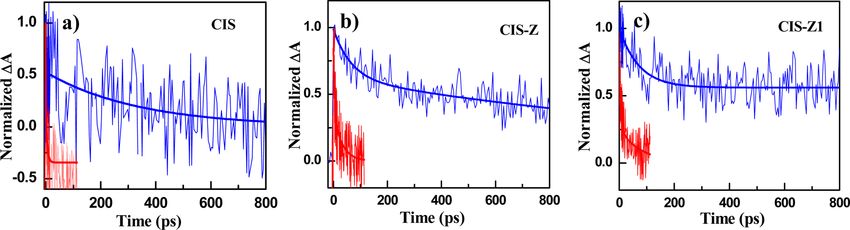
Journal of the American Chemical Society                                                                                                                Article

Figure 2. J−V curves of CIS-Z and CIS-based champion cells (a) and certified CIS-Z cell (b) under the irradiation of 1 full sun. (c) Incident photon
to current efficiency (IPCE) curves.

the transporting media, and recombination centers from                        after Zn exchange. The increased PL QY indicates the effective
electrons already injected into the metal oxide to acceptor                   suppression of defect-trapping of the QDs.41,42
states in QD sensitizer or in the electrolyte. These two                         To evaluate the effectiveness of surface passivation of CIS
recombination processes reduce PCE in the resulting cell                      QDs in the construction of high-efficiency QDSCs, we
devices.36−38                                                                 assembled both plain CIS and CIS-Z in QDSC configuration
   In order to decrease the defect density, a ZnS layer was                   and compared their photovoltaic performance. The obtained
overcoated around the preprepared CIS QDs to form the CIS/                    high-quality CIS-Z and CIS QDs were tethered on TiO2 film
ZnS core/shell QDs (noted as CIS-Z hereafter) via cation                      electrode with high surface coverage through our recently
exchange by adding Zn(OAc)2 into the purified CIS QDs                          developed ex situ ligand exchange postsynthesis assembly
dispersion in oleylamine at intermediate temperature, as has                  approach, which has been proven to be an effective route for
been discussed in the Experimental Section. This strategy for                 immobilizing presynthesized QD on oxide film electrode with
forming the core/shell heterostructure via cation exchange was                high loading (34% coverage) and uniform distribution
extensively used in QD systems since the first report by                       throughout the film thickness.30,31,47,48 In this assembly
Alivisatos.55−57 Similar to previous reports, the adopted cation              approach, the as-prepared oil-soluble CIS-Z and CIS QDs
exchange route can transfer the native core QD into a similar-                were first made water-soluble via ligand exchange with use of
sized core/shell QD without enhancing the particle size due to                bifunctional hydrophilic MPA ligand. The obtained water-
the absence of counteranion.55−58 This is verified by the TEM                  soluble MPA-capped CIS and CIS-Z QD sensitizers were then
image (Figure 1a, b) of the CIS and the derived CIS-Z QDs                     immobilized onto TiO2 film electrodes by pipetting QDs
with nearly identical average size of 5.1 ± 0.4 nm. The                       aqueous solution onto the oxide matrix and staying for 3 h.
nonincreased size favors the immobilization of QD sensitizer                  Absorption spectra of CIS and derived CIS-Z QD-sensitized
onto mesoporous TiO2 film due to the limited pore size                         TiO2 film electrodes are shown in Figure 1f, and the
                                                                              corresponding photographs are shown in the inset. Similar to
(usually 30−50 nm) of the film. It is noted that the XRD
                                                                              the case of colloidal QD dispersions (Figure 1d), the
patterns of CIS-Z QDs also show tetragonal chalcopyrite
                                                                              absorption spectrum of CIS-Z sensitized TiO2 film (Figure
structure (Figure S1 of the Supporting Information). The Zn
                                                                              1f) is nearly identical to that of the CIS-based one with only a
content in the resulting CIS-Z QDs is dependent on both the
                                                                              slight blue-shift. Deduced from the absorption spectra, the
reaction time and concentration of Zn precursor adopted in the                light-harvesting range of both sensitized films covers the whole
process of Zn treatment. We found that CIS-Z QDs with 20%                     visible spectrum and extends to the NIR region with
Zn content in total cation component (based on inductively                    wavelength as far as 900 nm. This wide absorption feature is
coupled plasma atomic emission spectroscopy, ICP-AES),                        further verified by the black color of the sensitized films as
corresponding to 0.7 monolayer of ZnS (∼0.2 nm thickness),                    shown in the inset of Figure 1f. This broad absorption spectral
gives the best performance of the resulting cell devices as                   range paves the way for high photocurrent in the resulting cell
discussed below. When the Zn content is greater than 20%, the                 devices as discussed below. The relatively high absorbance by
device performance decreases gradually. The PL spectra and                    these sensitized film electrodes indicates high QDs loading,
average photovoltaic performances of CIS-Z QDs correspond-                    which could be visualized by the deep coloration as shown in
ing to different Zn contents are shown in Figure S2 and Table                  the inset of Figure 1f.
S1 of the Supporting Information, respectively. This is ascribed                 TEM images (Figure 1c) of CIS-Z QD-sensitized TiO2 film
to the suppression of photogenerated electron injection into                  show the size of QD sensitizers and their distribution on the
TiO2 substrate due to the barrier effect of ZnS shell as                       TiO2 matrix. From the wide-field TEM images, it can be found
discussed below. For convenience, hereafter the CIS-Z QD is                   that the surface of TiO2 particles (larger particles ∼20−40 nm)
specifically referred to the CIS/ZnS QD containing 20% Zn.                     is covered densely by smaller dots (CIS-Z QD, ∼5 nm),
Both absorption and PL emission spectra of CIS before and                     demonstrating a high coverage of the surface of TiO2 film, in
after Zn exchange show small blue-shift (
Journal of the American Chemical Society Article
in the inset of Figure 1c shows clearly the crystalline lattice discussed below. To our best knowledge, both our measured
fringes of the TiO2/CIS-Z composite. The anatase TiO2 PCE of 7.04% and the certified PCE of 6.66% are the highest
substrate displays the (101) plane with lattice spacing distance reported values not only for green QD solar cells but also in all
of 0.35 nm, while the tetragonal crystal phase CIS-Z QDs QDSCs so far. It is noted that other types of quantum dot solar
display the (112) plane of 0.32 nm spacing distance. cells, but using depleted heterojunction configuration based on
Photovoltaic Performance. After deposition of MPA- PbS and solid-state based on Sb2S3, have attained PCE values of
capped water-soluble QDs, a thin passivation layer of ZnS was 6−8%.31,32,59 Our results reported here push the efficiencies
further deposited onto the QD-sensitized TiO2 films via the reported for green QDs in the same range as other QDs
successive ionic layer absorption and reaction (SILAR) route photovoltaic technology containing toxic Cd or Pb.
according to standard literature method.38,43−45 Then sand- Incident photon-to-electron conversion efficiency (IPCE,
wich-type cells were constructed using Cu2S on brass foil as also referred as external quantum efficiency, EQE) is plotted in
counter electrode and polysulfide electrolyte (2.0 M Na2S, and Figure 2c. It was found that the overall photocurrent response
2.0 M S in aqueous solution) as hole transporting media. The closely matches the corresponding absorption spectra of QD-
current density−voltage (J−V) curves of both CIS and CIS-Z sensitized TiO2 films as shown in Figure 1f, and the
champion cells under the irradiation of 1 full sun intensity photocurrent response starts at near 950 nm for both CIS
(measured with mask, AM 1.5G at 100 mW cm−2) are shown in and CIS-Z based cells. By integrating the product of the
Figure 2a, and the average values for main photovoltaic incident photon flux density and the cell’s IPCE spectra, the
parameters based on six cell devices in parallel are listed in calculated Jsc for CIS-Z and CIS cells is 19.5 and 17.3 mA·cm−2,
Table 1. The J−V curves and photovoltaic parameters for each respectively, in good agreement with the measured values; see
Table 1. The IPCE values for CIS-Z are remarkablely higher
Table 1. Photovoltaic Parameters Extracted from J−V than those of CIS in the whole photoresponse range. More
Measurements than 60% of IPCE value in a wide range between 350 and 700
QDs Jsc (mA·cm−2) Voc (V) FF η (%) nm has been achieved for CIS-Z sensitizers with highest value
CIS-Z a
20.65 0.586 0.581 7.04 approaching 75%. The low IPCE values in the range of 700−
CIS-Zb 19.73 0.580 0.580 6.66 900 nm for both cells could be ascribed to the smaller
CIS-Zc 20.26 0.584 0.575 6.83 ± 0.12 absorbance or light-harvesting efficiency (LHE) in this spectral
CISa 17.82 0.555 0.511 5.05 region as shown in Figure 1f.
CISc 17.92 0.541 0.491 4.82 ± 0.12 It has been established that IPCE can be calculated from the
a
Performance of champion cells. bCertified cell. cAverage value of six equation IPCE = LHE × ϕinj × ηc,60 where ϕinj is the electron
devices in parallel. injection efficiency and ηc is charge collection efficiency. As
shown in Figure 1f, CIS- and CIS-Z sensitized TiO2 films show
tested cells are available in Figure S3 and Table S2 of the a similar spectral profile, indicating that both sensitized films
Supporting Information, respectively. It is highlighted that the show similar light-harvesting capability, i.e, similar LHE value.
small standard deviation obtained here indicates the high In order to evaluate the effect of the other two contributions
reproducibility of the method used for construction of cell (i.e., ϕinj and ηc) to the IPCE, electrochemical impedance
devices. A representative CIS-Z cell was sent to the National spectroscopy (EIS) and transient absorption (TA) character-
Institute of Metrology (NIM), China for certification, and the ization have been carried out.
certified PCE was 6.66% (Figure 2b, Table 1, the detailed Electrochemical Impedance Spectroscopy. EIS was
information is available in the Supporting Information). In employed to unveil the intrinsic mechanism of the better
comparison, all the averaged photovoltaic parameters (short- photovoltaic performance of the CIS-Z solar cells related to
circuit current Jsc, open-circuit voltage Voc, and fill factor FF) for reference CIS cells with use of the standard models developed
CIS-Z cell are enhanced 10−15% in comparison with those of by ourselves.38,61−63 The detailed Nyquist curves under
CIS. The observed enhanced photovoltaic performances of different bias for both CIS-Z and CIS cells are available in
CIS-Z cells are mainly attributed to the surface passivation and Figure S4 of the Supporting Information. The chemical
accordingly the reduction of charge carrier recombination as capacitance Cμ, and recombination resistance Rrec extracted
Figure 3. Electrochemical impedance spectroscopy characterization of the CIS-Z and reference CIS QD based cells. (a) Dependence of chemical
capacitance Cμ and (b) recombination resistance Rrec on applied voltage (Vappl). (c) Nyquist plots of both cells at −0.55 V forward bias.
9207 dx.doi.org/10.1021/ja504310w | J. Am. Chem. Soc. 2014, 136, 9203−9210Journal of the American Chemical Society Article
Figure 4. Transient absorption characterization in picosecond time scale. Kinetic traces of the excitonic decay (recorded at 580 nm) of (a) CIS, (b)
CIS-Z, and (c) CIS-Z1 QDs deposited on SiO2 (blue fine lines) and TiO2 substrates (red fine lines) for a time scale up to 800 ps. The bold lines
represent the corresponding biexponential fit, eq 1. All measurements were carried out in N2 atmosphere using a 388 nm laser pulse excitation.
Table 2. Fitting Results of the TA Responses with Biexponential Function Eq 1 and Calculated Average Lifetime Using Eq 2 as
Well as Electron Injection Rate Calculated Using Eq 3
samples t1 (ps) t2 (ps) A1 A2 tav (ps) kET (×1011 s−1)
SiO2/CIS 2.4 ± 1.8 359 ± 125 0.60 ± 0.28 0.40 ± 0.08 355.5
SiO2/CIS-Z 66 ± 19 1769 ± 307 0.37 ± 0.05 0.63 ± 0.03 1732.5
SiO2/CIS-Z1 72 ± 17 ≫1 ns 0.44 ± 0.04 0.56 ± 0.03 ≫1 ns
TiO2/CIS 0.15 ± 0.11 4.9 ± 0.9 0.54 ± 0.2 0.46 ± 0.07 4.7 2.08
TiO2/CIS-Z 4.3 ± 1.3 32 ± 8 0.57 ± 0.08 0.43 ± 0.08 27.8 0.35
TiO2/CIS-Z1 5.7 ± 1.3 83 ± 32 0.69 ± 0.06 0.31 ± 0.06 72.8 0.14
from the corresponding Nyquist curves are illustrated in Figure TA Measurement. To study the photoexcited carrier
3a, b. It has been well established that Rrec in QDSCs reflects dynamics in CIS-Z QDs and electron injection rate from
the charge recombination process between QD sensitizers/ CIS-Z QDs to TiO2 substrates as well as the effects of ZnS
TiO2/electrolyte interfaces.38,61 The similar Cμ values observed passivation on them, we used femtosecond (fs) and nano-
in both cells (Figure 3a) indicate that the nature of the different second (ns) transient absorption (TA) setups to characterize
sensitizers (CIS or CIS-Z QDs) does not affect the position of the charge separation (i.e., electron injection) and recombina-
the conduction band edge or the density of states of TiO2.38 As tion dynamics for CIS QDs and CIS QDs with different
shown in Figure 3b, the difference in Rrec values between the thickness of ZnS coatings deposited on insulating SiO2 films or
two cells in the whole applied forward bias range is remarkable. TiO2 films (SiO2/CIS, TiO2/CIS, SiO2/CIS-Z, TiO2/CIS-Z,
The Rrec values of CIS-Z cells are several times higher than SiO2/CIS-Z1, TiO2/CIS-Z1, CIS-Z, and CIS-Z1 correspond to
those of CIS cells. For clarity, Figure 3c gives direct comparison ZnS shell thickness of 0.7 and 1.5 ML, respectively).64,65 The
pump light wavelength is 388 nm and the probe light
of Nyquist plots between CIS-Z and CIS cells at forward bias of
wavelength is 580 nm, which are identical to the TA spectra
−0.55 V, which is near the Voc values of the two cells, and the
of CIS QDs reported by Kamat.25 Similarly, we observed a
extracted EIS parameters are collected in Table S3 of the bleaching of the ground-state absorption as the charge-
Supporting Information. We can find that the Rrec value of CIS- separation state created after pump light was absorbed. With
Z cell is nearly threefold to that of CIS cells. Because of the increasing time, the bleached absorption recovers as the
identical device structure (i.e., identical TiO2 film electrode and electrons recombine with the holes. Figure 4 shows the
redox electrolyte), there is no difference in the recombination normalized TA decay signals of the six studied samples, which
of photoexcited electrons at the metal oxide matrix with correspond to kinetic traces of the excitonic decay for different
acceptor species in electrolyte between two cells. Therefore, the QDs deposited on the two different substrates. It can be found
observed greater recombination resistance in CIS-Z cell related that for all studied QDs on insulating SiO2, the recovery of the
to CIS cell should be ascribed to the blockage of electron bleaching is rather slow since the charge recombination in all
recombination between TiO2/QD interface and/or QD/ QDs is dominated by electron in the conduction band and hole
electrolyte interface, i.e., the back electron transfer from TiO2 in the valence band, including those through surface defect
to QD sensitizer and/or from QD to electrolyte. This is further states and direct recombination between electrons and holes
verified by the TA measurements below. As described above, and there is no electron injection from CIS QDs to the
the passivation of ZnS around the CIS core suppresses the insulating SiO2. However, the recovery of QDs bleaching on
surface traps and then switches off the back electron transfer TiO2 is much faster, which indicates that a fast electron-transfer
routes. Meanwhile, the calculated electron lifetime (τn = Rrec × is dominated. We find that there are two decay processes in all
Cμ) for the CIS-Z cell at open-circuit condition is ∼threefold the TA kinetics, and they can be fitted very well to a
longer than that of the CIS cell, which favors the improvement biexponential function of eq 1
of charge collection efficiency, ηc. These results are also Y = A1e−t / t1 + A 2 e−t / t2 (1)
supported by intensity modulated photocurrent/photovoltage
spectroscopy (IMPS/IMVS) and transient absorption in the where t1 and t2 are the lifetimes and A1 and A2 are the
microsecond−millisecond range; see the Supporting Informa- contributions from the two components. Table 2 shows the
tion. fitting results of all the samples. For CIS/SiO2 sample, the two
9208 dx.doi.org/10.1021/ja504310w | J. Am. Chem. Soc. 2014, 136, 9203−9210Journal of the American Chemical Society
■
Article
lifetimes are 2.4 and 359 ps, respectively. As discussed earlier, ASSOCIATED CONTENT
there are a lot of defects for CIS QDs without ZnS passivation. *
S Supporting Information
Thus, the fast and slow decay processes can be considered to XRD patterns of CIS and CIS-Z QDs; J−V curves and
result from recombination through shallow and deep defects. photovoltaic parameters of CIS and CIS-Z with different Zn
As ZnS passivation with a thinner thickness (SiO2/CIS-Z contents based cell devices (each group has six devices in
sample), the two lifetimes increased greatly up to 66 ps and 1.7 parallel); certified report for photovoltaic performance of CIS-Z
ns, respectively. As ZnS thickness was increased more (SiO2/ cell; Nyquist curves under different bias voltages for both CIS
CIS-Z1), the fast lifetime was almost the same as that of SiO2/ and CIS-Z cells and the EIS parameters at forward bias of
CIS-Z1; however, the lifetime for the slow one became much −0.55 V; intensity-modulated photocurrent/photovoltage spec-
longer than 1 ns. These results demonstrate that the surface troscopy (IMPS/IMVS); ns-TA measurements. This material is
defects decreased dramatically by the ZnS passivation on the available free of charge via the Internet at http://pubs.acs.org.
■
CIS QD surfaces, which is consistent with the PL results
mentioned above. For TiO2 substrate, t1 and t2 for samples CIS, AUTHOR INFORMATION
CIS-Z, and CIS-Z1 follow the same trend but with a dramatic
decrease of the lifetime; see Table 2. Then, we calculated the Corresponding Author
average lifetimes of the photoexcited carriers using eq 266 zhongxh@ecust.edu.cn.
Notes
A t 2 + A 2t2 2 The authors declare no competing financial interest.
■
tav = 1 1
A1t1 + A 2 t 2 (2)
ACKNOWLEDGMENTS
The results of tav for each sample are shown in Table 2. Very We acknowledge the National Natural Science Foundation of
interestingly, as the ZnS coating was applied to the QD surface, China (Nos. 21175043, 21301059), the Science and Technol-
tav increases 1 order of magnitude, showing a dramatic decrease ogy Commission of Shanghai Municipality (11JC1403100,
in the internal recombination (before charge injection into 12NM0504101, 12ZR1407700), and the Fundamental Re-
TiO2) and consequently increase of the electron injection search Funds for the Central Universities for financial support.
efficiency ϕinj. The electron injection rate constant kET can be
obtained from eq 3 as follows:66
vkET = 1/tav(CIS/TiO2) − 1/tav(CIS/SiO2)
■ REFERENCES
(1) Swierk, J. R.; Mallouk, T. E. Chem. Soc. Rev. 2013, 42, 2357−
(3) 2387.
(2) Bai, Y.; Mora-Seró, I.; Angelis, F. D.; Bisquert, J.; Wang, P. Chem.
The result of kET, shown in Table 2, is 2 × 10¹¹ s−1 for CIS Rev. 2014, DOI: 10.1021/cr400606n.
QDs without ZnS surface coating, which is in good agreement (3) Kamat, P. V. J. Phys. Chem. Lett. 2013, 4, 908−918.
with the reported results.25,34 With ZnS coating kET decreases (4) Kramer, I. J.; Sargent, E. H. Chem. Rev. 2014, 114, 863−882.
as ZnS shell acts also as a barrier for carrier injection. In this (5) Albero, J.; Clifford, J. N.; Palomares, E. Coord. Chem. Rev. 2013,
sense, ZnS shell has two conflicting effects that must be 263−264, 53−64.
(6) Lohse, S. E.; Murphy, C. J. J. Am. Chem. Soc. 2012, 134, 15607−
conveniently balanced in order to increase ϕinj. On one hand 15620.
ZnS reduces internal recombination and on the other one it (7) Kamat, P. V.; Tvrdy, K.; Baker, D. R.; Radich, J. G. Chem. Rev.
acts as injection barrier. Optimum behavior has been obtained 2010, 110, 6664−6688.
for 0.7 ML ZnS shell. (8) Ruhle, S.; Shalom, M.; Zaban, A. ChemPhysChem 2010, 11,
■
2290−2304.
CONCLUSIONS (9) Nozik, A. J.; Beard, M. C.; Luther, J. M.; Law, M.; Ellingson, R. J.;
Johnson, J. C. Chem. Rev. 2010, 110, 6873−6890.
We have developed high-efficiency green QDSC based on CIS- (10) Sambur, J. B.; Novet, T.; Parkinson, B. A. Science 2010, 330,
Z QD sensitizer. These solar cells show an unprecedented 63−66.
champion cell efficiency of 7.04% and a certified efficiency of (11) Semonin, O. E.; Luther, J. M.; Choi, S.; Chen, H.-Y.; Gao, J.;
6.66%, a record efficiency for Cd- and Pb-free QD solar cells, Nozik, A. J.; Beard, M. C. Science 2011, 334, 1530−1533.
and the highest efficiency ever reported for QDSCs. The huge (12) Yang, Z.; Chen, C.-Y.; Roy, P.; Chang, H.-T. Chem. Commun.
increase in the efficiency for green QDs solar cells is based on 2011, 47, 9561−9571.
(13) Kamat, P. V. J. Phys. Chem. C 2008, 112, 18737−18753.
(i) the use of CIS QDs with broad light absorption range (14) Mora-Seró, I.; Bisquert, J. J. Phys. Chem. Lett. 2010, 1, 3046−
extending to NIR; (ii) preparation of type-I CIS/ZnS core/ 3052.
shell QDs; this ZnS shell coating increases significantly the (15) Booth, M.; Brown, A. P.; Evans, S. D.; Critchley, K. Chem.
electron injection efficiency ϕinj, and charge collection Mater. 2012, 24, 2064−2070.
efficiency, ηc, as demonstrated by TA and EIS characterization (16) Chang, J.-Y.; Su, L.-F.; Li, C.-H.; Chang, C.-C.; Lin, J.-M. Chem.
respectively; and (iii) a high QD loading by linker molecule Commun. 2012, 48, 4848−4850.
exchange, that allows a high light-harvesting efficiency, LHE. (17) Wang, Y.; Rui, Y.; Zhang, Q.; Li, Y.; Wang, H. ACS Appl. Mater.
These results place Cd- and Pb-free QD solar cells for the first Interfaces 2013, 5, 11858−11864.
time at the same level of efficiency as their counterparts (18) Xu, G.; Ji, S.; Miao, C.; Liu, G.; Ye, C. J. Mater. Chem. 2012, 22,
4890−4896.
containing these toxic elements, opening a broad range of
(19) Chang, J. Y.; Lin, J. M.; Su, L. F.; Chang, C. F. ACS Appl. Mater.
possibilities for further enhancement of friendly materials for Interfaces 2013, 5, 8740−8752.
QD photovoltaics. We are confident that with the optimization (20) Luo, J.; Wei, H.; Huang, Q.; Hu, X.; Zhao, H.; Yu, R.; Li, D.;
of redox electrolyte and corresponding counter electrode,67 the Luo, Y.; Meng, Q. Chem. Commun. 2013, 49, 3881−3883.
photovoltaic performances of QDSCs can catch or even surpass (21) Hu, X.; Zhang, Q.; Huang, X.; Li, D.; Luo, Y.; Meng, Q. J. Mater.
those of its analogue dye-sensitized solar cells. Chem. 2011, 21, 15903−15905.
9209 dx.doi.org/10.1021/ja504310w | J. Am. Chem. Soc. 2014, 136, 9203−9210Journal of the American Chemical Society Article
(22) Li, T. L.; Lee, Y. L.; Teng, H. S. Energy Environ. Sci. 2012, 5, (55) Park, J.; Kim, S. W. J. Mater. Chem. 2011, 21, 3745−3750.
5315−5324. (56) Tang, J.; Kemp, K. W.; Hoogland, S.; Jeong, K. S.; Liu, H.;
(23) Lin, C. Y.; Teng, C. Y.; Li, T. L.; Lee, Y. L.; Teng, H. S. J. Mater. Levina, L.; Furukawa, M.; Wang, X.; Debnath, R.; Cha, D.; Chou, K.;
Chem. A 2013, 1, 1155−1162. Fischer, A.; Amassian, A.; Asbury, J. B.; Sargent, E. H. Nat. Mater.
(24) Li, T. L.; Lee, Y. L.; Teng, H. S. J. Mater. Chem. 2011, 21, 5089− 2011, 10, 765−771.
5098. (57) Son, D. H.; Hughes, S. M.; Yin, Y.; Alivisatos, A. P. Science 2004,
(25) Santra, P. K.; Nair, P. V.; Thomas, K. G.; Kamat, P. V. J. Phys. 306, 1009−1012.
Chem. Lett. 2013, 4, 722−729. (58) Zhong, X.; Feng, Y.; Zhang, Y.; Gu, Z.; Zou, L. Nanotechnology
(26) McDaniel, H.; Fuke, N.; Pietryga, J. M.; Klimov, V. I. J. Phys. 2007, 18, 385606.
Chem. Lett. 2013, 4, 355−361. (59) Im, S. H.; Lim, C.-S.; Chang, J. A.; Lee, Y. H.; Maiti, N.; Kim,
(27) McDaniel, H.; Fuke, N.; Makarov, N. S.; Pietryga, J. M.; Klimov, H.-J.; Nazeeruddin, Md. K.; Gratzel, M.; Seok, S. I. Nano Lett. 2011,
V. I. Nat. Commun. 2013, 4, 2887. 11, 4789−4793.
(28) Peng, Z.; Liu, Y.; Zhao, Y.; Shu, W.; Chen, K.; Bao, Q.; Chen, (60) Fillinger, A.; Parkinson, B. A. J. Electrochem. Soc. 1999, 146,
W. Electrochim. Acta 2013, 111, 755−761. 4559−4564.
(29) Chang, C. C.; Chen, J. K.; Chen, C. P.; Yang, C. H.; Chang, J. Y. (61) González-Pedro, V.; Xu, X.; Mora-Seró, I.; Bisquert, J. ACS
ACS Appl. Mater. Interfaces 2013, 5, 11296−11306. Nano 2010, 4, 5783−5790.
(30) Wang, J.; Mora-Sero, I.; Pan, Z.; Zhao, K.; Zhang, H.; Feng, Y.; (62) Kim, H.-S.; Mora-Seró, I.; Gonzalez-Pedro, V.; Fabregat-
Yang, G.; Zhong, X.; Bisquert, J. J. Am. Chem. Soc. 2013, 135, 15913− Santiago, F.; Juarez-Perez, E. J.; Park, N.-G.; Bisquert, J. Nat. Commun.
15922. 2013, 4, 2242.
(31) Pan, Z.; Zhao, K.; Wang, J.; Zhang, H.; Feng, Y.; Zhong, X. ACS (63) Fabregat-Santiago, F.; Garcia-Belmonte, G.; Mora-Seró, I.;
Nano 2013, 7, 5215−5222. Bisquert, J. Phys. Chem. Chem. Phys. 2011, 13, 9083−9118.
(32) Yan, K.; Zhang, L.; Qiu, J.; Qiu, Y.; Zhu, Z.; Wang, J.; Yang, S. J. (64) Shen, Q.; Ogomi, Y.; Park, B. W.; Inoue, T.; Pandey, S. S.;
Am. Chem. Soc. 2013, 135, 9531−9539. Miyamoto, A.; Fujita, S.; Katayama, K.; Toyoda, T.; Hayase, S. Phys.
(33) Ning, Z.; Zhitomirsky, D.; Adinolfi, V.; Sutherland, B.; Xu, J.; Chem. Chem. Phys. 2012, 14, 4605−4613.
Voznyy, O.; Maraghechi, P.; Lan, X.; Hoogland, S.; Ren, Y.; Sargent, E. (65) Shen, Q.; Ogomi, Y.; Das, S. K.; Pandey, S. S.; Yoshino, K.;
H. Adv. Mater. 2013, 25, 1719−1723. Katayama, K.; Momose, H.; Toyoda, T.; Hayase, S. Phys. Chem. Chem.
(34) Ip, A. H.; Thon, S. M.; Hoogland, S.; Voznyy, O.; Zhitomirsky, Phys. 2013, 15, 14370−14376.
D.; Debnath, R.; Levina, L.; Rollny, L. R.; Carey, G. H.; Fischer, A.; (66) Guijarro, N.; Lana-Villarreal, T.; Shen, Q.; Toyoda, T.; Gómez,
Kemp, K. W.; Kramer, I. J.; Ning, Z.; Labelle, A. J.; Chou, K. W.; R. J. Phys. Chem. C 2010, 114, 21928−21937.
Amassian, A.; Sargent, E. H. Nat. Nanotechnol. 2012, 7, 577−582. (67) Zhao, K.; Yu, H.; Zhang, H.; Zhong, X. J. Phys. Chem. C 2014,
(35) Roelofs, K. E.; Brennan, T. P.; Bent, S. F. J. Phys. Chem. Lett. 118, 5683−5690.
2014, 5, 348−360.
(36) Kamat, P. V. Acc. Chem. Res. 2012, 45, 1906−1915.
(37) Hodes, G. J. Phys. Chem. C 2008, 112, 17778−17787.
(38) Mora-Seró, I.; Gimenez, S.; Fabregat-Santiago, F.; Gomez, R.;
Shen, Q.; Toyoda, T.; Bisquert, J. Acc. Chem. Res. 2009, 42, 1848−
1857.
(39) Alivisatos, A. P. Science 1996, 271, 933−937.
(40) Aldakov, D.; Lefrançois, A.; Reiss, P. J. Mater. Chem. C 2013, 1,
3756−3776.
(41) Chaudhuri, R. G.; Paria, S. Chem. Rev. 2012, 112, 2373−2433.
(42) Dabbousi, B. O.; Rodriguez-Viejo, J.; Mikulec, F. V.; Heine, J.
R.; Mattoussi, H.; Ober, R.; Jensen, K. F.; Bawendi, M. G. J. Phys.
Chem. B 1997, 101, 9463−9475.
(43) Diguna, L. J.; Shen, Q.; Kobayashi, J.; Toyoda, T. Appl. Phys.
Lett. 2007, 91, 023116.
(44) Barea, E. M.; Shalom, M.; Gimenez, S.; Hod, I.; Mora-Seró, I.;
Zaban, A.; Bisquert, J. J. Am. Chem. Soc. 2010, 132, 6834−6839.
(45) Guijarro, N.; Campina, J. M.; Shen, Q.; Toyoda, T.; Lana-
Villarreala, T.; Gomez, R. Phys. Chem. Chem. Phys. 2011, 13, 12024−
12032.
(46) Sambur, J. B.; Parkinson, B. A. J. Am. Chem. Soc. 2010, 132,
2130−2131.
(47) Zhang, H.; Cheng, K.; Hou, Y.; Fang, Z.; Pan, Z.; Wu, W.; Hua,
J.; Zhong, X. Chem. Commun. 2012, 48, 11235−11237.
(48) Pan, Z.; Zhang, H.; Cheng, K.; Hou, Y.; Hua, J.; Zhong, X. ACS
Nano 2012, 6, 3982−3991.
(49) Liu, L.; Guo, X.; Li, Y.; Zhong, X. Inorg. Chem. 2010, 49, 3768−
3775.
(50) Li, L.; Pandey, A.; Werder, D. J.; Khanal, B. P.; Pietryga, J. M.;
Klimov, V. I. J. Am. Chem. Soc. 2011, 133, 1176−1179.
(51) Xie, R.; Rutherford, M.; Peng, X. J. Am. Chem. Soc. 2009, 131,
5691−5697.
(52) Zhong, H.; Lo, S. S.; Mirkovic, T.; Li, Y.; Ding, Y.; Li, Y.;
Scholes, G. D. ACS Nano 2010, 4, 5253−5262.
(53) Chen, B.; Zhong, H.; Zhang, W.; Tan, Z.; Li, Y.; Yu, C.; Zhai,
T.; Bando, Y.; Yang, S.; Zou, B. Adv. Funct. Mater. 2012, 22, 2081−
2088.
(54) Zhang, W.; Zhong, X. Inorg. Chem. 2011, 50, 4065−4072.
9210 dx.doi.org/10.1021/ja504310w | J. Am. Chem. Soc. 2014, 136, 9203−9210You can also read