Country-level and gridded estimates of wastewater production, collection, treatment and reuse
←
→
Page content transcription
If your browser does not render page correctly, please read the page content below
Earth Syst. Sci. Data, 13, 237–254, 2021
https://doi.org/10.5194/essd-13-237-2021
© Author(s) 2021. This work is distributed under
the Creative Commons Attribution 4.0 License.

             Country-level and gridded estimates of wastewater
                production, collection, treatment and reuse
               Edward R. Jones1 , Michelle T. H. van Vliet1 , Manzoor Qadir2 , and Marc F. P. Bierkens1,3
          1 Department     of Physical Geography, Faculty of Geosciences, Utrecht University, Utrecht, the Netherlands
        2 Institute   for Water, Environment and Health (UNU-INWEH), United Nations University, Hamilton, Canada
                            3 Unit Subsurface & Groundwater Systems, Deltares, Utrecht, the Netherlands

                                      Correspondence: Edward R. Jones (e.r.jones@uu.nl)

                                      Received: 16 June 2020 – Discussion started: 27 August 2020
                         Revised: 27 November 2020 – Accepted: 7 December 2020 – Published: 8 February 2021

       Abstract. Continually improving and affordable wastewater management provides opportunities for both pol-
       lution reduction and clean water supply augmentation, while simultaneously promoting sustainable development
       and supporting the transition to a circular economy. This study aims to provide the first comprehensive and con-
       sistent global outlook on the state of domestic and manufacturing wastewater production, collection, treatment
       and reuse. We use a data-driven approach, collating, cross-examining and standardising country-level wastew-
       ater data from online data resources. Where unavailable, data are estimated using multiple linear regression.
       Country-level wastewater data are subsequently downscaled and validated at 5 arcmin (∼ 10 km) resolution.
       This study estimates global wastewater production at 359.4 × 10⁹ m3 yr−1 , of which 63 % (225.6 × 10⁹ m3 yr−1 )
       is collected and 52 % (188.1 × 10⁹ m3 yr−1 ) is treated. By extension, we estimate that 48 % of global wastewa-
       ter production is released to the environment untreated, which is substantially lower than previous estimates of
       ∼ 80 %. An estimated 40.7 × 10⁹ m3 yr−1 of treated wastewater is intentionally reused. Substantial differences
       in per capita wastewater production, collection and treatment are observed across different geographic regions
       and by level of economic development. For example, just over 16 % of the global population in high-income
       countries produces 41 % of global wastewater. Treated-wastewater reuse is particularly substantial in the Mid-
       dle East and North Africa (15 %) and western Europe (16 %), while comprising just 5.8 % and 5.7 % of the
       global population, respectively. Our database serves as a reference for understanding the global wastewater sta-
       tus and for identifying hotspots where untreated wastewater is released to the environment, which are found
       particularly in South and Southeast Asia. Importantly, our results also serve as a baseline for evaluating progress
       towards many policy goals that are both directly and indirectly connected to wastewater management. Our spa-
       tially explicit results available at 5 arcmin resolution are well suited for supporting more detailed hydrological
       analyses such as water quality modelling and large-scale water resource assessments and can be accessed at
       https://doi.org/10.1594/PANGAEA.918731 (Jones et al., 2020).

1   Introduction                                                    and Hoekstra, 2014). It is increasingly recognised that con-
                                                                    ventional water resources such as rainfall, snowmelt and
Clean water is essential for supporting human livelihoods,          runoff captured in lakes, rivers and aquifers are insufficient
achieving sustainable development and maintaining ecosys-           to meet human demands in water-scarce areas (Jones et al.,
tem health. All major human activities, such as crop and            2019; Hanasaki et al., 2013; Kummu et al., 2016). While in-
livestock production, manufacturing of goods, power gen-            creases in water use efficiencies can somewhat reduce the
eration, and domestic activities rely upon the availability of      water demand–supply gap, these approaches must be com-
water in both adequate quantities and of acceptable quality         bined with supply and quality enhancement strategies (Gude,
at the point of intended use (van Vliet et al., 2017; Ercin

Published by Copernicus Publications.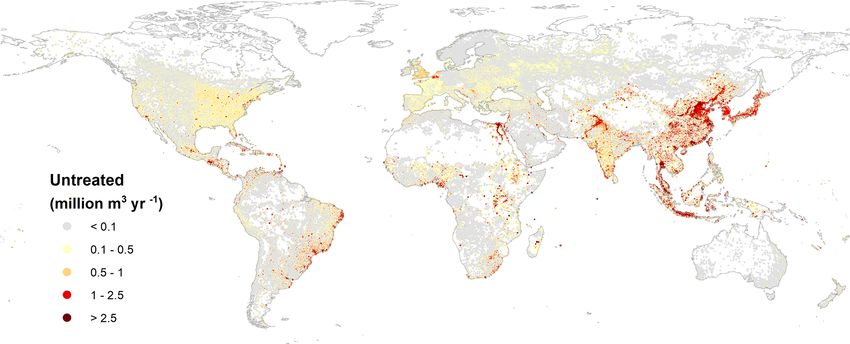
238                                         E. R. Jones et al.: Country-level and gridded estimates of wastewater production

2017). Conventional supply enhancement strategies, such as         larly agriculture and landscape irrigation (Qadir et al., 2007;
reservoir construction, surface water diversion and pipeline       WWAP, 2017; Zhang and Shen, 2017). Agricultural activ-
construction are contingent on geographic and climate fac-         ities are expected to increasingly rely on alternative water
tors, can face strong public opposition and often lack water       resources, as this sector has the largest water demands glob-
quality considerations.                                            ally (Wada et al., 2013). Furthermore, the agricultural sec-
   A growing set of viable but unconventional water re-            tor faces reductions in conventional water resources alloca-
sources offer enormous potential for narrowing the water           tion (Sato et al., 2013). The reliable supply of water, re-
demand–supply gap towards a water-secure future. Uncon-            duced need for additional fertiliser and potential for grow-
ventional water resources encapsulate a range of strategies        ing high-value vegetables promote wastewater irrigation in
across different scales, from localised fog-water and rainwa-      water-scarce developing countries (Sato et al., 2013). How-
ter harvesting to mega-scale desalination plants and wastew-       ever, much of the wastewater currently reused is inadequately
ater treatment and reuse facilities (Jones et al., 2019; Morote    treated or even untreated (Qadir et al., 2010; Scott et al.,
et al., 2019; Qadir et al., 2020). The use of unconventional       2010). Demands for wastewater are increasing at a faster
water resources has grown rapidly in the last few decades, of-     pace than treatment solutions and institutions that ensure the
ten out of necessity, and their importance across various geo-     safe distribution and management of wastewater (Sato et al.,
graphic scales is already irrefutable (Jones et al., 2019; Qadir   2013). The primary challenge in promoting reuse is ensuring
et al., 2018). Furthermore, continually improving unconven-        safety – both for human and ecosystem health – and thus en-
tional water resources technologies have permitted more ef-        suring that wastewater is adequately treated prior to use or
ficient and economical “tapping” of water resources, which         environmental discharge (WWAP, 2017). This is needed to
were previously unusable due to access constraints or the          achieve the required paradigm shift in water resources man-
added costs related to unsuitable water quality (e.g. seawa-       agement, whereby wastewater is viewed as a resource (for
ter desalination and wastewater treatment).                        energy, nutrients and water) rather than as “waste” (WWAP,
   Wastewater is broadly defined as “used” water that has          2017; Qadir et al., 2020).
been contaminated as a result of human activities (Mateo-             To understand the current state and explore the future po-
Sagasta et al., 2015). While agricultural runoff is rarely col-    tential of wastewater as a resource, a comprehensive and
lected or treated (WWAP, 2017), return flows from domes-           consistent global assessment of wastewater production, col-
tic and manufacturing sources (henceforth “wastewater”) can        lection, treatment and reuse is required. This information is
be collected in infrastructure including piped systems (sew-       essential for assessing progress towards Sustainable Devel-
erage) or on-site sanitation systems (septic tanks and pit         opment Goal (SDG) 6, such as SDG 6.3 that specifically
latrines). Wastewater is increasingly recognised as a reli-        focuses on achieving water quality improvements through
able and cost-effective source of freshwater, particularly for     halving the proportion of untreated wastewater and pro-
agricultural applications (WWAP, 2017; Jiménez and Asano,          moting safe reuse globally. Furthermore, this information
2008). Yet, wastewater remains an “untapped” and “under-           is important for identifying hotspots where improvements
valued” resource (WWAP, 2017). Wastewater treatment aims           in wastewater management are highly necessary and when
to improve the quality of used water sources to reduce con-        used as input data for a range of scientific assessments (e.g.
taminant levels below sectoral quality thresholds for inten-       stream water quality dynamics and water scarcity assess-
tional reuse or to minimise the environmental impacts of           ments). However, the availability of wastewater data at the
wastewater return flows. Treated-wastewater flows can also         continental and global scales is sparse and often outdated or
provide a substantial source of (clean) freshwater flows for       from inconsistent reporting years (Sato et al., 2013). Previous
maintenance of river flows, especially during drought (Luthy       studies remain limited in their approach and estimates, rely-
et al., 2015). Where treated-wastewater discharges form a          ing on a few data sources covering less than half of the coun-
substantial part of the river flow, de facto wastewater reuse,     tries across the world (Mateo-Sagasta et al., 2015; Sato et al.,
defined as the incidental presence of treated wastewater in        2013). A recent study explored the global and regional “po-
a water supply, can be high (Rice et al., 2013; Beard et al.,      tential” of wastewater as a water, nutrient and energy source
2019). Treated wastewater can also be used for groundwa-           but did not address the collection, treatment and reuse aspects
ter recharge, helping to preserve the viability of freshwater      of wastewater (Qadir et al., 2020). This paper presents the
extraction from groundwater into the future (Qadir et al.,         first global assessment of spatially explicit wastewater pro-
2015), in addition to applications in agroforestry systems (El     duction, collection, treatment and reuse, consistently comb-
Moussaoui et al., 2019) and aquaculture (Khalil and Hussein,       ing different data sources. Country-level quantifications are
2008). In summary, wastewater treatment can improve river          downscaled to a grid level of 5 arcmin for inclusion in large-
water quality and ecosystem health, while providing an alter-      scale water resource assessments and water quality models.
native source of freshwater for human use and subsequently
reducing competition for conventional water supplies.
   Historically, wastewater (both treated and untreated) has
been predominantly used for non-potable purposes, particu-

Earth Syst. Sci. Data, 13, 237–254, 2021                                            https://doi.org/10.5194/essd-13-237-2021
E. R. Jones et al.: Country-level and gridded estimates of wastewater production                                             239

2     Methods                                                      wastewater treatment < wastewater reuse), percentage val-
                                                                   ues were set to the proceeding level in the wastewater chain
2.1    Wastewater data sources                                     (Fig. 1).
                                                                      Table 1 displays the data sources and the associated num-
The fate of domestic and manufacturing wastewater after            ber of countries with wastewater data for production, collec-
production can follow a number of paths (Fig. 1). Wastew-          tion, treatment and reuse. The procedure for standardising
ater from these activities can be collected, typically in sew-     data to the year 2015, when required, is presented. Wastew-
ers, septic tanks or pit latrines, or uncollected and discharged   ater production is assumed to be dependent upon both pop-
directly to the environment (e.g. open defecation). Collected      ulation size and per capita production (related to per capita
wastewater can undergo treatment, ranging from basic pri-          wealth). Hence, we standardise wastewater production lin-
mary treatment (removing suspended solids) to specialised          early with GDP (gross domestic product), a combined metric
tertiary or triple-barrier treatment (nutrient removal and toxic   of population size and wealth. Conversely, wastewater col-
compound removal), or can be discharged to the environ-            lection and treatment are assumed to be more dependent on
ment untreated (Mateo-Sagasta et al., 2015). When treated,         economics; hence we linearly apply GDP per capita for stan-
wastewater can be released to the environment or intention-        dardisation. The methods used to compile wastewater pro-
ally reused as a “fit-for-purpose” water source. Untreated         duction, collection, treatment and reuse data from multiple
wastewater can similarly be discharged to the environment          sources to provide a single quantification per country are
or intentionally used as a source of freshwater. Furthermore,      also displayed. Lastly, the population coverage in percentage
both treated and untreated wastewater can be used uninten-         terms and by the number of unique countries is displayed
tionally where wastewater is incidentally present in a water       both per geographic region and by economic classification.
supply (“de facto reuse”).                                         The number of unique countries and the population coverage
   Country-level wastewater data were collated from four on-       of data at each stage of the wastewater chain are also dis-
line databases (Table 1): Global Water Intelligence (GWI,          played in Fig. 1. Reported wastewater data were available for
2015), the Food and Agriculture Organization of the United         the majority of the world’s most populous countries. This re-
Nations (FAO AQUASTAT, 2020), Eurostat (Eurostat, 2020)            sults in a high-percentage population coverage relative to the
and the United Nations Statistics Division (UNSD, 2020).           number of countries. Both the number of countries and pop-
For consistency, the year 2015 was selected for all wastewa-       ulation coverage reduces through the wastewater chain, with
ter data. Where wastewater data from the online sources were       available wastewater data decreasing from 118 to 37 coun-
reported in a different year (up to a maximum of 10 years,         tries (90 % to 60 % population coverage) from wastewater
i.e. 2006 onwards), all wastewater data were standardised to       production to wastewater reuse data.
2015 based on data from the most recent reporting year (see
Table 1 for the standardisation method).                           2.2   Regression for country-level predictions
   Data from different sources were cross-examined to check
for consistency and to remove implausible data. Where large        Datasets of predictor variables for regression analyses were
discrepancies (> 1 order of magnitude) existed between             downloaded from multiple sources (see overview Table 2).
different data sources for a country, data points were ex-         Datasets spanned a wide range of predictor variables cover-
cluded. For example, the GWI reports Kazakhstan to pro-            ing social (e.g. total and urban population), economic (e.g.
duce 6205×106 m3 yr−1 , whereas the FAO reports just 411×          GDP or Human Development Index (HDI)), hydrological
106 m3 yr−1 . Similarly, the FAO reports Moldova to produce        (e.g. irrigation water scarcity) and geographic (e.g. land area
46.7 × 10⁶ m3 yr−1 compared to 672.1 × 10⁶ m3 yr−1 by the          and agricultural land) dimensions. The selected predictor
UNSD. In total, reported data for 11 countries were ex-            variables were expected to have a physical basis for corre-
cluded for wastewater production. For wastewater collection        lation with wastewater production, collection, treatment or
and treatment, percentage data were cross-referenced with          reuse. Where appropriate, datasets from these sources were
reported connection rates (i.e. percentage of population con-      combined to produce comparable metrics for countries of dif-
nected to wastewater collection and treatment). Six and seven      ferent populations and geographic sizes (e.g. GDP per capita
countries were excluded for collection and treatment, respec-      in USD per capita and desalination capacity per capita in
tively. For example, the GWI reports a 95.2 % collection rate      m3 yr−1 per capita). Values were taken for the year 2015,
for Azerbaijan, while the UNSD reports that only 32.4 %            where available, or from the closest reporting year when un-
of people are connected to wastewater collection systems.          available. Irrigation water scarcity and desalination capac-
Similarly, the GWI reports a 17 % treatment rate in Hong           ity were taken from 2019 and 2018, respectively. Data were
Kong SAR, whereas the UNSD reports that 93.5 % of peo-             transformed, either using a log or square root transformation,
ple are connected to wastewater treatment plants. No data          to reduce the skew in the independent variables and to ensure
points were excluded for wastewater reuse. In a small number       normality.
of cases where percentage values obtained were marginally             Multiple linear regression was used to predict country-
illogical (i.e. wastewater collection < wastewater treatment;      level wastewater variables (production, collection, treatment

https://doi.org/10.5194/essd-13-237-2021                                             Earth Syst. Sci. Data, 13, 237–254, 2021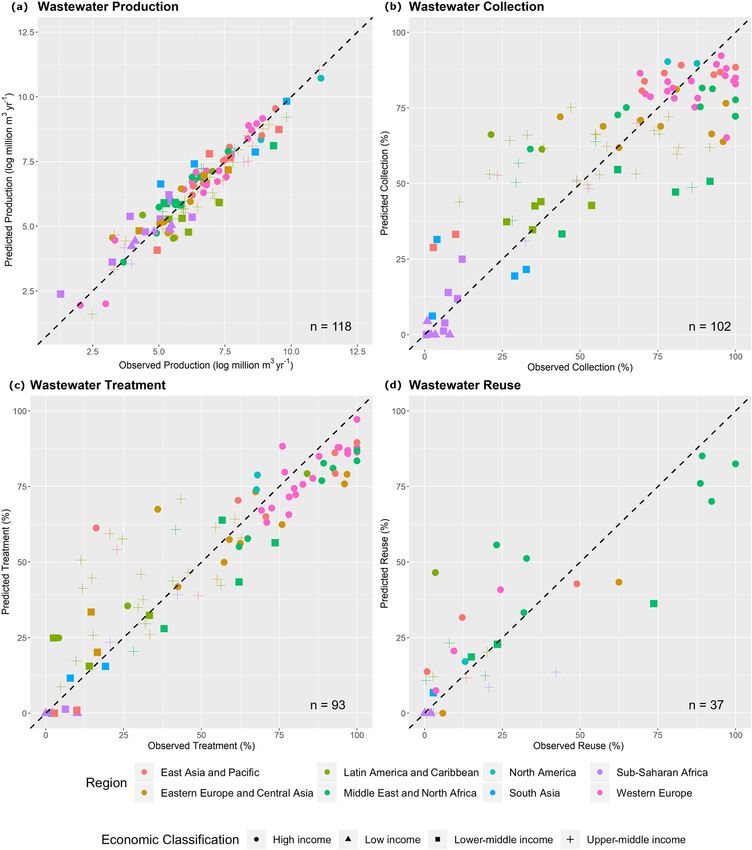
240 E. R. Jones et al.: Country-level and gridded estimates of wastewater production
Table 1. Wastewater data sources and population coverage by regional and economic aspects, including the number of unique countries (in
square brackets). Method for standardisation of wastewater data to 2015 and the method for compiling wastewater data from multiple sources
into a single quantification per country.
Data sourcesa Standardisation Data Regional aspects Economic aspects
to 2015 compiling
method
Region Population Classification Population
coverageb coveragec
Production GWI [94] Divide by GDP Average of North America 100 % [2] High 99.4 % [48]
FAO [98] (USD) in reporting all available Latin America and 93.9 % [19]
year, multiply by sources. Caribbean
UNSD [23] GDP (USD) in Western Europe 99.8 % [19] Upper middle 98.0 % [34]
Eurostat [20] 2015. Middle East 98.8 % [19]
and North Africa
Sub-Saharan Africa 49.6 % [17] Lower middle 94.6 % [31]
South Asia 96.4 % [4]
Eastern Europe and 89.4 % [23] Low 13.3 % [5]
Central Asia
East Asia and Pacific 95.3 % [15]
Collection GWI [95] Divide by GDP per GWI data North America 100 % [2] High 99.4 % [47]
FAO [55] capita (USD per prioritised. Latin America and 96.7 % [20]
capita) in reporting FAO data if Caribbean
year, multiple with unavailable. Western Europe 99.8 % [18] Upper middle 97.7 % [29]
GDP per capita Middle East and 88.3 % [17]
(USD per capita) North Africa
in 2015. Sub-Saharan Africa 61.1 % [13] Lower middle 81.0 % [21]
South Asia 96.4 % [4]
Eastern Europe and 69.9 % [16] Low 34.9 % [5]
Central Asia
East Asia and Pacific 83.6 % [12]
Treatment GWI [76] Divide by GDP per GWI data North America 100 % [2] High 98.4 % [46]
FAO [78] capita (USD per prioritised. Latin America and 90.0 % [17]
capita) in reporting FAO or Caribbean
UNSD [21] year, multiple with UNSD where Western Europe 99.8 % [19] Upper middle 91.2 % [27]
GDP per capita unavail- Middle East and 65.9 % [13]
(USD per capita) able (most North Africa
in 2015. recent re- Sub-Saharan Africa 25.7 % [8] Lower middle 69.4 % [15]
porting year South Asia 95.2 % [3]
prioritised). Eastern Europe and 73.4 % [21] Low 27.1 % [5]
Central Asia
East Asia and Pacific 80.2 % [10]
Reuse GWI [20] Wastewater pro- GWI data North America 90.0 % [1] High 68.7 % [19]
FAO [32] duction normalised prioritised. Latin America and 67.2 % [5]
to reporting year of FAO data if Caribbean
wastewater reuse unavailable. Western Europe 42.5 % [3] Upper middle 77.7 % [10]
based on GDP Middle East and 83.0 % [13]
(USD), percentage North Africa
reuse calculated, Sub-Saharan Africa 21.5 % [6] Lower middle 48.7 % [4]
applied to 2015 South Asia 74.9 % [1]
production data. Eastern Europe and 0.6 % [2] Low 24.8 % [4]
Central Asia
a Abbreviations for the data sources are as follows: Global Water Intelligence (GWI), Food and Agriculture Organization of the United Nations (FAO), United Nations Statistics Department
(UNSD), European Union statistics office (Eurostat). b Data availability per region expressed as a percentage of the total population. Geographic region followed by the total number of countries
per region in square brackets: East Asia and Pacific [38], eastern Europe and Central Asia [30], Latin America and Caribbean [41], Middle East and North Africa [21], North America [3], South
Asia [8], sub-Saharan Africa [48], and western Europe [26]. c Data availability per economic classification expressed as a percentage of the total population. Total number of countries per
economic classification are: high [76], upper-middle [56], lower-middle [52] and low [31] income.
Earth Syst. Sci. Data, 13, 237–254, 2021 https://doi.org/10.5194/essd-13-237-2021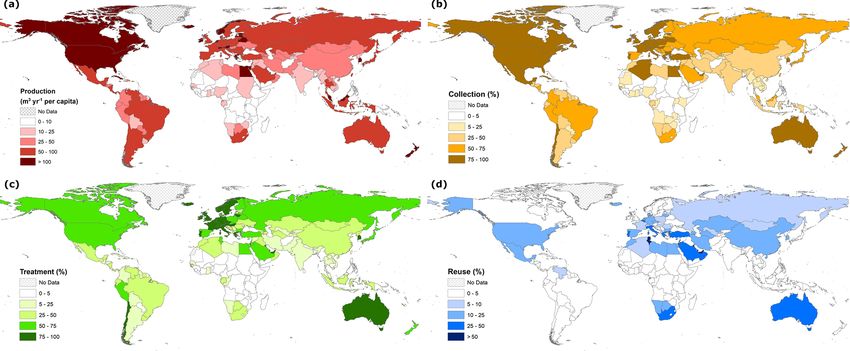
E. R. Jones et al.: Country-level and gridded estimates of wastewater production                                                      241

Figure 1. The wastewater chain (a), including wastewater data availability with number of countries for which wastewater data are available
(b) and the percentage of population coverage (i.e. the proportion of the global population for which wastewater data are available) (c).

and reuse) for countries without reported data. Stepwise                (>USD 12 056 GNI – gross national income – per capita), (2)
elimination was used for feature selection to remove re-                upper-middle income (USD 3896 to USD 12 055), (3) lower-
dundant predictor variables and reduce overfitting. Wastew-             middle income (USD 966 to USD 3895) and (4) low income
ater production was predicted in volumetric flow rate units             ( 100 = 100). Pre-
dicted percentages were subsequently applied to reported or             2.3   Downscaling and validation
predicted values of wastewater production to obtain wastew-
ater collection, treatment and reuse in volumetric flow rate            Country-level wastewater production, collection, treatment
units. Bootstrap regression was used to quantify the uncer-             and reuse data were downscaled to 5 arcmin resolution (∼
tainty in the predictions (by geographic region, economic               10 km at the Equator) based on the sum of averaged an-
classification and at the global scale) at the 95th confidence          nual domestic and industrial return flow data (henceforth “re-
level. In total, 1000 regressions with random sampling and              turn flow”). Return flows represent the water extracted for
replacement were fit to provide predictions at countries lack-          a specific sectoral purpose, but which is not consumed, and
ing data. Wastewater observations were combined with these              hence it returns to and dynamically interacts with surface and
1000 bootstrapped predictions, with the 2.5th and 97.5th con-           groundwater hydrology (de Graaf et al., 2014; Sutanudjaja et
fidence intervals taken as lower and upper confidence limits,           al., 2018). Return flows used for downscaling are calculated
respectively.                                                           as gross − net water demands from the Water Futures and
   Wastewater data (reported and predicted) are at the na-              Solutions (WFaS) initiative for the years 2000–2010 (Wada
tional level, for the 215 countries as listed by the World              et al., 2016). The WFaS water demand dataset follows the
Bank (https://data.worldbank.org/country, last access: 5 Jan-           approach developed for PCR-GLOBWB (PCRaster Global
uary 2020). Wastewater data are also aggregated to eight ge-            Water Balance; Wada et al., 2014). Domestic return flows
ographic regions based on the World Bank regional classi-               only occur where the urban and rural populations have access
fications: (1) East Asia and Pacific, (2) eastern Europe and            to water, whereas industrial return flows occur from all areas
Central Asia, (3) Latin America and Caribbean, (4) Middle               where water is withdrawn (Wada et al., 2014). Both domestic
East and North Africa, (5) North America, (6) South Asia, (7)           and industrial return flows are dependent on country-specific
sub-Saharan Africa, and (8) western Europe. Furthermore,                recycling ratios based on GDP and the level of economic de-
data are also aggregated to four economic classifications               velopment (Wada et al., 2011, 2014).
based on the World Bank Atlas method: (1) high income                      Grid cell return flow was divided by the country’s to-
                                                                        tal return flow to obtain the fraction per grid cell. Wastew-

https://doi.org/10.5194/essd-13-237-2021                                                   Earth Syst. Sci. Data, 13, 237–254, 2021
242 E. R. Jones et al.: Country-level and gridded estimates of wastewater production
Table 2. Data sources of predictor variables for wastewater production, collection, treatment and reuse regression analysis.
Data source Predictor variable Year Link
World Bank Land area (km2 ) 2015 https://data.worldbank.org/indicator/AG.LND.TOTL.K2 (last access: 5
January 2020)
Total population (millions) 2015 https://data.worldbank.org/indicator/sp.pop.totl (last access: 5 January
2020)
Urban population (%) 2015 https://data.worldbank.org/indicator/SP.URB.TOTL (last access: 5 Jan-
uary 2020)
GDP (billion USD) 2015 https://data.worldbank.org/indicator/NY.GDP.MKTP.CD (last access: 5
January 2020)
Access to basic sanitation (%) 2015 https://data.worldbank.org/indicator/SH.STA.BASS.ZS (last access: 5
January 2020)
Mortality rate attributed to unsafe 2015 https://data.worldbank.org/indicator/SH.STA.WASH.P5 (last access: 5
water, sanitation and hygiene January 2020)
Access to internet (%) 2015 https://data.worldbank.org/indicator/it.net.user.zs (last access: 5 Jan-
uary 2020)
Access to electricity (%) 2015 https://data.worldbank.org/indicator/EG.ELC.ACCS.ZS (last access: 5
January 2020)
People practicing open defeca- 2015 https://data.worldbank.org/indicator/SH.STA.ODFC.ZS (last access: 5
tion (%) January 2020)
Agricultural land (%) 2015 https://data.worldbank.org/indicator/AG.LND.AGRI.ZS (last access: 5
January 2020)
Fertiliser consumption (kg ha−1 2015 https://data.worldbank.org/indicator/ag.con.fert.zs (last access: 5 Jan-
arable land) uary 2020)
Renewable internal water 2015 https://data.worldbank.org/indicator/ER.H2O.INTR.K3 (last access: 5
resources (109 m3 ) January 2020)
United Nations Human Development Index (−) 2015 https://dasl.datadescription.com/datafile/hdi-2015/ (last access: 5 Jan-
Development uary 2020)
Programme
World Baseline irrigation water 2019 https://www.wri.org/resources/data-sets/
Resources scarcity (−) aqueduct-30-country-rankings (last access: 5 January 2020)
Institute
Global Water Desalination capacity 2018 https://www.desaldata.com/ (last access: 5 January 2020) as synthe-
Intelligence (106 m3 yr−1 ) sised in Jones et al. (2019)
ater production was downscaled directly proportionally to of water demand to water availability was calculated. Grid
return flows by multiplying the grid cell return flow frac- cells within a country with a treated-wastewater allocation
tion per grid cell with wastewater production at the country are then ordered based off this ratio, and treated-wastewater
level. Wastewater collection is assigned sequentially to grid reuse was assigned sequentially to these grid cells.
cells with the largest downscaled produced wastewater flows. The location and design capacity of individual wastew-
Thus, collected wastewater is preferentially allocated to grid ater treatment plants were used to validate the downscaled
cells with the highest levels of municipal activities, where wastewater treatment data. Reported data for 25 901 wastew-
central wastewater collection (and treatment) is assumed to ater treatment plants located across Europe were obtained
be most economically feasible. Wastewater treatment is as- from the European Environment Agency (EEA, 2019). Data
signed to grid cells only where wastewater collection ex- for a further 4283 wastewater treatment plants were obtained
ists, at an average treatment rate calculated at the country for the contiguous United States from the US Environmen-
level. The treatment rate is calculated as the proportion of tal Protection Agency (US EPA, 2020). An additional 478
collected wastewater that undergoes treatment and, hence, wastewater treatment plants, distributed globally (excluding
can differ from the country-level wastewater treatment per- Europe and the US), were extracted from the GWI wastew-
centage (which is calculated as the proportion of produced ater database (GWI, 2015). For EEA and GWI wastewater
wastewater that is treated). For the downscaling of wastewa- treatment plants, treatment capacity reported only in popula-
ter reuse an additional criterion was introduced to represent tion equivalent (PE) was approximated in volume flow rate
water scarcity, a key driver of wastewater reuse. The ratio units based on the linear regression obtained for wastewater
Earth Syst. Sci. Data, 13, 237–254, 2021 https://doi.org/10.5194/essd-13-237-2021E. R. Jones et al.: Country-level and gridded estimates of wastewater production 243
treatment plants reporting capacity in both population equiv- or excluded data representing 10 %, 14 %, 22 % and 40 % of
alent and volume flow rate (EEA: R 2 = 0.80, p < 0.001; the global population for wastewater production, collection,
GWI: R 2 = 0.81, p < 0.001). Wastewater treatment plants treatment and reuse, respectively.
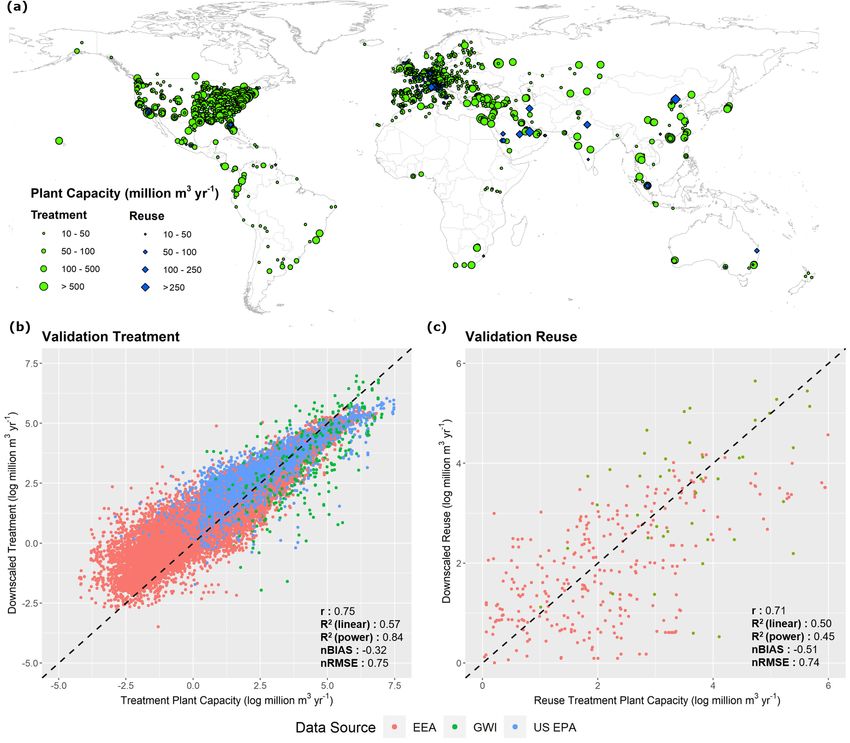
were assigned to their nearest grid cell, and treatment capac- Wastewater production was best predicted based on total
ities were aggregated per cell. In total, wastewater treatment population, GDP per capita and access to basic sanitation. A
data were available for 22 133 unique grid cells. For validat- significant regression equation was found (p < 0.001) with
ing downscaled wastewater reuse, only plants (with treatment an adjusted R 2 value of 0.89, with all predictor variables
capacity > 1 × 10⁶ m3 yr−1 ) using tertiary or higher wastew- also significant at the p < 0.001 level. While the number of
ater treatment technologies were considered. In total, 572 people within a country was found to have the strongest in-
wastewater treatment plants in the EEA database met this cri- fluence on total wastewater production (β = 0.96), the av-
terion. A further 78 wastewater treatment plants, which are erage economic output per inhabitant (β = 0.31) and the
specifically designated as wastewater reuse facilities, were level of access to wastewater services (β = 0.19), such as
sourced from the GWI database. In total, wastewater reuse flushing toilets to piped sewers, are important for determin-
data were available for 601 grid cells. Downscaled wastewa- ing the amount of wastewater produced per capita. These
ter treatment and reuse were compared to wastewater design three factors therefore account for the combined effect of
capacities. population size and variations in wastewater production per
To account for the large variation in the treatment ca- capita linked to economic and development factors in deter-
pacities of wastewater treatment plants considered, in addi- mining total wastewater production in a country. Compar-
tion to the geographical mismatch between where wastewa- ing observed with predicted total wastewater production data
ter is produced and treated (i.e. wastewater treatment plants demonstrates the overriding importance of a country’s pop-
are typically located on the outskirts of urban areas), vali- ulation, with wastewater production spread across multiple
dation occurred at differing geographical scales. Wastewater orders of magnitude for countries irrespective of geographi-
treatment plant capacity was divided by wastewater produc- cal region or economic classification (Fig. 2a).
tion per capita to approximate the number of people that the Wastewater collection was predicted (adjusted R 2 = 0.69,
wastewater treatment plant serves. If the population served p < 0.001) based on the Human Development Index (HDI),
by a wastewater plant exceeds the grid cell population, the urban population and wastewater production per capita. HDI,
validation extent was expanded to the directly neighbouring an overarching proxy for the level of development, was found
cells. This is allowed to occur, until the population served by to be the strongest influence over wastewater collection (β =
the treatment plant is reached, only up to a maximum of three 0.50, p < 0.001). Urban population (β = 0.14, p < 0.01)
iterations, reflecting a radius of ∼ 30 km around the wastew- and wastewater production per capita (β = 0.25, p < 0.01)
ater treatment plant. The total downscaled wastewater treated were also significant but less important predictor variables
over the extended area was then compared to that of the treat- of wastewater collection. For urban populations, a greater
ment plant. proportion of a population living in urban areas resulted in
To quantify the performance of the downscaling ap- higher collection rates for the country, while higher levels
proaches, the root-mean-square error (RMSE) and mean bias of wastewater production per capita corresponded to larger
(BIAS) were calculated. Normalised values of RMSE and collection rates. The observed versus predicted wastewater
BIAS were calculated (nRMSE and nBIAS) by dividing by collection rates are depicted in Fig. 2b, which displays the
the standard deviation of the wastewater treatment plant ca- trend across different geographic zones and economic classi-
pacity. Pearson’s (r) coefficients were calculated to quantify fications.
the linear dependence, with R 2 values based on both the lin- Wastewater treatment was predicted (adjusted R 2 = 0.80,
ear and log–log relationship between downscaled and ob- p < 0.001) based on GDP per capita (β = 0.28, p < 0.01)
served values also being calculated. and wastewater collection (β = 0.66, p < 0.01). Countries
with larger economic outputs per capita likely have more re-
sources for wastewater treatment, resulting in higher overall
3 Results
treatment rates. As wastewater treatment is dependent upon
3.1 Regression and country-level predictions
wastewater collection, countries with higher wastewater col-
lection rates typically also treat a greater proportion of their
The results of the regression analysis for wastewater produc- wastewater. Observed versus predicted wastewater treatment
tion, collection, treatment and reuse are summarised in Ta- rates are displayed in Fig. 2c.
ble 3. All regression models were significant at the p < 0.001 The amount of wastewater treated will determine the max-
level with adjusted R 2 values ranging between 0.61 and 0.89. imum potential for treated-wastewater reuse within a coun-
Country-level observed versus simulated wastewater produc- try. Water scarcity, particularly when driven by high irriga-
tion (log 106 m3 yr−1 ), collection (%), treatment (%) and tion water demands, is also a primary driver of wastewater
reuse (%) data are displayed in Fig. 2. The regression equa- reuse (Garcia and Pargament, 2015). To account for this re-
tions were applied for 97, 113, 122 and 178 countries with no lationship, the fraction of wastewater undergoing treatment
https://doi.org/10.5194/essd-13-237-2021 Earth Syst. Sci. Data, 13, 237–254, 2021244 E. R. Jones et al.: Country-level and gridded estimates of wastewater production
Table 3. Wastewater production, collection, treatment and reuse multiple linear regression results.
Regression Explanatory variables (units) B (SE B) β p Adjusted R 2
model
Production Intercept (−) −1.68 (0.45) 0.31 ** 0.89**
(log) GDP (log USD yr−1 per capita) 0.45 (0.06) 0.96 **
Population (log millions) 1.02 (0.03) 0.19 **
Access to basic sanitation (%) 0.02 (0.00) **
Collection Intercept (−) −80.73 (11.06) 0.50 ** 0.69**
Human Development Index (−) 120.82 (26.94) 0.14 **
Urban population (%) 0.22 (0.13) 0.25 .
Wastewater production (log m3 yr−1 per 8.01 (2.97) *
capita)
Treatment Intercept (−) −61.32 (14.06) 0.66 * 0.80**
Wastewater collection (%) 0.72 (0.08) 0.28 *
GDP (log USD yr−1 per capita) 7.2 (1.88) *
Reuse Intercept (−) −5.29 (4.59) 0.29 0.26 0.70**
(primary) Desalination capacity (sqrt m3 yr−1 per 1.50 (0.78) 0.60 .
capita) 13.66 (3.50) *
Treated wastewater for irrigation water
scarcity alleviation (−)
Reuse Intercept (−) −4.11 (6.10) 0.63 0.50 0.61**
(alternate) Desalination capacity (sqrt m3 yr−1 per 3.22 (0.63) 0.24 *
capita) 0.23 (0.12) .
Treated wastewater (%)
B indicates unstandardised regression weights; SE B indicates the standard error of B ; β indicates standardised regression weights. Significance level represented by
“**” (p < 0.001), “*” (p < 0.01), “.” (p < 0.1) or as stated numerically.
processes and irrigation water scarcity was multiplied to give 3.2 Global wastewater production, collection, treatment
an integrated metric indicating the “availability of treated and reuse
wastewater for irrigation water scarcity alleviation”. Wastew-
ater reuse was predicted (adjusted R 2 = 0.70, p < 0.001)
Globally, this study estimates that 359.4 × 10⁹ m3 yr−1
from this metric (β = 0.60, p < 0.01) in combination with
(358.0 × 10⁹ –361.4 × 10⁹ m3 yr−1 ) of wastewater is pro-
the desalination capacity per capita (β = 0.29, p < 0.1), as
duced annually, with a global average of 49.0 m3 yr−1 (48.8–
an indicator of the prevalence of unconventional water re-
49.2 m3 yr−1 ) per capita. Global annual wastewater col-
sources in a country. The observed versus predicted wastew-
lection and treatment is estimated at 225.6 × 10⁹ m3 yr−1
ater reuse rates from this regression are displayed in Fig. 2d.
(224.4 × 10⁹ –226.9 × 10⁹ m3 yr−1 ) and 188.1 × 10⁹ m3 yr−1
Irrigation water scarcity data were unavailable for 53 coun-
(186.6 × 10⁹ –189.3 × 10⁹ m3 yr−1 ), respectively. These val-
tries, mostly small island nations. Here an alternate regres-
ues indicate that approximately 63 % and 52 % of globally
sion model was constructed based on desalination capacity
produced wastewater is collected and treated, respectively,
per capita (β = 0.63, p < 0.01) and wastewater treatment
with approximately 84 % of collected wastewater undergo-
(β = 0.24, p < 0.1) only, resulting in a slightly lower ex-
ing a treatment process. Wastewater reuse is estimated at
plained variance (R 2 = 0.61). While these countries repre-
40.7 × 10⁹ m3 yr−1 (37.2 × 10⁹ –47.0 × 10⁹ m3 yr−1 ), repre-
sentE. R. Jones et al.: Country-level and gridded estimates of wastewater production 245 Figure 2. Observed versus predicted wastewater production (a), collection (b), treatment (c) and reuse (d) from regression analysis. from predicted values using regression. This occurs both due terms (m3 yr−1 per capita for production; percentage of pro- to the high population coverage and due to the missing data duced wastewater for collection, treatment and reuse), facili- primarily being from developing countries, where wastewa- tating direct comparisons between countries. ter production per capita and percentage collection and treat- Substantial differences in wastewater production, collec- ment rates are lower. The global quantification of wastewa- tion, treatment and reuse occur across different geographic ter reuse relies more heavily on predicted values, constitut- regions and by the level of economic development. Wastew- ing 23.4 % of reuse volume globally. This occurs primarily ater production per capita is notably highest in North Amer- due to poor data availability, particularly in countries with ica at 209.5 m3 yr−1 per capita, over double that of western large populations in eastern Europe and Central Asia (e.g. Europe (91.7 m3 yr−1 per capita), the next highest produc- Russia, Turkey and Poland) and western European countries, ing region per capita. When considering individual coun- where wastewater treatment rates are generally high but the tries in these regions, the USA (211 m3 yr−1 per capita) proportion of wastewater reused relies on simulations (e.g. and Canada (198 m3 yr−1 per capita), in addition to small, Germany, Italy and Greece). prosperous European countries (e.g. Andorra at 257 m3 yr−1 Table 4 displays wastewater production per capita per capita, Austria at 220 m3 yr−1 per capita and Monaco (m3 yr−1 per capita) and wastewater production, collection, at 203 m3 yr−1 per capita), are the highest producers per treatment and reuse (109 m3 yr−1 ), aggregated from the coun- capita. Comparatively, the larger western European coun- try data (reported + simulated) at the global scale and by re- tries have lower wastewater production per capita, with Ger- gion and level of economic development. Figure 3 displays many, the UK and France at 92, 92 and 66 m3 yr−1 per wastewater data plotted at the country scale in proportional capita, respectively. Conversely, most sub-Saharan African https://doi.org/10.5194/essd-13-237-2021 Earth Syst. Sci. Data, 13, 237–254, 2021
246                                           E. R. Jones et al.: Country-level and gridded estimates of wastewater production

Table 4. Wastewater production, collection, treatment and reuse (109 m3 yr−1 ) by region and level of economic development. The numbers
in parentheses display the prediction uncertainty (2.5th and 97.5th confidence limits, in 109 m3 yr−1 ) on the totals based on the results of
1000 bootstrap regressions with random sampling and replacement.

                                    Global             Production       Production       Collection        Treatment          Re-use
                            Population (%)    (m3 yr−1 per capita)   (109 m3 yr−1 )   (109 m3 yr−1 )   (109 m3 yr−1 )   (109 m3 yr−1 )
      Global                           100                    49.0           359.4            225.6            188.1             40.7
                                                       (48.8–49.2)   (358.0–361.4)    (224.4–226.9)    (186.6–189.3)      (37.2–47.0)
      Geographic region
      North America                     4.9                 209.5             74.7             59.1             50.6               9.1
                                                    (209.5–209.5)      (74.7–74.7)      (59.1–59.1)      (50.6–50.6)         (8.8–9.5)
      Latin America and                 8.5                   67.6            42.1             25.2             15.4               2.1
      Caribbean                                        (67.3–67.9)     (41.9–42.3)      (25.2–25.2)      (15.2–15.5)         (2.0–2.5)
      Western Europe                    5.7                   91.7            38.5             33.7             33.0               6.7
                                                       (91.7–91.8)     (38.4–38.5)      (33.7–33.7)      (33.0–33.0)         (4.1–9.5)
      Middle East and                   5.8                   51.4            21.9             16.1             11.4               6.1
      North Africa                                     (51.3–51.5)     (21.8–21.9)      (16.1–16.2)      (11.2–11.5)         (6.0–6.2)
      Sub-Saharan                      13.6                   11.0            11.0               2.5             1.8               1.6
      Africa                                           (10.1–12.4)     (10.1–12.4)         (2.5–2.6)       (1.7–1.9)         (1.6–1.8)
      South Asia                       23.8                   14.6            25.6               7.8             4.0               0.5
                                                       (14.5–14.7)     (25.4–25.7)         (7.8–7.8)       (4.0–4.1)         (0.5–0.8)
      Eastern Europe and                6.6                   57.9            28.2             18.4             14.9               2.6
      Central Asia                                     (57.2–58.8)     (27.8–28.6)      (18.2–18.7)      (14.7–15.1)         (1.3–4.4)
      East Asia and                    31.1                   51.5           117.6             62.8             57.0             11.9
      Pacific                                          (51.5–51.7)   (117.3–117.9)      (61.9–63.8)      (56.1–57.8)      (11.7–13.5)
      Economic classification
      High                             16.1                 126.0            149.1            121.7            110.4             21.2
                                                    (125.9–126.2)    (149.0–149.3)    (121.6–121.7)    (110.4–110.5)      (19.1–24.9)
      Upper middle                     34.8                   54.7           139.5             74.8             60.2             15.1
                                                       (54.5–54.8)   (139.1–139.9)      (74.6–74.9)      (59.7–60.6)      (13.9–16.9)
      Lower middle                     40.5                   22.5            66.8             28.8             17.3               4.4
                                                       (22.3–22.6)     (66.4–67.4)      (27.7–29.9)      (16.2–18.2)         (3.6–5.7)
      Low                               8.6                    6.4              4.0              0.4             0.2               0.0
                                                         (5.0–8.5)        (3.2–5.3)        (0.3–0.4)       (0.1–0.2)         (0.0–0.1)

countries produce less than 10 m3 yr−1 per capita. Wastew-               wastewater production. Wastewater production also varies
ater production values are comparable to the World Health                greatly with level of economic development. The prominent
Organization’s absolute minimum water requirements for                   discrepancies between economic classifications indicate a
survival of 2.7 m3 yr−1 per capita (WHO, 2011) in coun-                  strong relationship between wealth and wastewater produc-
tries such as Niger (2.7 m3 yr−1 per capita), Burkina Faso               tion regardless of geographic location. Wastewater produc-
(3.4 m3 yr−1 ) and Ethiopia (4.2 m3 yr−1 per capita). Aggre-             tion per capita more than doubles at each income classifica-
gated for the region, sub-Saharan Africa produces approx-                tion level from low income (6.4 m3 yr−1 per capita) to high
imately 20 times less wastewater than North America per                  income (126.0 m3 yr−1 per capita). With respect to popula-
capita, at 11.0 m3 yr−1 per capita.                                      tion size, people living in high-income countries (∼ 16 %
   In volumetric flow rate terms, the East Asia and Pacific              global population) produce ∼ 42 % of global wastewater,
region produces the most wastewater (117.6 × 10⁹ m3 yr−1 ),              compared to low- and lower-middle-income countries (∼
coinciding with the largest population share (∼ 31 %). Con-              50 % global population) producing ∼ 20 % of global wastew-
versely, South Asia produces just ∼ 7 % of global wastewater             ater.
despite a population share of ∼ 24 %, whereas the ∼ 5 % of                  Wastewater collection and treatment rates are highest in
people living in North America account for ∼ 20 % of global              western Europe (88 % and 86 %, respectively) and lowest in

Earth Syst. Sci. Data, 13, 237–254, 2021                                                    https://doi.org/10.5194/essd-13-237-2021
E. R. Jones et al.: Country-level and gridded estimates of wastewater production 247
Figure 3. Wastewater production (m3 yr−1 per capita) (a), collection (%) (b), treatment (%) (c) and reuse (%) (d) at the country scale.
South Asia (31 % and 16 %, respectively) and sub-Saharan eas with low wastewater treatment rates, such as sub-Saharan
Africa (23 % and 16 %, respectively). Wastewater collection Africa and South Asia. In addition, treated-wastewater reuse
is notably low in the East Asia and Pacific region, where total is also low in areas with sufficient availability of conventional
wastewater production is high. Conversely, wastewater col- water resources such as across Scandinavia (where reuse is
lection in the Middle East and North Africa region is rela- < 5 %).
tively high at 74 %, likely resulting from the lack of renew- In volumetric flow rate terms, intentional treated-
able water supplies. Wastewater treatment percentages fol- wastewater reuse is estimated to be largest in the East Asia
low similar regional patterns. Notably, wastewater treatment and Pacific region (11.9 × 10⁹ m3 yr−1 ) and North Amer-
is substantially lower than wastewater collection in the Latin ica (9.1 × 10⁹ m3 yr−1 ) and lowest in South Asia (0.5 ×
America and Caribbean and South Asia regions, potentially 109 m3 yr−1 ) and sub-Saharan Africa (1.6 × 10⁹ m3 yr−1 ).
indicative of high rates of untreated-wastewater reuse in Conversely the Middle East and North Africa (27.8 %) and
these regions. Wastewater collection and treatment percent- western Europe (17.5 %) dominate in percentage terms.
ages follow similar patterns as wastewater production with In volumetric flow rate units, the Middle East and North
respect to income level, with high-income countries collect- Africa (15 %) and western Europe (16 %) account for al-
ing and treating the majority of their wastewater (82 % and most a third of treated-wastewater reuse globally, despite
74 %, respectively) down to low-income countries with small only accounting for 5.8 % and 5.7 % of the global popula-
collection and treatment rates (9 % and 4 %, respectively). tion, respectively. Approximately half (52 %) of intentional
The proportion of collected wastewater being treated also de- treated-wastewater reuse occurs in high-income countries,
creases with income level, at 91 %, 73 %, 60 % and 47 % for with 37 % from upper-middle-income countries. Intentional
high-, upper-middle-, lower-middle- and low-income classi- treated-wastewater reuse is contingent upon the availabil-
fications, respectively. The fact that 40 % and 53 % of col- ity of treated-wastewater resources, which is typically more
lected wastewater is untreated in the lower-middle- and low- prevalent in high-income countries (who both produce more
income classifications, respectively, may also be indicative wastewater per capita and treat a higher percentage of the
of the higher prevalence of intentional untreated-wastewater resource). However, the proportion of treated wastewater in-
reuse (whereby collected wastewater is reused without un- tentionally reused is higher in the upper-middle- (25 %) and
dergoing treatment). lower-middle-income (25 %) groups than in the high-income
High utilisation of treated-wastewater reuse occurs pre- group (19 %).
dominantly in the Middle East and North Africa, with the
United Arab Emirates, Kuwait and Qatar reusing more than
80 % of their produced wastewater. Water-scarce small is- 3.3 Gridded wastewater production, collection,
land developed countries, including the Cayman Islands, US treatment and reuse
Virgin Islands and Malta also have high rates of intentional
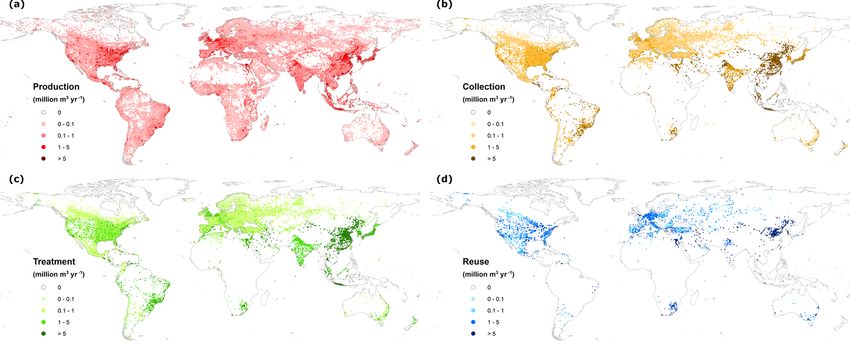
Figure 4 displays gridded wastewater production, collection,
treated-wastewater reuse of 78 %, 75 % and 67 %, respec-
treatment and reuse, allowing for the identification of hotspot
tively. Treated-wastewater reuse is prohibitively low in ar-
regions and zones at 5 arcmin resolution. Wastewater pro-
https://doi.org/10.5194/essd-13-237-2021 Earth Syst. Sci. Data, 13, 237–254, 2021248 E. R. Jones et al.: Country-level and gridded estimates of wastewater production
duction occurs across the globe, with hotspots coinciding be accessed at https://doi.org/10.1594/PANGAEA.918731
with the largest metropolitan areas (e.g. Tokyo and Mum- (Jones et al., 2020).
bai) where the largest concentration of domestic and indus-
trial activities occurs (Fig. 4a). In contrast, wastewater pro-
duction is close to zero in world regions with low concen- 5 Discussion and conclusions
trations of people and industrial activities, such as the Sa-
hara, inland Australia and the high-latitude climate zones This study aimed to develop a consistent and comprehensive
(e.g. northern Canada and Russia). In countries where mu- spatially explicit assessment of global domestic and indus-
nicipal activities are heavily concentrated in a small num- trial wastewater production, collection, treatment and reuse
ber of cities, such as in the Middle East and Australia, small for the reference year of 2015. Multiple linear regression
clusters of grid cells with very high wastewater production models using a diverse set of social, economic, geographic
(> 5 × 10⁶ m3 yr−1 ) occur. Wastewater collection (Fig. 4b) and hydrological datasets were fit for country-level wastewa-
and treatment (Fig. 4c) are typically more concentrated in ter data collated for a variety of sources. These relationships
urban areas within individual countries. This is particularly applied for predictions of wastewater production, collection,
prominent in South America and sub-Saharan Africa. Con- treatment and reuse for countries where data were unavail-
versely, downscaled wastewater collection and treatment re- able. Bootstrapping with random sampling and replacement
flect wastewater production in regions where wastewater col- was employed to quantify prediction uncertainty. It should be
lection and treatment rates are very high, such as western Eu- noted that bootstrapping only accounts for uncertainty in the
rope and Scandinavia. Wastewater reuse is constrained to the regression terms, not for uncertainties in the underpinning
lowest area (number of grid cells), being concentrated in re- source data. Uncertainties associated with wastewater obser-
gions where treated-wastewater resources are available and vations are not accounted for in this study, despite likely be-
where water scarcity issues are of particular concern. ing substantial. Nevertheless, this study represents the first
Figure 5a displays the global distribution of the wastew- attempt to simultaneously analyse wastewater production,
ater treatment plants and designated wastewater reuse sites collection, treatment and reuse for all countries across the
considered in this study. Plant capacities were compared globe. While agricultural runoff is also a substantial source
to downscaled quantifications for validation of wastewater of pollution, this is outside the scope of this study. Country-
treatment (Fig. 5b) and wastewater reuse (Fig. 5c). Over- level data on agricultural runoff were sparse, necessitating
all, a reasonable performance is obtained at most wastew- modelling approaches to quantify irrigation return flow by
ater treatment and reuse plants with linear R 2 values of calculating net demand (e.g. based on crop composition and
0.57 (p < 0.001) and 0.50 (p < 0.001), respectively. The ob- irrigated area per grid cell), gross irrigation demand (to ac-
served negative normalised biases suggest that downscaled count for irrigation efficiency and losses) and water with-
wastewater treatment (−0.32) and reuse (−0.51) were un- drawals (Sutanudjaja et al., 2018). Agricultural runoff is also
derestimated with respect to the observed treatment capac- rarely collected or treated (UNEP, 2016) and, hence, is less
ities. This may occur due to discrepancies between the de- applicable for inclusion in this study.
sign (i.e. maximum) capacity of wastewater treatment plants, Our global quantification of wastewater production of
which is commonly the capacity that is reported, versus the 359.4 × 10⁹ m3 yr−1 (358.0 × 10⁹ –361.4 × 10⁹ m3 yr−1 ) is
actual treated-wastewater volumes. Factors such as the con- broadly in accordance with previous quantifications, such as
struction year of wastewater treatment plant are important, as 380 × 109 m3 yr−1 quantified based on reported data and ur-
plants are constructed to be larger than current requirements ban population (Qadir et al., 2020) and 450 × 109 m3 yr−1
in anticipation of future increases in wastewater flows. Fur- quantified by modelling of return flows in WaterGAP3
thermore, uncertainties in the data used as basis for down- (Water – Global Analysis and Prognosis; Flörke et al.,
scaling wastewater production (i.e. PCR-GLOBWB return 2013). Few studies were found analysing the global state
flows) directly impacts the downscaled results of wastewater of wastewater collection, treatment and reuse. Our quan-
treatment. For example, the underprediction of return flows tification of wastewater collection, which is estimated at
in urban areas and overprediction in rural areas could lead to 225.6 × 10⁹ m3 yr−1 (224.4 × 10⁹ –226.9 × 10⁹ m3 yr−1 ), can
the overprediction of wastewater treatment in areas without give an important indication of the amount of collected
treatment plants and underprediction of wastewater treatment wastewater that goes untreated. At the global scale, this study
for grid cells with large treatment capacities. estimates that wastewater treatment is 188.1 × 10⁹ m3 yr−1
(186.6 × 10⁹ –189.3 × 10⁹ m3 yr−1 ), or 52 % of the produced
wastewater. By extension, 48 % of produced wastewater is
released to the environment without treatment (either directly
4 Data availability or following collection). This is substantially lower than the
commonly cited statistic that ∼ 80 % of global wastewater
The country-level and spatially explicit (5 arcmin) wastewa- is released to the environment without treatment (WWAP,
ter production, collection, treatment and reuse datasets can 2017; UNESCO, 2017). Our quantifications of wastewater
Earth Syst. Sci. Data, 13, 237–254, 2021 https://doi.org/10.5194/essd-13-237-2021E. R. Jones et al.: Country-level and gridded estimates of wastewater production 249 Figure 4. Gridded wastewater production (a), collection (b), treatment (c) and reuse (d) (106 m3 yr−1 ) at 5 arcmin spatial resolution. Figure 5. Global distribution of wastewater treatment plants and designated wastewater reuse sites (a) and validation of downscaling ap- proach for wastewater treatment (b) and wastewater reuse (c). treatment must be treated with caution however – particularly timates. Similarly, wastewater plants may be entirely non- in the developing world – as wastewater treatment plants functional (mothballed) due to a lack of funding and main- typically operate at capacities below the installed (and usu- tenance or have unsuitable treatment processes for the in- ally reported) capacities (Mateo-Sagasta et al., 2015; Mur- coming wastewater, yet the associated wastewater volumes ray and Drechsel, 2011) that are used for country-level es- are still reported as treated (Qadir et al., 2010). Therefore, https://doi.org/10.5194/essd-13-237-2021 Earth Syst. Sci. Data, 13, 237–254, 2021
250                                         E. R. Jones et al.: Country-level and gridded estimates of wastewater production

it is possible that the actual treated volume of wastewater is     be approximately 10 times greater than intentional treated-
somewhat below our estimated 52 % and that the proportion          wastewater reuse (Scott et al., 2010).
of collected wastewater which is not treated could far exceed         This study sought to downscale country-level wastew-
16 %. “Wastewater treatment” is also a generic term that may       ater estimates to spatially explicit (grid-based) quantifica-
refer to any form of wastewater treatment regardless of level      tions for purposes such as large-scale water resource as-
(e.g. primary, secondary or tertiary), which this study does       sessments and water quality modelling. Wastewater produc-
not attempt to distinguish between. This is due to different       tion has previously been quantified based only on simulated
data sources reporting different levels of treatment, for in-      return flows in hydrological models (Flörke et al., 2013).
stance with the GWI only reporting secondary treatment or          We instead used the proportions of simulated return flows
above, while FAO AQUASTAT also includes primary treat-             to downscale country-based volumes of wastewater produc-
ment.                                                              tion. Our results also represent the first efforts to quantify
    In percentage terms, wastewater treatment by economic          global wastewater collection, treatment and reuse at the sub-
classification is broadly in line with previous work (Sato         national level. Our validation results suggest that our down-
et al., 2013), which estimates wastewater treatment to be          scaled estimates of wastewater treatment and reuse are, in
70 %, 38 %, 28 % and 8 % for high-income, upper-middle-            general, realistic. However, a number of uncertainties should
income, lower-middle-income and low-income countries, re-          also be considered. Firstly, our downscaling for wastewa-
spectively, compared to our quantifications of 74 %, 43 %,         ter production inherently relies on the ability to accurately
26 % and 4.2 %. While similar, these estimations could po-         simulate domestic and industrial return flows and, hence,
tentially indicate that percentage collection and treatment        on the methodology for calculating gross and net water de-
have increased in the developed world but have decreased           mand (Wada et al., 2014). As we downscale using the re-
in the developing world. This could be caused by wastew-           turn flows proportionally, accurate spatial disaggregation of
ater production, particularly in the developing world, rising      return flows is more important than the absolute simulated
at a faster pace than the development of collection infras-        flow volumes. The accuracy of downscaled wastewater col-
tructure and treatment facilities (Sato et al., 2013). It should   lection relies on the assumption that this preferentially occurs
be noted that while the aim of wastewater collection and           in areas where wastewater production is highest. Due to the
treatment is to reduce pollutant loadings to minimise risks to     high capital costs of wastewater treatment plants, combined
human health and the environment, these facilities can also        with economies of scale, we deem this a logical assump-
act as point sources of pollution. Wastewater collection con-      tion (Hernández-Chover et al., 2018; Hernandez-Sancho et
centrates pollutants which can pose serious water quality is-      al., 2011). Lacking more detailed information on the spa-
sues if discharged with insufficient treatment. Furthermore,       tial variance in wastewater collection compared to treatment,
a range of emerging pollutants (e.g. pharmaceuticals, pesti-       we assume an equal wastewater treatment rate across all
cides and industrial chemicals) are concentrated in wastew-        cells that have a collected wastewater allocation. Wastewater
ater collection networks (Geissen et al., 2015). These pol-        reuse is downscaled with the only additional criteria being
lutants are of particular concern, as they are not typically       an indicator of water scarcity. While water scarcity is an im-
monitored for or sufficiently removed in wastewater treat-         portant driver of wastewater reuse, site-specific social, eco-
ment processes, with ambiguous risks posed to human and            nomic and political factors will also have a large influence
environmental health even in low concentrations (Deblonde          on the viability of wastewater reuse on a case-by-case basis
et al., 2011; Geissen et al., 2015). The solution is not how-      (WWAP, 2017). Accounting for these factors is outside the
ever to collect less wastewater but to increase treatment in       scope of this study. Furthermore, uncertainties in the valida-
terms of percentage of collected wastewater, treatment level       tion datasets, both in terms of treatment capacity and geo-
and the number of pollutants (UNEP, 2016).                         graphical location, must also be recognised. Overall, due to
    The drivers behind wastewater reuse are a complex mix-         the global scale of this work and the available data for vali-
ture of social, economic, geographic and hydrological fac-         dation, we purposely opt for more simple and parsimonious
tors, and data are highly limited globally. Nevertheless, this     approaches where possible.
study represents the first attempt to quantify intentional            This study did not target acreage in its considerations of
treated-wastewater reuse at the country scale. It should be        wastewater reuse, which has been a common method in pre-
noted that this study does not aim to quantify either de facto     vious work. For example, estimates made a decade ago sug-
(unintentional) treated-wastewater reuse or any form (inten-       gest that up to 200 million farmers practice wastewater ir-
tional or unintentional) of untreated-wastewater reuse. The        rigation over an area of 4.5 × 10⁶ –20.0 × 10⁶ ha worldwide
total volume of wastewater reused for human purposes is            (Jiménez and Asano, 2008; Raschid-Sally and Jayakody,
therefore likely much greater than the 40.7 × 10⁹ m3 yr−1          2008). More recently, a global, spatially explicit assessment
of intentional treated-wastewater reuse estimated in this          of irrigated croplands influenced by municipal wastewater
study. For example, previous research has indicated that the       flows estimated the area under direct and indirect wastew-
magnitude of intentional untreated-wastewater reuse may            ater irrigation at 36 × 106 ha, of which 29 × 106 ha are likely
                                                                   exposed to untreated-wastewater flows (Thebo et al., 2017).

Earth Syst. Sci. Data, 13, 237–254, 2021                                            https://doi.org/10.5194/essd-13-237-2021
You can also read