CREATING A LEADING AFRICAN GOLD PRODUCER - Q2 2021 Results | July 2021
←
→
Page content transcription
If your browser does not render page correctly, please read the page content below
CREATING A LEADING AFRICAN GOLD PRODUCER
Q2 2021 Results | July 2021
DISCLAIMER
Safe Harbour: Some statements contained in this presentation are forward-looking statements or forward-looking                        In this presentation, we use the terms "cash operating cost per ounce", "All-In Sustaining Cost per ounce" and "AISC per
information (collectively, “forward-looking statements”) within the meaning of the United States Private Securities                   ounce". These terms should be considered as Non-GAAP Financial Measures as defined in applicable Canadian and United
Litigation Reform Act of 1995 and applicable Canadian securities laws, respectively. Investors are cautioned that forward-            States securities laws and should not be considered in isolation or as a substitute for measures of performance prepared in
looking statements are inherently uncertain and involve risks and uncertainties that could cause actual results to differ             accordance with International Financial Reporting Standards ("IFRS"). "Cash operating cost per ounce" for a period is equal
materially. Such statements include comments regarding: Gold production, cash operating costs, production and cost                    to the cost of sales excluding depreciation and amortization for the period less royalties, the cash component of metals
guidance; capital and exploration expenditure guidance; the ability to expand the Company and its production profile                  inventory net realizable value adjustments and severance charges divided by the number of ounces of gold sold (excluding
through the exploration and development of its existing mine; estimated timing of the development of new mineral                      pre-commercial production ounces) during the period. ,"All-In Sustaining Costs per ounce" commences with cash operating
deposits and sources of funding for such development; expectations regarding the sustainability of current gold prices;               costs and then adds sustaining capital expenditures, corporate general and administrative costs, mine site exploratory
implementation of exploration programs at Wassa and the timing thereof; the acceleration of the growth and development                drilling and greenfield evaluation costs and environmental rehabilitation costs, divided by the number of ounces of gold
of the resource base at Wassa; the investment in drilling and development in 2021 resulting in increased mining rates; the            sold (excluding pre-commercial production ounces) during the period. This measure seeks to represent the total costs of
nature, scope and timing of in mine exploration activities at Wassa; the ability to materially increase production at Wassa           producing gold from operations. These measures are not representative of all cash expenditures as they do not include
through development capital investments; the use of the non-hedge gold collar contracts; the delivery of a range of                   income tax payments or interest costs. Changes in numerous factors including, but not limited to, mining rates, milling
operational initiatives that improve the consistency of the operations and visibility of the longer-term potential of the             rates, gold grade, gold recovery, and the costs of labor, consumables and mine site general and administrative activities
operations; the life of mine; the future work plan with respect to the PEA; the ability of the Company to repay the 7%                can cause these measures to increase or decrease. We believe that these measures are the same or similar to the
Convertible Debentures when due or to restructure them or make alternate arrangements; the term of the Macquarie                      measures of other gold mining companies but may not be comparable to similarly totaled measures in every instance.
credit facility, and the step down in capacity; the Company having sufficient cash available to support its operations and            Please see our "Management's Discussion and Analysis of Financial Condition and Results of Operations for the quarter
mandatory expenditures for the next 12 months; the continued commissioning process for the new paste plant; the                       ended June 30, 2021" for a reconciliation of these Non-GAAP measures to the nearest IFRS measure.
introduction of second stopes planned for mining; the Company increasing exploration activities; planned exploration at
Wassa and the timing and budget thereof; the ability to generate strong margins and sufficient free cash flow, raise                  INFORMATION: The information contained in this presentation has been obtained by Golden Star from its own records
additional financing or establish refinancing options for the Company’s current debt; the continued at-the-market equity              and from other sources deemed reliable, however no representation or warranty is made as to its accuracy or
distribution program from time-to-time; the timing, duration and overall impact of the COVID-19 pandemic on the                       completeness. The mineral reserve and mineral resource estimates have been compiled by the Company's technical
Company’s operations and the ability to mitigate such impact; the quantum of cash flow from the sale of Prestea and the               personnel in accordance with definitions and guidelines set out in the Definition Standards for Mineral Resources and
anticipated receipt and timing thereof; the availability of mineral reserves based on the accuracy of the Company’s                   Mineral Reserves adopted by the Canadian Institute of Mining, Metallurgy, and Petroleum and as required by Canada's
updated mineral reserve and resource models; planned drilling activities; the ability to convert mineral resources to                 National Instrument 43-101 – Standards of Disclosure for Mineral Projects ("NI 43-101"). All mineral resources are
mineral reserves through the planned infill drilling program; the potential to increase the Company’s mineral resources               reported inclusive of mineral reserves. Mineral resources which are not mineral reserves do not have demonstrated
outside of its existing mineral resources footprint; the anticipated impact of increased exploration on current mineral               economic viability. Mineral reserve estimates reflect the Company's reasonable expectation that all necessary permits and
resources and mineral reserves; and the potential incurrence of further debt in the future. Generally, forward-looking                approvals will be obtained and maintained. Mining dilution and mining recovery vary by deposit and have been applied in
information and statements can be identified by the use of forward-looking terminology such as “plans”, “expects”, “is                estimating the mineral reserves. Additional scientific and technical information relating to the mineral properties referenced
expected”, “budget”, “scheduled”, “estimates”, “forecasts”, “intends”, “anticipates”, “believes” or variations of such words          in this news release are contained in the technical report dated March 1, 2021 titled "NI 43-101 Technical Report on the
and phrases (including negative or grammatical variations) or statements that certain actions, events or results “may”,               Wassa Gold Mine, Mineral Resource and Mineral Reserve Update and Preliminary Economic Assessment of the Southern

                                                                                                                                                                                                                                                                       NYSE AMERICAN: GSS | TSX: GSC
“could”, “would”, “might” or “will be taken”, “occur” or “be achieved” or the negative connotation thereof. Investors are             Extension Zone, Western Region, Ghana" effective December 31, 2020, which is available at: www.sedar.com;
cautioned that forward-looking statements and information are inherently uncertain and involve risks, assumptions and
uncertainties that could cause actual facts to differ materially. Such statements and information are based on numerous
assumptions regarding present and future business strategies and the environment in which Golden Star will operate in the             The technical contents of this presentation have been reviewed and approved by S. Mitchel Wasel, BSc Geology, a Qualified
future. Forward-looking information and statements are subject to known and unknown risks, uncertainties and other                    Person pursuant to NI 43-101. Mr. Wasel is Vice President of Exploration for Golden Star and an active member and
important factors that may cause the actual results, performance or achievements of Golden Star to be materially different            Registered Chartered Professional of the Australasian Institute of Mining and Metallurgy. The results for Wassa drilling
from those expressed or implied by such forward-looking information and statements, including but not limited to: gold                stated herein are based on the analysis of saw-split HQ/NQ diamond half core or a three-kilogram single stage riffle split of
price volatility; discrepancies between actual and estimated production; mineral reserves and resources and metallurgical             a nominal 25 to 30 kg reverse circulation chip sample which has been sampled over nominal one metre intervals (adjusted
recoveries; mining operational and development risks; liquidity risks; suppliers suspending or denying delivery of products           where necessary for mineralized structures). Sample preparation and analyses have been carried out at Intertek
or services; regulatory restrictions (including environmental regulatory restrictions and liability); actions by governmental         Laboratories in Tarkwa, Ghana, which are independent from Golden Star, using a 1,000 gram slurry of sample and tap
authorities; the speculative nature of gold exploration; ore type; the global economic climate; share price volatility; the           water which is prepared and subjected to an accelerated cyanide leach (LEACHWELL). The sample is then rolled for twelve
availability of capital on reasonable terms or at all; risks related to international operations, including economic and              hours before being allowed to settle. An aliquot of solution is then taken, gold extracted into Di-iso Butyl Keytone (DiBK),
political instability in foreign jurisdictions in which Golden Star operates; risks related to current global financial conditions;   and determined by flame Atomic Absorption Spectrophotometry (AAS). Detection Limit is 0.01 ppm. All analytical work is
actual results of current exploration activities; environmental risks; future prices of gold; possible variations in mineral          subject to a systematic and rigorous Quality Assurance-Quality Control (QA-QC). At least 5% of samples are certified
reserves and mineral resources, grade or recovery rates; mine development and operating risks; an inability to obtain                 standards and the accuracy of the analysis is confirmed to be acceptable from comparison of the recommended and actual
power for operations on favourable terms or at all; mining plant or equipment breakdowns or failures; an inability to obtain          "standards" results. The remaining half core is stored on site for future inspection and detailed logging, to provide valuable
products or services for operations or mine development from vendors and suppliers on reasonable terms, including                     information on mineralogy, structure, alteration patterns and the controls on gold mineralization.
pricing, or at all; public health pandemics such as COVID-19, including risks associated with reliance on suppliers, the cost,
scheduling and timing of gold shipments, uncertainties relating to its ultimate spread, severity and duration, and related            CAUTIONARY NOTE TO US INVESTORS: This presentation uses the terms "measured mineral resources“, "indicated
adverse effects on the global economy and financial markets; accidents, labor disputes and other risks of the mining                  mineral resources“ and "inferred mineral resources.” The Company advises US investors that while these terms are
industry; delays in obtaining governmental approvals or financing or in the completion of development or construction                 recognized and required by NI 43-101, the US Securities and Exchange Commission ("SEC") does not recognize them.
activities; litigation risks; and risks related to indebtedness and the service of such indebtedness. Although Golden Star has        Also, although disclosure of contained ounces is permitted under Canadian regulations, the SEC generally requires mineral
attempted to identify important factors that could cause actual results to differ materially from those contained in forward-         resource information to be reported as in-place tonnage and grade. US Investors are cautioned not to assume that any
looking information and statements, there may be other factors that cause results not to be as anticipated, estimated or              part or all of the mineral deposits in the measured and indicated categories will ever be converted into mineral reserves.
intended. There can be no assurance that future developments affecting the Company will be those anticipated by                       US investors should also note that "Inferred mineral resources" have a great amount of uncertainty as to their existence,
management. Please refer to the discussion of these and other factors in management’s discussion and analysis of financial            and great uncertainty as to their economic and legal feasibility. It cannot be assumed that all or any part of inferred
conditions and results of operations for the quarter ended June 30, 2021, and in our annual information form for the year             mineral resources will ever be upgraded to a higher category. In accordance with Canadian rules, estimates of inferred
ended December 31, 2020 as filed on SEDAR at www.sedar.com. The forecasts contained in this presentation constitute                   mineral resources cannot form the basis of feasibility or other economic studies. US investors are cautioned not to assume
management's current estimates, as of the date of this presentation, with respect to the matters covered therein. We                  that any part or all of the inferred mineral resource exists or is economically or legally mineable.
expect that these estimates will change as new information is received and that actual results will vary from these
estimates, possibly by material amounts. While we may elect to update these estimates at any time, we do not undertake                CURRENCY: All monetary amounts refer to United States dollars unless otherwise indicated.
to update any estimate at any particular time or in response to any particular event. Investors and others should not
assume that any forecasts in this presentation represent management's estimate as of any date other than the date of this                                                                                                                                      2
presentation.
                                                                                                                                                                                                                                                                                          2
PARTICIPATING MANAGEMENT

    Andrew Wray               Graham Crew
  Chief Executive Officer   Chief Operating Officer

                                                      NYSE AMERICAN: GSS | TSX: GSC
   Paul Thomson                Mitch Wasel
  Chief Financial Officer      VP, Exploration

                                                                         3
GOLDEN STAR - Overview
Wassa | Underground gold mine in Ghana Reserve Mine Plan
400
Production AISC
1,125
1,000
300
Ave. production Average AISC1,2
Site AISC ($/oz)2
875
Production (koz)
177 koz/year $881 /oz
200 750
625
100 500
375
Mine life NPV3, 7
- 250
6 years $336 M
Growth Opportunity
2021 2022 2023 2024 2025 2026
PEA Life of Mine Extension (excludes Reserve plan)
NYSE AMERICAN: GSS | TSX: GSC
Wassa
Ave. production Average AISC1,2 Mine life NPV4,7
294 koz/year $778 /oz 11 years $783 M
500 1000
Production AISC
875
400
Production (koz)
Site AISC ($/oz)2,8
750
300
625
200
500
100
375
0 250
4
Q2 2021 – Performan ce Summary & Key Events
Production And Sales (Continuing operations) Q2 2021 Key Events
Wassa
Production Gold Sold
• The mining rate averaged 3,963tpd in Q2 2021, 12% lower than Q1 2021 due
Q2 2021 37.9koz Q2 2021 37.7koz
to lower than planned development rates
Q1 2021 40.1koz Q1 2021 38.9koz
• Underground mined grade averaged 3.1g/t, in line with the underground
reserve grade of 3.1g/t and 4% higher than the grade achieved in Q1 2021
• Processing of low-grade stockpiles continued during Q2 2021, generating 5koz
Unit Costs (Continuing operations) of production
• Investment in infrastructure continued throughout Q2 2021 to provide
additional mining flexibility with the objective of increasing mining rates. Capex
Cash opex/oz1 AISC/oz1 totaled $12m
Q2 2021 $752/oz Q2 2021 $1,182/oz
Q1 2021 $718/oz Q1 2021 $1,100/oz
Balance Sheet
NYSE AMERICAN: GSS | TSX: GSC
The cash position increased by $6.6m to $72.7m in Q2 2021
Financial Performance At-the-Market Program – Limited use, $5.2m of net proceeds in April and May
Macquarie senior secured credit facility was restructured and upsized to a
three-year $90m revolving credit facility
Adequate liquidity available to settle convertible debenture on maturity in
Adj. EBITDA 1 Operating Cash
August
Q2 2021 $26.0m Flow 5
Q1 2021 $27.2m Q2 2021 $23.2m
Paste Fill Commissioning
Q1 2021 $23.3m
• The commissioning was delayed by some quality assurance testing returning
lower than expected fill strengths in the test stope in April 2021
• Recent results, particularly at a higher cement content of 7-10%, support
Cash Net Debt progression of the commissioning process onto filling of a second test stope
Q2 2021 $72.7m Q2 2021 $31.0m • Anticipate re-commencement of the filling schedule in Q4 2021 allowing for
Q1 2021 $66.1m Q1 2021 $39.5m production from secondary stopes as planned in 2022
5
Safety and Health – Effective COVID-19 management
Q2 2021 Performance Rapid diagnosis and management response to COVID-19
During Q2 2021, Wassa experienced 10 suspected COVID-19 cases with 6 confirmed cases and 2 pending
results as at quarter end
All-injury frequency rate
In-house PCR testing capability allows for rapid diagnosis and management response
2.91 3.57 The number of people required to isolate as a result of contact tracing significantly reduced, supporting
Q2 2021 Q2 2020 business continuity
Operational Impact
Total recordable injury
frequency rate (12-month average) COVID-19 impacted on the availability of our expatriate Jumbo operators in H1 2021. This resulted in
NYSE AMERICAN: GSS | TSX: GSC
lower than planned development rates being achieved
0.97 0.54 Investment in additional resources is being made alongside changes to operating structures to mitigate
Q2 2021 Q2 2020 the ongoing impact of COVID-19 on development rates
6
2021 OUTLOOK –                    Investin g for Continu ed Growth

                                                                                                                           2021 Guidance

                                                                               Exploration             Production
2021 Focus

                   Infill Drilling         Development
                                                                                                       •   Delay to commissioning of paste plant impacts 21% of
                                                                           Increased budget (versus        planned ore tonnes for 2021
                Resource to reserve    Accelerating development
                                                                          2020) to enable systematic   •   Investment in additional development resource is being
                 conversion drilling    rates to support future
                                                                             testing of exploration        made and changes to operating structures to mitigate
                                       increases in mining rates
                                                                                    targets                the ongoing impact of COVID-19
                                                                                                       •   Wassa is expected to produce 145 - 155koz in 2021

                                                            Updated Guidance
                                                                                      2021 Guidance
                                                                  2021
                                                                                                       Costs
Production and cost highlights

                                                                                                                                                                    NYSE AMERICAN: GSS | TSX: GSC
                                                                                                       •   AISC increased to $1,150/oz - $1,250/oz driven by
Production - Wassa                                 koz             145-155              165-175            lower production volumes and the increased allocation
                                                                                                           of the capex budget to sustaining capital
Cash operating cost – Wassa1                       $/oz            750-800              660-700

All-in sustaining cost – Wassa1                    $/oz       1,150-1,250              1,000-1,075

Capital Expenditure
                                                                                                       Capital Expenditure
      Sustaining capital – Wassa                    $m              32-25                 26-28
                                                                                                       •   Capital expenditure range is unchanged
      Expansion capital – Wassa                     $m              13-15                 19-22
                                                                                                       •   Sustaining capital guidance has been increased due to
Total Capital – Wassa
(excluding capitalized exploration)
                                                   $m               45-50                45-50             increased investment in development and the TSF
                                                                                                           project
Capitalised exploration                             $m                8                     4
                                                                                                       •   Expansion capital guidance has been reduced with some
Expensed exploration                                $m                6                    11              ventilation capital deferred for Q4 2021 to early 2022
Exploration                                        $m                14                    15

Total capital and exploration                      $m               59-64                60-65

                                                                                                                                                                                       7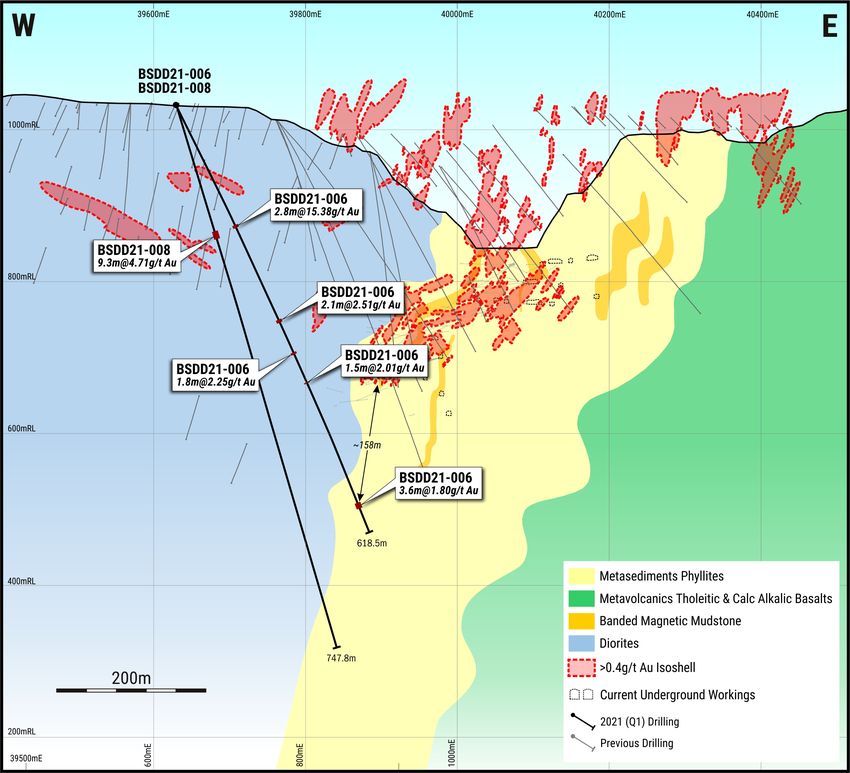
NYSE AMERICAN: GSS | TSX: GSC
WASSA MINE
Scaling Production to Gold Endowment
                                                          8
PASTE BACKFILL SYSTEM – Ongoin g Commission in g
Overview
The Paste fill plant commissioning process started in Q1 2021, following the
completion of the plant construction in Q4 2020
As previously announced the commissioning was delayed by some quality
assurance testing returning lower than expected fill strengths in the test
stope in April 2021
Recent Test Work
Test work program has been extended in collaboration with Minefill Services
and the University of Mines and Technology in Tarkwa, Ghana
Recent test results, particularly at a higher cement content of 7-10%, have
NYSE AMERICAN: GSS | TSX: GSC
shown results that support progression of the commissioning process onto
filling of a second test stope
Outlook
The second test stope has been identified and is currently progressing
through the production phase ahead of filling which is anticipated to occur
during Q3 2021.
The stope will be tested with a 10% cement blend for maximum fill
strength, while off-site mix design optimization and test work continues.
Should this test return satisfactory strength results, as expected, the
Company anticipates re-commencement of the filling schedule in Q4 2021
allowing for production from secondary stopes as planned in 2022.
9
WASSA PRODUCTION SCORECARD – Performan ce Trackin g
Mining Rate (ore tpd) Grade (g/t)
4,960
4,499
4,420
4,420
4,320
4,175
4,090
3,963
3.8
3,470
3.5
3.5
3.4
3.1
3.0
2.9
2.8
2.8
Q2 2019 Q3 2019 Q4 2019 Q1 2020 Q2 2020 Q3 2020 Q4 2020 Q1 2021 Q2 2021
Q2 2019 Q3 2019 Q4 2019 Q1 2020 Q2 2020 Q3 2020 Q4 2020 Q1 2021 Q2 2021
NYSE AMERICAN: GSS | TSX: GSC
Total Development (m) Production (koz)
Gold produced (koz) Gold sold (koz)
2,206
2,131
2,024
1,960
1,952
1,816
46.5
1,760
1,755
44.8
1,698
43.6
41.9
41.6
41.3
40.9
40.9
40.3
40.1
38.9
37.9
37.7
37.7
37.4
36.5
34.6
33.9
Q2 2019 Q3 2019 Q4 2019 Q1 2020 Q2 2020 Q3 2020 Q4 2020 Q1 2021 Q2 2021 Q2 2019 Q3 2019 Q4 2019 Q1 2020 Q2 2020 Q3 2020 Q4 2020 Q1 2021 Q2 2021
10WASSA COST SCORECARD – Performan ce Trackin g
UG Mining Costs ($/t ore mined) Processing Costs ($/t )
26
40
39
23
21
21
34
20
33
33
32
32
31
18
30
17
17
16
Q2 2019 Q3 2019 Q4 2019 Q1 2020 Q2 2020 Q3 2020 Q4 2020 Q1 2021 Q2 2021 Q2 2019 Q3 2019 Q4 2019 Q1 2020 Q2 2020 Q3 2020 Q4 2020 Q1 2021 Q2 2021
NYSE AMERICAN: GSS | TSX: GSC
Site G&A ($m) Cash Opex & AISC 1 ($/oz)
Cash Operating Cost (US$/oz) AISC (US$/oz) 1,182
1,093 1,100
1,069
1,023
960 968 958 957
732 752
718
4.9
4.8
4.7
4.7
4.6
680
4.3
4.2
655 664
4.0
3.8
615 632 633
Q2 2019 Q3 2019 Q4 2019 Q1 2020 Q2 2020 Q3 2020 Q4 2020 Q1 2021 Q2 2021 Q2 2019 Q3 2019 Q4 2019 Q1 2020 Q2 2020 Q3 2020 Q4 2020 Q1 2021 Q2 2021
1. See note on slide 2 regarding Non-GAAP Financial Measures. 11NYSE AMERICAN: GSS | TSX: GSC
Q2 2021 RESULTS
Creating Financial Flexibility
12Q2 2021 CONSOLIDATED FINANCIAL RESULTS
Continuing operations Q2 2021 Q2 2020 % change Mine Operating Profit – $26m
Strong realized gold price for spot sales of $1,807/oz
Gold produced - Wassa Koz 37.9 44.8 (15%)
Including the impact of the Royal Gold stream the realized
Gold sold - Wassa Koz 37.7 46.5 (19%)
gold price averaged $1,709/oz
Realized gold price – spot sales $/oz 1,807 1,713 5% Q2 2020 was a strong comparative period for production
Realized gold price – Streaming agreement $/oz 792 836 (5%)
Gold sold was in in-line with production but did not catch up
the 1.2koz sales lag from Q1 2021
Realized gold price - Consolidated $/oz 1,709 1,621 5% Revenue totaled $64.4m in Q2 2021, 15% lower than
Gold revenues $m 64.4 75.4 (15%) $75.4m in Q2 2020 due to lower gold sales
Cost of sales $m 31.9 33.6 (5%)
Depreciation and amortization $m 7.1 6.3 13% Adjusted EBITDA1 - $26m
Mine operating profit $m 25.5 35.5 (28%) EBITDA $7.6m
Adjustments include:
Corporate general and administrative expense $m 4.2 4.3 (2%)
non-cash loss recognized on the deferred
NYSE AMERICAN: GSS | TSX: GSC
Exploration expense $m 1.4 0.4 250% consideration for the sale of Prestea of $17.4 million
Share based compensation expense $m 0.9 0.7 29%
Gain on fair value of financial instruments $0.7m
(gold hedges and convertible debenture)
Loss on fair value of derivative financial
instruments, net
$m 0.7 1.8 (61%) Adjusted EBITDA $26m, 29% lower than Q2 2020 due to
Other expense/(income), Net $m 17.7 (0.6) 3050% lower production volumes, increased mine operating costs
and increased exploration expenses
Income before finance and tax $m 0.5 29.0 (98%)
EDITDA1 $m 7.6 35.2 (78%)
Adj. EDITDA1 $m 26.0 36.4 (29%)
Finance expense $m 1.0 3.3 (70%) Adjusted Earnings Per Share1 - $0.05
Tax expense $m 10.0 14.0 (29%) Adjusted net income attributable to Golden Star
Net (loss)/income from continuing operations shareholders was $6.1m or $0.05 basic income per share
$m (12.1) 9.3 (230%)
attributable to shareholders
Net (loss)/income per share from continuing
This was impacted by the lower gold sales and a higher
$/share (0.11) 0.08 (238%) depreciation charge during the quarter
operations
Adj. income per share attributable to
$/share 0.05 0.10 (50%)
shareholders – basic1
13BALANCE SHEET – Net Debt Reduction
Debt Summary Liquidity ($m)
Outstanding Undrawn
Facility Interest Maturity Repayment
Balance capacity
4.0-5.25% Step down
Macquarie term
+3mth $60.8m $29.2m June 2024 to $50m
loan
LIBOR June 2023
36
Convertible Single
7% $51.5m August 2021
Debenture payment
Total gross debt 112.3
Potential Cash
Accounting
Available
103.7
value of debt Liquidity Available debt capacity
73
Net debt 31.0
$137m
Net debt/EBITDA 0.3x ATM capacity remaining
NYSE AMERICAN: GSS | TSX: GSC
29
50
Scheduled Repayments ($m)6
40
30 Hedging – Zero Cost Collars
20 Unit H2 2021 2022 2023 H1 2024
Total Ounces Koz 25,000 50,000 50,000 25,000
10
Floor Price $/oz 1,600 1,600 1,600 1,600
0
H2 2021 H1 2022 H2 2022 H1 2023 H2 2023 H1 2024
Ceiling Price $/oz 2,171 2,179 2,115 2,115
Convertible debenture repayment Macquarie loan repayment
Quarterly delivery obligation koz 12,500 12,500 12,500 12,500
14NET CASH FLOW BRIDGE – Q2 2021 Cash Movement
NYSE AMERICAN: GSS | TSX: GSC
Corporate & exploration Cash from financing
Cash from continuing operations $11.2m
activities ($8.8m) activities $4.3m
$6.6m increase in cash during Q2 2021
Cash from continuing operations Corporate and exploration activities Cash from financing activities
Strong Wassa operating cashflow of $30.0m (before Corporate general and administrative cash outflows Net proceeds from the ATM program of $5.2m
working capital movements and tax) of $4.2m during the quarter
Income tax payment of $5.4m for Wassa, relating $3.3m invested in exploration, of which $1.4m was Principal payments on leases totalled $0.9m
to Q1 2021 expensed and $1.9m capitalized
Reduction in accounts payable resulted in a working Interest payments of $0.7m related to the quarterly
capital outflow of $3.2m interest for the Macquarie credit facility
15NYSE AMERICAN: GSS | TSX: GSC
EXPLORATION & GEOLOGY
Re-evaluating a Prospective Land Package
16EXPLORATION – Redefin in g the Explorat ion Strategy
History of Discovery through Exploration
In last 10 years, added 2.5 Moz M&I and 8 Moz inferred at c.$7.30 /oz
Exploration Focus – Accelerating Activity in 2021
Exploration Guidance Q2 2021
$3.3m invested in exploration at
Wassa & the regional HBB licences
Of which $1.9m of Wassa in-mine
NYSE AMERICAN: GSS | TSX: GSC
exploration was capitalized & the
$14 M balance was expensed
2021 Exploration budget
Exploration Opportunities
In-mine
Target extensions of mineralization around current mining areas
Near-mine
Target below historical open pits outside of the Main Wassa trend
Regional
Target below historical HBB pits and geochemical/geophysical anomalies
17EXPLORATION – In-mine Extension Opportun it ies
Wassa up dip 50 m spaced
2021 infill drilling focus
19150N, 19250N During the quarter 3 surface drill rigs
continued the testing of targets down-dip
of the existing reserve
242 Limb
A total of five holes were completed for
4,827m during Q2 2021
NYSE AMERICAN: GSS | TSX: GSC
Phase One (200m spacing) up-dip &
down-dip program was expected to total
10,000m in 2021
Wassa down dip 100 m spaced
2021 infill drilling focus
19900N, 19700N, 19500N Year to date drilling total 11,175m
Phase one in-mine drilling was completed
during the quarter
Funds now reallocated to infill drilling
aimed at identifying mineral resources by
the year end
18EXPLORATION – Wassa Q2 2021 In-mine Drillin g
Estimated
Drilled Width Grade Au
Hole ID From (m) To (m) True Width Drilling target
(m) (g/t)
(m)
BSDD20-006 101.7 104.7 3 3 6.3 Down-dip
BSDD20-006 176.0 179.0 3 2.8 15.4 Down-dip
BSDD20-006 215.8 319.8 4 2.1 2.5 Down-dip
BSDD20-006 364.5 368.0 3.5 1.8 2.3 Down-dip
BSDD20-006 406.1 409.0 2.9 1.5 2.0 Down-dip
BSDD20-007M 535.0 553.0 18 17.3 4.8 Down-dip
including 536.0 546.0 10 9.6 7.3 Down-dip
BSDD21-007M 629.0 631.5 2.5 2.4 3.2 Down-dip
BSDD21-008 176.3 185.7 9.4 9.3 4.7 Down-dip
BSDD21-007D1 183.0 190.0 7 6.9 2.7 Down-dip
NYSE AMERICAN: GSS | TSX: GSC
BSDD21-009 299.0 307.0 8 6.8 1.5 Down-dip
BSDD21-009 374.0 383.0 9 4.7 2.7 Down-dip
BSDD21-009 741.0 746.0 5 3.8 1.2 Down-dip
BSDD21-009 786.0 788.0 2 1.5 2.0 Down-dip
BSDD21-009 833.8 838.8 5 3.7 2.0 Down-dip
BSDD21-008 – 242 (upper mine) target
Intercepting 9.3m at 4.7g/t
This is in line with the western limb extension of the 242 zone which
forms part of the Upper Mine target
19EXPLORATION – Wassa Q2 2021 In-mine Drillin g
BSDD21-007M – Down-dip target
Intersected 17.3m at 4.8g/t
BSDD21-007D1 – Down-dip target
Intersected 6.9m at 2.7g/t
C.50m down-dip of hole DSDD21-007M (see above)
BSDD21-007M This hole represents further confirmation that the B-Shoot hanging
17.3m @ 4.8 g/t Au
wall zone extends below the current reserve, warranting further
NYSE AMERICAN: GSS | TSX: GSC
down-dip drilling to the west
BSDD21-007M
BSDD21-007D1 2.5m @ 3.2 g/t Au
6.9m @ 2.7 g/t Au BSDD21-
007M Q3 2021 Exploration Program
17.3m @ 4.8 g/t
Au
Follow-up drilling of the up-dip and down-dip extensions to
mineralization
Aimed at reducing the initial 200m spacing to 100m for the down-
dip program and 50m for the up-dip program
20EXPLORATION – Wassa Near-Min e Explorat ion
Dwaben Safric RL
Estimated
Drilled Width Grade
Hole ID From (m) To (m) True Width
(m) Au (g/t)
(m)
ME / DMH SAKDD21-001 318.0 321.0 3.0 2.1 2.64
SAK SAKDD21-002 250.0 253.0 3.0 2.1 1.64
Bawdia Bosso
Main SAKDD21-002 256.7 257.4 0.7 0.5 5.26
SAKDD21-002 266.0 268.0 2.0 2.0 2.52
Anomaly 2 MEDD21-001 57.0 60.0 3.0 2.9 2.76
F4 Closure
MEDD21-001 198.0 204.0 6.0 5.9 2.37
MEDD21-001 210.4 218.4 8.0 7.8 2.07
NYSE AMERICAN: GSS | TSX: GSC
MEDD21-002 110.0 112.0 2.0 2.0 2.40
MEDD21-002 258.3 260.5 2.2 1.9 1.45
Anomaly 1
MEDD21-002 267.0 270.0 3.0 2.6 1.26
MEDD21-002 272.4 275.4 3.0 2.6 2.78
Anomaly 3
Anomaly 4
Wassa ML
Program focussed on the drill The planned first phase of
A total of seven RC and Air core drilling of a soil
testing of mineralization drilling at Mid East and Dead
diamond drilling holes were anomaly south east of the
beneath mined and back-filled Man Hill has been completed
completed for 2,394m during Wassa trend was completed
open pits at SAK, Mid East and
Q2 2021 with 59 holes totalling 2,365m
Dead Man Hill Drilling ongoing at SAK
21EXPLORATION – Wassa Region al Explorat ion
Subriso West Zone
8 RCDD Holes for Seikrom AC Program
3,250 metres
Subriso East Zone
100/200 metre spaced fences, 23 out of 38
6 RCDD Holes for holes completed.
1,550 metres
Manso 2 Abada Area AC Program
103 AC Holes for Drilling partly completed. Positive AC result
5,150 metres from Abada-Guadium and Abada South to be
Kwahu Hill
40 AC Holes for 1,725 evaluated with IP and Mag survey data.
metres
NYSE AMERICAN: GSS | TSX: GSC
Benso-Subriso RC/DD drilling
Drill testing beneath the previously mined pits
(GZ deferred to 2022) SE drilling to South of
Pit testing plunge of HG shoot, defined in OP
Abada Area GC commenced in July, two holes completed.
108 AC Holes for SW drilling of HG shoot to commence in
5,025 metres August
200 Line km IP
Seikrom
Survey
38 AC Holes for 1,900
metres
IP and Magnetic survey
133km line cutting completed at Abada.
Program expected to run through Q4 2021.
22SUMMARY – PEA Indicat es Significant Growth of Product i on and Mine Life
Reserve Mine Plan Catalysts - Next 12 months
Balance Sheet
Growth Opportunity
Ave. Production Average AISC1,2 Mine life NPV3,7 Repayment of the 7% convertible debentures on
maturity in August 2021
177koz/year $881/oz 6 years $336m
Wassa
PEA Life of Mine Extension (excludes Reserve plan)
Infrastructure
Paste fill plant - Production from secondary stopes
planned for 2022
NYSE AMERICAN: GSS | TSX: GSC
Ave. Production Average AISC1,2 Mine life NPV4,7
294koz/year $778/oz 11 years $783m
Definition Drilling
Increased investment in infill drilling at Wassa
2021 - The first extensive investment in systematic exploration
Exploration
Underground aimed at resource to reserve
conversion
Delineate extensions of Delineate surface targets Test 90km gold belt for
underground mineralization within 5-10km of Wassa mill standalone targets
Exploration
Exploration spend accelerating in 2021
Balance
Sheet
Address 7% convertible debentures Current available liquidity Systematic program testing of in mine, near mine
Maturity August 2021 $138m and regional targets
23THANK YOU – Q&A
CONTACT US
Michael Stoner
Investor Relations & Business Development
+44 020 8167 7000
investor@gsr.com
NYSE American: GSS | TSX: GSC
NYSE AMERICAN: GSS | TSX: GSC
24FOOTNOTES & ASSUMPTIONS
Footnotes
1. See note on slide 2 regarding Non-GAAP Financial Measures
2. Mine site only - excludes corporate G&A
3. Based on analyst consensus short term forecasts (January 2021)
4. Based on analyst consensus long term forecast $1,585/oz (January 2021)
5. Operating cash flow before working capital changes and taxes (including discontinued operations).
6. Repayment profile based on the drawn amount at June 30, 2021
7. After tax, 100% basis
8. AISC in pre-production years not included
NYSE AMERICAN: GSS | TSX: GSC
Gold Price Assumptions
Flat Long
2021 2022 2023 2024
Term
Gold Price - Analyst Consensus 1,944 1,880 1,773 1,716 1,585
Gold Price - Base Case 1,300
25You can also read