Curved-Full-Field OCT for high-resolution imaging of living human retina over a large field-of-view
←
→
Page content transcription
If your browser does not render page correctly, please read the page content below
Curved-Full-Field OCT for high-resolution imaging of living
                                                           human retina over a large field-of-view
                                                      Pedro Mecê1,∗ , Kassandra Groux1 , Jules Scholler1 , Olivier Thouvenin1 , Mathias Fink1 , Kate
                                                                                    Grieve2,3 and Claude Boccara1
                                                  1
                                                    Institut Langevin, CNRS, ESPCI Paris, PSL Research University, 10 rue Vauquelin, Paris, France
                                                  2
                                                    Institut de la Vision, Sorbonne Université, INSERM, CNRS, F-75012, Paris, France
                                                  3
                                                    Quinze-Vingts National Eye Hospital, 28 Rue de Charenton, Paris, 75012, France
                                                  ∗
                                                    pedro.mece@espci.fr

                                                                                                       Abstract
                                                             Allying high-resolution with a large field-of-view (FOV) is of great importance in the fields
                                                         of biology and medicine [1, 2, 3], but particularly challenging when imaging non-flat living
                                                         samples such as the human retina. Indeed, high-resolution is normally achieved with adaptive
                                                         optics (AO) and scanning methods, which considerably reduce the useful FOV and increase
arXiv:2001.06893v1 [physics.med-ph] 19 Jan 2020

                                                         the system complexity. An alternative technique is time-domain Full-Field Optical Coherence
                                                         Tomography (FF-OCT) [4, 5], which has already shown its potential for in-vivo high-resolution
                                                         retinal imaging [6]. Here, we introduce curved-field FF-OCT, capable of matching the coher-
                                                         ence gate geometry to the sample curvature, thus achieving a larger FOV than previously
                                                         possible. Using this instrument, we obtained high-resolution images of living human photore-
                                                         ceptors close to the foveal center without AO and with a 1 mm × 1 mm FOV in a single
                                                         shot. This novel advance enables the extraction of photoreceptor-based biomarkers with ease
                                                         and spatiotemporal monitoring of individual photoreceptors. We compare our findings with
                                                         AO-assisted ophthalmoscopes, highlighting the potential of FF-OCT, as a relatively simple,
                                                         compact and low-cost system, to become a routine clinical imaging technique.

                                                      Owing to the optical properties of the eye, the retina is the only part of the central nervous
                                                  system that can be visualized non-invasively in-vivo, a crucial aspect for studying neuronal activity
                                                  [7, 8]. Due to their capacity to correct for static and dynamic ocular aberrations [9, 10], AO
                                                  ophthalmoscopes have become the primary technique to image individual retinal neurons such
                                                  as cone and rod photoreceptors in the living human retina [11, 12, 13, 14]. Imaging individual
                                                  retinal neurons in-vivo with AO ophthalmoscopes has enabled new insights into retinal function
                                                  such as colour vision [15] and a better understanding of progression of retinal diseases such as
                                                  age-related macular degeneration [16]. However, AO systems require quite complex, expensive and
                                                  cumbersome hardware, strongly limiting their clinical and commercial deployment [17, 18]. Thus,
                                                  achieving high-cellular resolution in the living human retina without using AO is of tremendous
                                                  interest.
                                                      Recent studies have achieved this goal by implementing a super-resolution optical-reassignment
                                                  technique [19] or computational ocular aberration correction [18, 20]. Nevertheless, they were not
                                                  able to provide a real-time view of the retina and presented results in far foveal eccentricities (3o
                                                  or more), where photoreceptors are most easily resolved [18, 20], or they used scanning illumina-
                                                  tion/detection techniques [18, 19], which present an inherent low frame rate, limited FOV (lower
                                                  than 0.3 mm × 0.3 mm) and high sensitivity to fixational eye motion [21] leading to intraframe
                                                  distortion. All these drawbacks affect the repeatability and accuracy of the measurement of essen-
                                                  tial biomarkers, such as photoreceptor distribution, density, and spacing, and the spatiotemporal
                                                  monitoring of individual photoreceptors, all useful tools to diagnose retinal disorders at the earliest
                                                  stage [22].
                                                      An alternative modality to achieve high-cellular resolution without using AO is FF-OCT, which
                                                  uses a spatially incoherent light source, a high-speed megapixel camera and time-domain phase
                                                  modulation to acquire en-face sections of the sample at a given depth. One attractive point of this
                                                  technique for retinal imaging is the fact that the optical resolution of FF-OCT has a low sensitivity
                                                  to predominant ocular aberrations (i.e. defocus and astigmatism) [5, 23, 24]. This interesting
                                                  feature was recently highlighted in [6], where in-vivo human cone mosaic at eccentricities close
                                                  to the fovea was resolved. Although FF-OCT’s FOV is theoretically only limited by the spatial
                                                  sampling of the imaging camera, retinal curvature causes current images to have a limited useful
                                                  FOV of about 0.4 mm × 0.4 mm [6, 25].
                                                      Typically, FF-OCT uses a Linnik interferometer, where identical microscope objectives are
                                                  placed in both reference and sample arms in a symmetric optical path configuration (Fig. 5). When
                                                  applied to retinal imaging, the FF-OCT symmetry is broken, as the sample arm no longer contains a
                                                  microscope objective (Fig. 5), but rather contains the anterior segment optics of the human eye. In

                                                                                                            1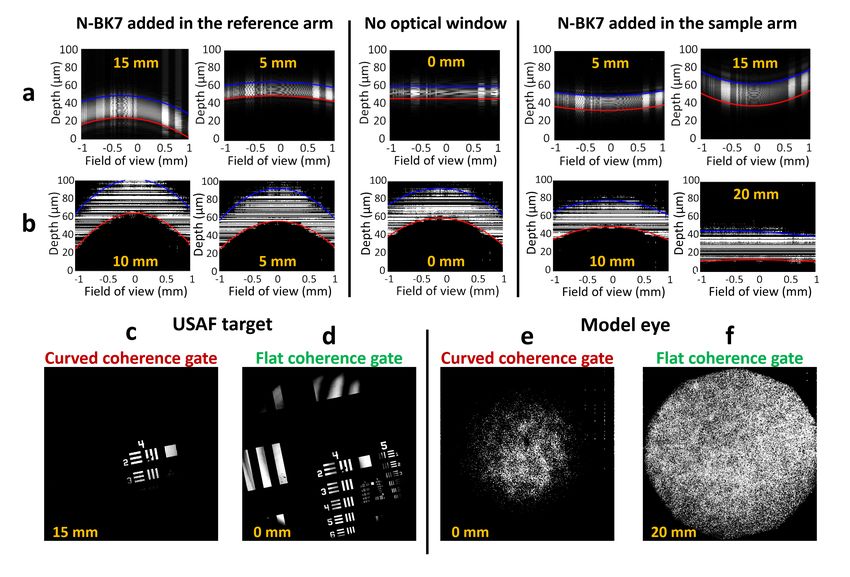
this Letter, we experimentally demonstrate that when the symmetry is broken a curved coherence
gate is generated, provoking a mismatch with the retinal curvature, and consequently limiting the
useful FOV. We present novel advances in FF-OCT allowing for optical shaping of the geometry of
the coherence gate, adapting it to the retinal geometry (Supplementary Section 1,2), enabling the
generation of single-shot, high-resolution, large FOV images (1 mm × 1 mm) of the photoreceptor
mosaic as close as 0.5o from the foveal center. Then, we show that important photoreceptor-
based biomarkers together with the spatiotemporal monitoring of individual photoreceptors can
be achieved without the need for AO in a relatively simple and low-cost optical imaging system.
    Figure 1 shows how the coherence gate geometry can be optically manipulated by adding
optical windows in one of the interferometer arms. When imaging the USAF target (Fig. 1(a)) in a
symmetric configuration the cross-section looks completely flat. The addition of an optical window
in one of the arms breaks this symmetry, consequently, the flat sample presents an apparent curved
cross-section. This apparent curvature happens because of a non-constant optical path difference
along the FOV, generating a curved coherence gate (see Supplementary Section 1). One can notice
that the curvature increases as a function of the thickness of the optical window introduced in one
of the arms. Depending on which arm the optical window is introduced in, the coherence gate
curvature can present a concave or a convex shape. The induced curvature of the coherence gate
directly impacts the useful FOV of an FF-OCT system, since it acquires en-face curved sections
of a flat sample at a given depth (Fig. 1(c,d)). The same experiment can be done now using
an OEMI-7 model eye (Ocular Instruments, Inc) in an asymmetric configuration (Fig. 1(b)). In
this case, already when no optical window is introduced, the coherence gate presents a significant
curvature. The introduction of an optical window in the sample arm enables compensation for the
initial apparent curvature, increasing the useful FOV (Fig. 1(e,f)).
    In-vivo retinal imaging from the inner/outer segment junction (IS/OS) was performed in a
healthy volunteer before and after compensation of the coherence gate curvature in an area as
close as 0.5o from the foveal center (Fig. 2). The addition of an N-BK7 optical window with
20 mm thickness enabled achievement of high-resolution foveal cone mosaic imaging with a useful
FOV of 1 mm × 1 mm, larger than the previous FOV by a factor of 6.25. Zoomed areas and
their respective power spectral density (PSD) are also presented. All PSDs presented Yellot’s ring,
the spectral signature of the photoreceptor mosaic image [26]. The high-resolution allied with the
large FOV enabled measurement of photoreceptor-based biomarkers within a few seconds on a
single-shot (no image montaging is necessary) with ease (Fig. 3(a)). Figures 3(b,c) show how the
cone density and spacing respectively evolve with eccentricity. All measurements are consistent
with histology and AO-assisted cone density measurement [27, 28].
    Minimizing the effect of the coherence gate curvature also helps to increase the repeatability and
consistency of the imaging, allowing for spatiotemporal monitoring of individual photoreceptors.
Supplementary Video 5 presents four image sequences acquired in the same region with a 10 min
interval between acquisitions. Note in zoomed areas that individual photoreceptors can be tracked
frame-by-frame (3 ms interval) and video-by-video (10 min interval). Green boxes highlight cones
that are visible in all four videos, while yellow boxes those visible for some of the videos, which might
indicate a change of reflectivity due to phototransduction [22] (Supplementary Section 4). Red
hexagons highlight the typical pattern found in cone mosaic close to the fovea [27, 28]. Figure 4(a-d)
presents the averaged image obtained from zoomed areas of Supplementary Video 5. Figures 4(e-
h) and Supplementary Videos 6,7 show a cone-to-cone comparison of FF-OCT image with images
generated by two AO ophthalmoscope modalities for the same subject and observed region. FF-
OCT allows visualization of most, if not all, photoreceptors identified in AO-assisted images. Note
in Fig. 4(i) that PSDs from all FF-OCT images present a clear and well-defined cone mosaic spatial
frequency (red-area) at 120 cycles/mm, as it is the case for both AO-assisted imaging modalities.
On the other hand, when using a scanning laser ophthalmoscope without closing the AO-loop, an
erroneous spatial frequency is measured, leading to an error in cone density computation.
    Through the optical manipulation of the coherence gate geometry, the data shown here represent
a clear improvement in retinal imaging, allying high cellular-resolution in all three dimensions, large
FOV, and high-acquisition rate of a given retinal plane (300 Hz), without using any optical or digital
aberration compensation other than prescribed eyeglasses, considerably simplifying the hardware
and software complexity. This novel performance provides four-dimensional (4D) monitoring of
individual photoreceptors and computation of photoreceptor-based biomarkers with good accuracy
and repeatability, preventing image distortion and long, fastidious acquisition sessions to cover the
retinal area of interest, as is the case with scanning systems.
    In conclusion, we have developed curved-field FF-OCT, an imaging system capable of adapting
its coherence gate geometry to the curvature of the sample being imaged, making large FOV imag-
ing possible while keeping high-resolution in samples under constant motion, such as the living

                                                   2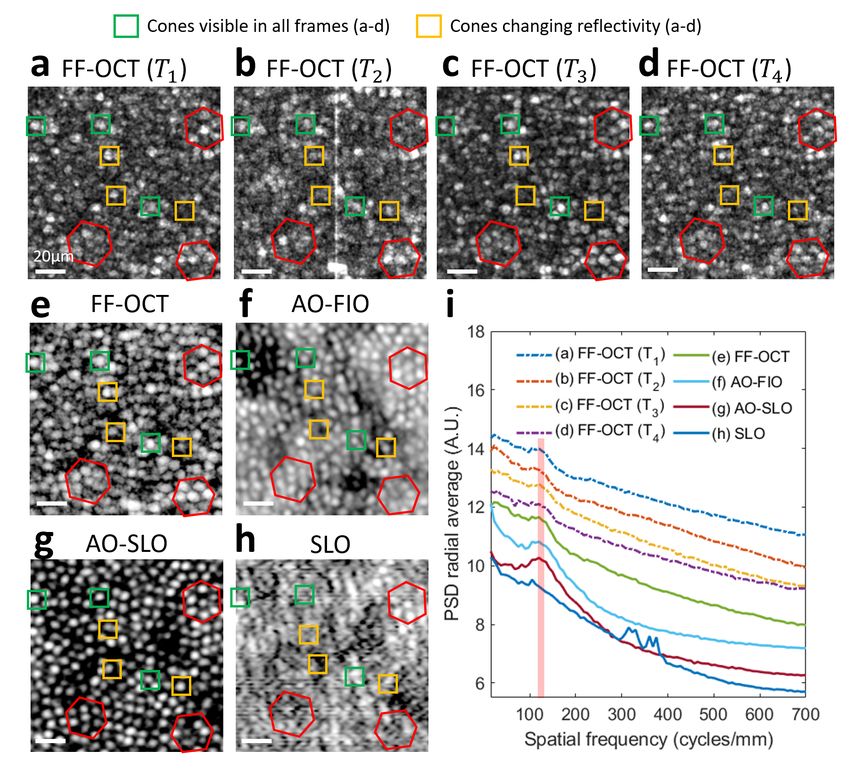
human eye. While this paper discusses the application of curved-field FF-OCT in retinal imag-
ing, it can be extended to other non-flat samples, such as the cornea [29] and retinal organoids
[30]. Moreover, other optical elements than optical windows could also be used to manipulate the
coherence gate shape (Supplementary Section 3). We have shown both qualitative and quantita-
tive improvement in retinal imaging allowing FF-OCT to monitor individual photoreceptors in 4D
with ease and to quickly and robustly compute photoreceptor-based biomarkers close to the foveal
center without using AO. The relative simplicity and low-cost of the curved-field FF-OCT imaging
technique compared to current AO-assisted ophthalmoscopes may pave the way towards the adop-
tion of curved-field FF-OCT as a routine clinical imaging system, providing a new understanding
of retinal structure, function, and diseases.

Acknowledgements
This work was supported by grants entitled “HELMHOLTZ” (European Research Council (ERC)
#610110).

Author contributions
P.M. designed and constructed the optical system, analysed the results and drafted the manuscript.
P.M. and C.B. developed the presented method. P.M., K.Gro and K.Gri. collected data. P.M. and
J.S. wrote the software for the imaging system and for data processing. P.M., K.Grou. J.S., O.T.
and C.B. discussed the results. C.B., K. Gri. and M.F. provided overall guidance to the project.
M.F. obtained funding to support this research. All authors reviewed and edited the manuscript.

Competing interests
P.M. and C.B. are listed as inventors on a patent application (application no. 19306683.4) related
to the work presented in this manuscript. All other authors have nothing to disclose.

                                                3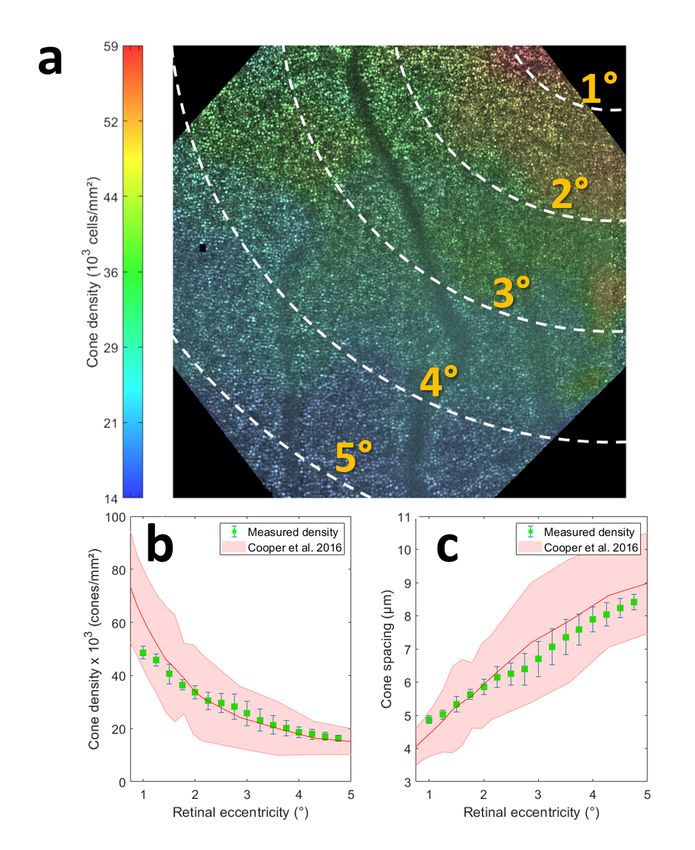
Figure 1: Optical manipulation of the coherence gate geometry and influence on the FOV. a-b,
Cross-sections after introducing N-BK7 optical windows with various thicknesses (in yellow) in the
reference or sample arms when imaging, respectively, the USAF target and the model eye. Note for
the model eye imaging, that the curvature of the coherence gate is quite important when no optical
window is introduced: the difference between the center and the edge is around 20 µm. Measured
and theoretical optical path differences as a function of the FOV for different optical window
thicknesses, as well as their respective degree of curvature, are given in Supplementary Figs. 6(a-
d). c-f, The effect of the coherence gate geometry over the FF-OCT useful FOV. When curvature
is compensated, the FOV is increased by a factor 6.25. Supplementary Videos 1-4 show acquired
Z-stacks for curved and flat coherence gate when imaging the USAF target and the model eye.

                                                4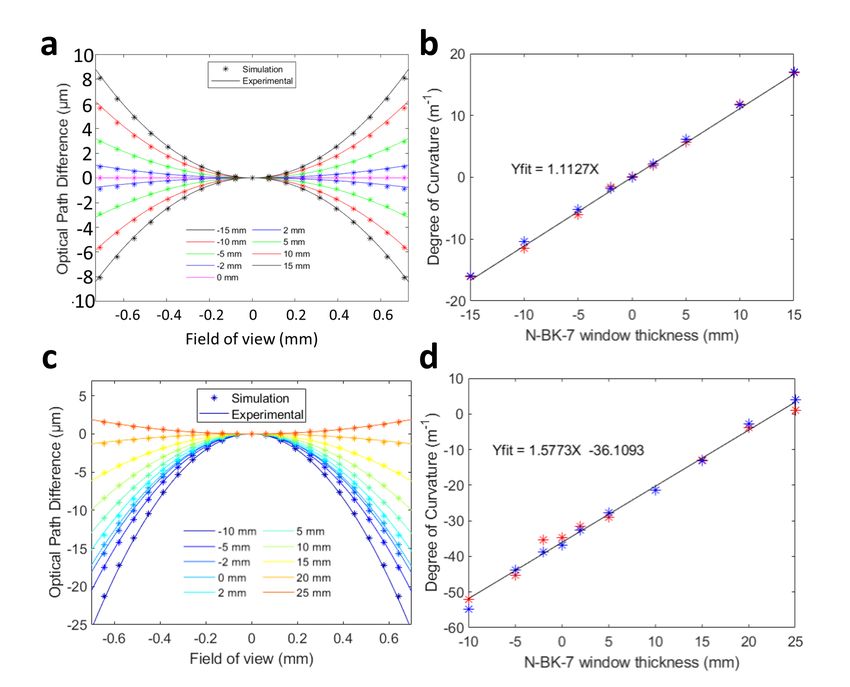
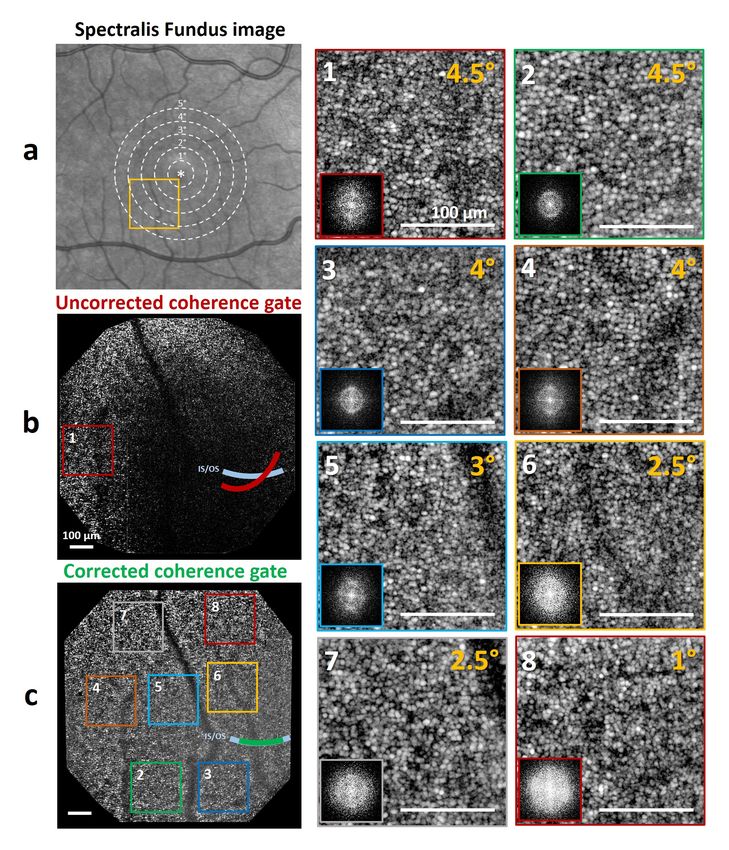
Figure 2: In-vivo retinal imaging allying large FOV and high-resolution. a, Retinal fundus image
obtained using Spectralis scanning-laser ophthalmoscope, where the yellow square indicates the
location of acquired images, i.e. as close as 0.5o from the foveal center. b,c, Respectively, acquired
images from the IS/OS junction before and after correcting for the coherence gate curvature. Note
that, with a curved coherence gate, besides reduced useful FOV, the system becomes very sensitive
to the 3D alignment of the subject in front of the system [24]. This effect is provoked by the
non-coincidence of the curvature center and the FOV center. Subject alignment is better managed
when the strong coherence gate curvature is compensated. Zoomed areas, and their respective
eccentricity (in yellow) and PSD are also presented. All PSDs present the Yellot’s ring [26]. Scale
bar, 100µm.

                                                  5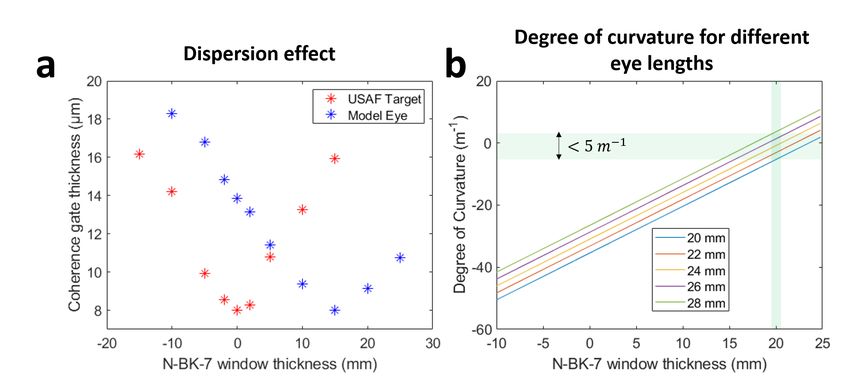
Figure 3: Measurement of photoreceptor-based biomarkers. a, Cone density distribution color
map. b,c, Respectively, the estimated cone density and spacing mean (green squares) and standard
deviation (blue lines) values as a function of the retinal eccentricity computed from a. The red line
and shaded region are respectively the mean computed density and the 95% prediction interval
obtained from a dataset of a 20-eye healthy population using AO scanning-laser ophthalmoscope
[28].

                                                 6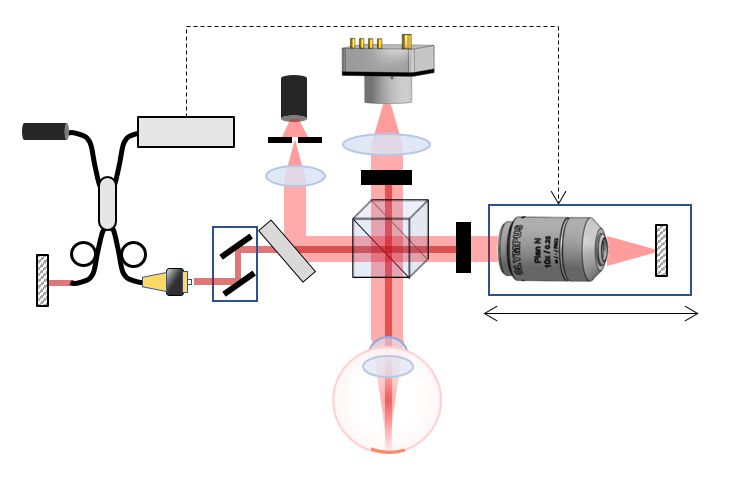
Figure 4: 4D of individual photoreceptors and comparisons with AO-assisted ophthalmoscopes.
a-d, Cone mosaic images acquired at the same region (4.5o eccentricity) for different time points
T1,2,3,4 , with 10 minutes interval between acquisitions, highlighting the capacity of curved-field
FF-OCT to track individual cones in space and time with ease. Green boxes: cones visible for all
four acquisitions. Yellow boxes: cones changing reflectivity. Red hexagons: pattern found in cone
mosaic close to the fovea [27]. e, Cone mosaic image obtained after averaging images from a-d. f-
h, Respectively, cone mosaic image at the same region acquired using AO-ophthalmoscopes. FIO:
Flood-illumination ophthalmoscope. SLO: confocal scanning-laser ophthalmoscope. h, Acquisition
made without closing the AO-loop. Supplementary Videos 6,7 show a cone-to-cone comparison
between FF-OCT image and, respectively, AO-FIO and AO-SLO. i, PSD radial average for images
a-h, where the red-area outlines the expected cone mosaic spatial frequency. PSDs were verticaly
displaced for better visualization. Scale bar, 20 µm.

                                                7
Methods
Samples imaged
To investigate the impact of the asymmetric Linnik interferometer configuration on coherence
gate curvature, three samples were imaged: 1) a standard USAF resolution target; 2) an OEMI-7
model eye (Ocular Instruments, Inc) which takes into account the eye geometry, optical power
and dispersion properties (henceforth, named model eye); and 3) the retina of a healthy volunteer
presenting a refractive error of 1.5 D × 0.5 D × 160o (spherical × cylindrical × axis of cylindrical
errors). Research procedures followed the tenets of the Declaration of Helsinki. Informed consent
was obtained from the subject after the nature and possible outcomes of the study were explained.
This study was authorized by the appropriate ethics review boards (CPP and ANSM (IDRCB
number: 2019-A00942-55)).
Experimental setup
Figure 5 presents the schematic of the custom-built FF-OCT system coupled through a dichroic
mirror with a Thorlabs Ganymede-II SD-OCT system. The FF-OCT comprises a light-emitting
diode (LED) with λ = 850 nm center wavelength and 30 nm bandwidth (M850L3, Thorlabs), used
as a spatially incoherent illumination source, giving a theoretical axial resolution of approximately
8 µm in water. The LED is focused by a condenser 20 mm in front of the eye’s pupil. A physical
diaphragm is positioned in front of the LED, conjugated to the retina and the FF-OCT reference
mirror. The illumination beam is split into the reference and the sample arms by a 50:50 cubic
beam splitter (BS). For the reference arm, an Olympus 10X/0.25 NA Plan Achromat objective
is used with a silicon mirror placed at the focal plane of the objective. The whole reference arm
(microscope objective and silicon mirror) is mounted on a fast voice-coil translation stage (X-
DMQ12P-DE52, Zaber Technologies Inc.), allowing for adjustment of the coherence gate position.
For the sample arm, two configurations were used. In the case of the USAF target imaging, a
microscope objective, identical to the one used in the reference arm, is used leading to a symmetric
Linnik configuration (not shown in Fig. 5). In the case of the eye model and in-vivo retinal imaging,
both were aligned along the optical axis, without the use of a microscope objective leading to an
asymmetric Linnik configuration (shown in Fig. 5). The FF-OCT light beam arrives with an 8
mm diameter in the eye’s pupil. The back-scattered photons from both arms are recombined by
the same BS and focused onto a high-speed (up to 720 Hz at full-frame) CMOS camera (Q-2A750-
Hm/CXP-6, Adimec) for FF-OCT imaging. In the case of in-vivo retinal imaging, the SD-OCT
and the voice-coil translation stage were used to measure and correct for involuntary axial eye
movements during the imaging acquisition in a closed-loop fashion [6].
A x ia l m o t io n o p t ic a l s t a b iliz a t io n c o n t r o l lo o p
F F -O C T
8 5 0 n m
S D -O C T
9 3 0 n m
D e te c to r FS
S P F
S P F
D M
V C T S
V C T S = V o ic e - c o il t r a n s la t io n s t a g e
D M = D ic h r o ic m ir r o r
G S = G a lv a n o m e te r sc a n n e rs
SPF=Sho tr pas f i l t er
FS=Fie l d-s t o p
Figure 5: Schematic drawing of the custom-built FF-OCT system coupled with an SD-OCT for
real-time axial motion correction and FF-OCT coherence gate positioning guidance. In the case of
the USAF target imaging, a microscope objective, identical to the one used in the reference arm,
is used leading to a symmetric Linnik configuration (not shown in the schematic). In the case of
the model eye and in-vivo retinal imaging, no microscope objective is placed in the sample arm,
leading to an asymmetric Linnik configuration (shown in the schematic).
8Image acquisition
In the case of the USAF target and the model eye imaging, a total of 200 images from different
depths were acquired at 10 Hz, by moving the voice-coil translation stage of the reference arm at
a constant speed of 5 µm/s. This procedure allowed us to acquire en-face images from different
depths, forming Z-stacks. This procedure was repeated after adding optical windows of N-BK7
of different thicknesses in the reference or sample arms in order to change the geometry of the
coherence gate.
In the case of living human retinal imaging, The subject was seated in front of the system and
stabilized with a chin and forehead rest and asked to fixate a target placed at an infinite focal
conjugate. During the imaging session, the subject was wearing her prescription glasses to increase
the signal level of FF-OCT [24, 31]. Image acquisition was realized in a dark room, maximizing
the pupil dilation. Phase modulation was performed by the residual axial motion after optical
stabilization [6]. Image sequences were composed of 150 images acquired at 300 Hz using custom-
built software [32]. The FF-OCT camera worked close to saturation to use the whole full well
capacity, decreasing relative importance of shot noise [33]. During image acquisition, the total
power entering the eye from the FF-OCT illumination source and the SD-OCT scanning source
were respectively 1.3 mW (for 0.5 s) and 0.25 mW (continuous scanning), which are below the
ocular safety limits established by the ISO standards for group 1 devices.
Image processing
In the case of the USAF target and the Ocular model eye imaging, each Z-stack was digitally
converted into axial sections, i.e. a cross-sectional view of the sample. This step was possible
by taking into account only the pixels of a central row of each image. Next, image segmentation
was applied using an intensity-based thresholding algorithm and a least square parabola fitting
algorithm, enabling to measure the degree of curvature of converted cross-sections.
For in-vivo retinal imaging, each image was normalized by dividing itself by its mean value.
Since the phase was randomly modulated by the residual tracking error, and to eliminate the in-
coherent terms, we adopted a 2-phase demodulation [6, ?]. The 2-phase demodulation consists
of subtracting one image IN from the next IN +1 and taking the modulus. Next, images with a
very low or absent useful signal, mainly due to an insufficient phase shift between consecutive im-
ages, were automatically detected using an intensity-based threshold algorithm, and then excluded
from the image sequence. Finally, useful images were registered using a custom-built normalized
cross-correlation algorithm, where the image presenting the highest signal level was chosen as the
reference.
Cone density map
To generate the pointwise density map, we divided the cone mosaic image into an overlapping grid
of 300 × 300 pixels (corresponding to 200 µm × 200 µm) regions of interest (ROIs), where each ROI
was displaced from the previous by 30 pixels (corresponding to 20µm). These values were chosen
empirically to provide a good trade-off between pointwise accuracy and map smoothness. Then,
cone density and spacing were computed for each ROI using a fully automated algorithm based
on modal spacing as described in [34]. Image interpolation using splines was used to increase the
size of the cone density map in order to match the cone mosaic image.
Other used imaging modalities
Retinal images of the same subject were also acquired using the following instruments: Spec-
tralis scanning-laser ophthalmoscope (Heidelberg Engineering, Germany) - Fig. 2(a); rtx-1 adap-
tive optics flood-illumination ophthalmoscope (Imagine Eyes, France) - Fig. 4(f) and Supplemen-
tary Video 6; MAORI confocal adaptive optics scanning-laser ophthalmoscope (Physical Sciences,
Inc, Andover, MA, USA) - Fig. 4(g,h) and Supplementary Video 7. All images were acquired
in the same conditions as previously described: image acquisition was realized in a dark room,
maximizing the pupil dilation and the subject was wearing her prescription glasses.
Data availability
The study data are available from the corresponding author upon request.
9Code availability
The acquisition software is available at [32].
10References
[1] E. A. Susaki, K. Tainaka, D. Perrin, F. Kishino, T. Tawara, T. M. Watanabe, C. Yokoyama,
H. Onoe, M. Eguchi, S. Yamaguchi, et al., “Whole-brain imaging with single-cell resolution
using chemical cocktails and computational analysis,” Cell, vol. 157, no. 3, pp. 726–739, 2014.
[2] J. N. Stirman, I. T. Smith, M. W. Kudenov, and S. L. Smith, “Wide field-of-view, multi-region,
two-photon imaging of neuronal activity in the mammalian brain,” Nature biotechnology,
vol. 34, no. 8, p. 857, 2016.
[3] J. Fan, J. Suo, J. Wu, H. Xie, Y. Shen, F. Chen, G. Wang, L. Cao, G. Jin, Q. He, et al.,
“Video-rate imaging of biological dynamics at centimetre scale and micrometre resolution,”
Nature Photonics, vol. 13, no. 11, pp. 809–816, 2019.
[4] A. Dubois, K. Grieve, G. Moneron, R. Lecaque, L. Vabre, and C. Boccara, “Ultrahigh-
resolution full-field optical coherence tomography,” Appl. Opt., vol. 43, pp. 2874–2883, May
2004.
[5] O. Thouvenin, K. Grieve, P. Xiao, C. Apelian, and A. C. Boccara, “En face coherence mi-
croscopy,” Biomed. Opt. Express, vol. 8, pp. 622–639, Feb 2017.
[6] P. Mecê, J. Scholler, K. Groux, and C. Boccara, “High-resolution in-vivo human retinal imag-
ing using full-field oct with optical stabilization of axial motion,” Biomedical Optics Express,
vol. 11, no. 1, pp. 492–504, 2020.
[7] A. London, I. Benhar, and M. Schwartz, “The retina as a window to the brain—from eye
research to cns disorders,” Nature Reviews Neurology, vol. 9, no. 1, p. 44, 2013.
[8] J. J. Hunter, W. H. Merigan, and J. B. Schallek, “Imaging retinal activity in the living eye,”
Annual review of vision science, vol. 5, pp. 15–45, 2019.
[9] J. Jarosz, P. Mecê, J.-M. Conan, C. Petit, M. Paques, and S. Meimon, “High temporal reso-
lution aberrometry in a 50-eye population and implications for adaptive optics error budget,”
Biomedical optics express, vol. 8, no. 4, pp. 2088–2105, 2017.
[10] P. Mecê, E. Gofas-Salas, C. Petit, F. Cassaing, J. Sahel, M. Paques, K. Grieve, and S. Meimon,
“Higher adaptive optics loop rate enhances axial resolution in nonconfocal ophthalmoscopes,”
Optics letters, vol. 44, no. 9, pp. 2208–2211, 2019.
[11] J. Liang, D. R. Williams, and D. T. Miller, “Supernormal vision and high-resolution retinal
imaging through adaptive optics,” JOSA A, vol. 14, no. 11, pp. 2884–2892, 1997.
[12] A. Roorda, F. Romero-Borja, W. J. Donnelly III, H. Queener, T. J. Hebert, and M. C.
Campbell, “Adaptive optics scanning laser ophthalmoscopy,” Optics express, vol. 10, no. 9,
pp. 405–412, 2002.
[13] M. Zacharria, B. Lamory, and N. Chateau, “Biomedical imaging: New view of the eye,” Nature
Photonics, vol. 5, no. 1, p. 24, 2011.
[14] E. Gofas-Salas, P. Mecê, C. Petit, J. Jarosz, L. M. Mugnier, A. M. Bonnefois, K. Grieve, J. Sa-
hel, M. Paques, and S. Meimon, “High loop rate adaptive optics flood illumination ophthalmo-
scope with structured illumination capability,” Applied optics, vol. 57, no. 20, pp. 5635–5642,
2018.
[15] F. Zhang, K. Kurokawa, A. Lassoued, J. A. Crowell, and D. T. Miller, “Cone photorecep-
tor classification in the living human eye from photostimulation-induced phase dynamics,”
Proceedings of the National Academy of Sciences, vol. 116, no. 16, pp. 7951–7956, 2019.
[16] M. Paques, S. Meimon, F. Rossant, D. Rosenbaum, S. Mrejen, F. Sennlaub, and K. Grieve,
“Adaptive optics ophthalmoscopy: Application to age-related macular degeneration and vas-
cular diseases,” Progress in retinal and eye research, vol. 66, pp. 1–16, 2018.
[17] R. S. Jonnal, O. P. Kocaoglu, R. J. Zawadzki, Z. Liu, D. T. Miller, and J. S. Werner, “A review
of adaptive optics optical coherence tomography: technical advances, scientific applications,
and the future,” Investigative ophthalmology & visual science, vol. 57, no. 9, pp. OCT51–
OCT68, 2016.
11[18] N. D. Shemonski, F. A. South, Y.-Z. Liu, S. G. Adie, P. S. Carney, and S. A. Boppart,
“Computational high-resolution optical imaging of the living human retina,” Nature photonics,
vol. 9, no. 7, p. 440, 2015.
[19] T. B. DuBose, F. LaRocca, S. Farsiu, and J. A. Izatt, “Super-resolution retinal imaging using
optically reassigned scanning laser ophthalmoscopy,” Nature Photonics, vol. 13, no. 4, p. 257,
2019.
[20] D. Hillmann, H. Spahr, C. Hain, H. Sudkamp, G. Franke, C. Pfäffle, C. Winter, and
G. Hüttmann, “Aberration-free volumetric high-speed imaging of in vivo retina,” Scientific
reports, vol. 6, p. 35209, 2016.
[21] P. Mecê, J. Jarosz, J.-M. Conan, C. Petit, K. Grieve, M. Paques, and S. Meimon, “Fixational
eye movement: a negligible source of dynamic aberration,” Biomedical optics express, vol. 9,
no. 2, pp. 717–727, 2018.
[22] K. M. Litts, R. F. Cooper, J. L. Duncan, and J. Carroll, “Photoreceptor-based biomark-
ers in aoslo retinal imaging,” Investigative ophthalmology & visual science, vol. 58, no. 6,
pp. BIO255–BIO267, 2017.
[23] P. Xiao, M. Fink, and A. C. Boccara, “Full-field spatially incoherent illumination interferome-
try: a spatial resolution almost insensitive to aberrations,” Opt. Lett., vol. 41, pp. 3920–3923,
Sep 2016.
[24] P. Mecê, P. Xiao, V. Mazlin, J. Scholler, K. Grieve, J.-A. Sahel, M. Fink, and C. Boccara, “To-
wards lens-based wavefront sensorless adaptive optics full-field oct for in-vivo retinal imaging
(conference presentation),” in Optical Coherence Tomography and Coherence Domain Optical
Methods in Biomedicine XXIII, vol. 10867, p. 1086722, International Society for Optics and
Photonics, 2019.
[25] P. Xiao, V. Mazlin, K. Grieve, J.-A. Sahel, M. Fink, and A. C. Boccara, “In vivo high-
resolution human retinal imaging with wavefront-correctionless full-field oct,” Optica, vol. 5,
no. 4, pp. 409–412, 2018.
[26] J. I. Yellott Jr, “Spectral analysis of spatial sampling by photoreceptors: topological disorder
prevents aliasing,” Vision research, vol. 22, no. 9, pp. 1205–1210, 1982.
[27] C. A. Curcio, K. R. Sloan, R. E. Kalina, and A. E. Hendrickson, “Human photoreceptor
topography,” Journal of comparative neurology, vol. 292, no. 4, pp. 497–523, 1990.
[28] R. F. Cooper, M. A. Wilk, S. Tarima, and J. Carroll, “Evaluating descriptive metrics of the
human cone mosaic,” Investigative ophthalmology & visual science, vol. 57, no. 7, pp. 2992–
3001, 2016.
[29] V. Mazlin, P. Xiao, E. Dalimier, K. Grieve, K. Irsch, J.-A. Sahel, M. Fink, and A. C. Boccara,
“In vivo high resolution human corneal imaging using full-field optical coherence tomography,”
Biomed. Opt. Express, vol. 9, pp. 557–568, Feb 2018.
[30] J. Scholler, “Motion artifact removal and signal enhancement to achieve in vivo dynamic full
field oct,” Opt. Express, vol. 27, pp. 19562–19572, Jul 2019.
[31] P. Mecê, V. Mazlin, J. Scholler, P. Xiao, J. Sahel, K. Grieve, M. Fink, and C. Boccara, “Real-
time axial retinal motion tracking and correction for consistent high-resolution retinal imaging
with full-field time-domain optical coherence tomography (ffoct),” Investigative Ophthalmology
& Visual Science, vol. 60, no. 11, pp. 022–022, 2019.
[32] J. Scholler, “FFOCT control and acquisition software,” 2019.
https://doi.org/10.5281/zenodo.3137245.
[33] J. Scholler, V. Mazlin, O. Thouvenin, K. Groux, P. Xiao, J.-A. Sahel, M. Fink, C. Boccara,
and K. Grieve, “Probing dynamic processes in the eye at multiple spatial and temporal scales
with multimodal full field oct,” Biomedical optics express, vol. 10, no. 2, pp. 731–746, 2019.
[34] R. F. Cooper, G. K. Aguirre, and J. I. Morgan, “Fully automated estimation of spacing
and density for retinal mosaics,” Translational Vision Science & Technology, vol. 8, no. 5,
pp. 26–26, 2019.
12[35] R. S. Jonnal, J. Rha, Y. Zhang, B. Cense, W. Gao, and D. T. Miller, “In vivo functional
imaging of human cone photoreceptors,” Optics express, vol. 15, no. 24, pp. 16141–16160,
2007.
[36] W. Sellmeier, “Zur erkarung der abnormen farbenfolge im spectrum einiger. substanzen,”
Annalen der Physik und Chemie, vol. 219, pp. 272–282, 1871.
[37] A. Podoleanu, M. Seeger, G. Dobre, D. Webb, D. Jackson, and F. Fitzke, “Transversal and
longitudinal images from the retina of the living eye using low coherence reflectometry.,”
Journal of biomedical optics, vol. 3, no. 1, p. 12, 1998.
[38] B. W. Graf, S. G. Adie, and S. A. Boppart, “Correction of coherence gate curvature in high
numerical aperture optical coherence imaging,” Optics letters, vol. 35, no. 18, pp. 3120–3122,
2010.
[39] C. Vinegoni, T. Ralston, W. Tan, W. Luo, D. L. Marks, and S. A. Boppart, “Integrated
structural and functional optical imaging combining spectral-domain optical coherence and
multiphoton microscopy,” Applied Physics Letters, vol. 88, no. 5, p. 053901, 2006.
[40] T. S. Ralston, D. L. Marks, P. S. Carney, and S. A. Boppart, “Interferometric synthetic
aperture microscopy,” Nature Physics, vol. 3, no. 2, p. 129, 2007.
[41] H. Kolb, “Gross anatomy of the eye,” in Webvision: The Organization of the Retina and
Visual System [Internet], University of Utah Health Sciences Center, 2007.
[42] A. Pallikaris, D. R. Williams, and H. Hofer, “The reflectance of single cones in the living
human eye,” Investigative ophthalmology & visual science, vol. 44, no. 10, pp. 4580–4592,
2003.
[43] K. Grieve and A. Roorda, “Intrinsic signals from human cone photoreceptors,” Investigative
ophthalmology & visual science, vol. 49, no. 2, pp. 713–719, 2008.
13Supplementary information
Video 1 Z-stack of the USAF target for a curved coherence gate, after adding a 15 mm thick
N-BK7 optical window in the sample arm and breaking the symmetric configuration of the inter-
ferometer.
Video 2 Z-stack of the USAF target for a flat coherence gate, i.e. when no optical window is
introduced in the inteferometer, in a symmetric configuration of the interferometer.
Video 3 Z-stack of the model eye when no optical window is introduced in the inteferometer.
The asymmetry of the reference and the sample arms provoke the appearance of a curved coherence
gate.
Video 4 Z-stack of the model eye after adding a 20 mm thick N-BK7 optical window in the
sample arm, correcting for the coherence gate curvature.
Video 5 Four image sequences acquired in the same region for the same subject, with a 10
minute interval between acquisitions, after compensating for coherence gate curvature. Note in
the zoomed areas, that individual photoreceptors can be monitored frame-by-frame (3 ms interval)
and video-by-video (10 minutes interval). Green boxes highlight cones that are visible in all four
videos. Yellow boxes highlight cones that present a temporal variability in reflectivity, probably
due to phototransduction [35, 22]. Red hexagons highlight the typical pattern in cone mosaic close
to the fovea [27, 28].
Video 6 Cone-to-cone comparison between curved-field FF-OCT cone mosaic image and the
rtx-1 AO flood-illumination ophthalmoscope image for the same subject at the same region.
Video 7 Cone-to-cone comparison between curved-field FF-OCT cone mosaic image and the PSI
MAORI confocal AO scanning-laser ophthalmoscope image, with and without closing the AO-loop,
for the same subject at the same region.
1 Curved coherence gate caused by full-field interferometer asymmetry
The optical path length (OPL) when light propagates in a material x of thickness ex , refractive
index nx for a given angle θx can be expressed as:
N
X ex
OP L(λ) = nx (λ) (1)
x=1
cosθx
Where nx (λ) is given by the Sellmeier equation [36]. The incident angle in a material x, θx ,
can be expressed as a function of the incident angle in the air θ1 , as follows:
sinθ1
θx = sin−1 (2)
nx (λ)
Through Eqs. 1 and 2, one can notice the dependency of the OPL on the wavelength (λ) and
the incident angle in the air (θ1 ):
N
X ex
OP L(λ, θ1 ) = nx (λ) (3)
x=1 cos sin−1 nsinθ
x
1
(λ)
The depth position of the en-face imaged generated by the FF-OCT, i.e. the coherence gate,
is given by the the optical path difference (OPD) between the reference and sample arms:
OP D(λ, θ1 ) = OP Lref erence (λ, θ1 ) − OP Lsample (λ, θ1 ) (4)
If the OPL of both arms are symmetric, as it is the case when two microscope objectives are
placed in both arms, the OPD is null for all values of θ1 , i.e. along the FOV. On the other hand,
an asymmetry of both OPLs creates a dependency on the the wavelength (λ) and the incident
angle in the air (θ1 ), i.e. the FOV. In this last case, OPD would only be null for a given incident
14angle, and it would increase as this angle is increased, the origin of the curvature of the coherence
gate.
Figue 6(a-d) compare our findings in 1(a,b) with the expected theoretical optical path difference
(OPD) for the USAF target and the model eye imaging, according to Eqs. 3 and 4.
Figure 6: Optical path difference along the FOV. (a,c) Experimental data and theoretical values of
the optical path difference as a function of the FOV for the USAF target and the model eye imaging
respectively. Different curvature plots present the effect on the coherence gate after introducing
N-BK7 optical windows, of various thicknesses, in the reference arm (negative values) or in the
sample arm (positive values). (b,d) Degree of curvature as a function of the N-BK7 optical window
thickness, where zero degrees of curvature means a flat profile, for the USAF target and the model
eye imaging respectively.
The appearance of the coherence gate curvature was previously reported for conventional
spectral-domain raster-scanning OCT, mainly linked to the scanning-induced path length vari-
ation in non telecentric optical systems [37, 38]. They also reported that this effect could be
largely ignored in low-NA imaging systems [38], as it is the case of the eye in retinal imaging
application. In the present Letter, we show that the coherence gate curvature is amplified, and no
longer negligible for low-NA FF-OCT, when the symmetry of the Linnik interferometry is broken.
Some solutions to avoid this deformation of the coherence gate, in high-NA OCT, are: the ac-
quisition of images with stage scanning [39], using a common path interferometer [40], or correcting
it in a computationally manner by recovering the phase of the analytic signal from calibration data
[38]. Nevertheless, either these approaches greatly limit the practical use of this technique, or can-
not be applied for in-vivo retinal imaging conditions, or it is not adapted for a FF-OCT modality,
since all points in the field-of-view are collected in parallel manner and not in a sequential manner
as in conventional OCT.
2 Dispersion effect
Another expected effect brought by the asymmetry of the Linnik interferometry is dispersion,
affecting the axial resolution of the FF-OCT (i.e. axial sectioning capacity). This phenomenon
15can be noted in cross-sections of Figs. 1(a,b) as an increase of the coherence gate thickness
(distance between the blue and red curves). Figure 7 (a) shows the FWHM of the coherence gate
thickness (FF-OCT axial resolution) as a function of the optical window thickness in the case
of the USAF target imaging (in red) and the model eye imaging (in blue). Note that for the
USAF target imaging, a flat coherence gate coincides with the best axial sectioning capability,
both happening when no optical window is added (symmetric configuration). In the case of the
model eye imaging, not surprisingly, the optimum correction of dispersion does not coincide with the
optimum correction of coherence gate curvature, since these two phenomena have different physical
origins (Supplementary Section 1). We saw that an optimum compensation of the coherence gate
curvature would be possible with a 22 mm N-BK7 optical window. Fig. 7 (a) shows, for the model
eye imaging, that an optimum dispersion compensation would be possible with a 15 mm of N-BK7
optical window. In this study, in order to compromise and minimize the effects of both curvature
of the coherence gate and dispersion for in-vivo retinal imaging, we used a N-BK7 optical window
with 20 mm thickness. According to Fig. 6(c) and Fig. 7(a), a good trade-off could be found in
this case: the axial resolution would be around 9µm, instead of 8µm, and the degree of curvature
would be lower than 5, meaning an edge-center difference of 1µm. Figure 7(b) shows that this
correction would be suitable for eye lengths varying from 20 mm to 28 mm, covering the majority
of cases in the population [41].
Figure 7: Dispersion effect and eye-length. (A) FWHM of the coherence gate thickness (FF-OCT
axial resolution) as a function of the optical window thickness in the case of the USAF target (red
points) and model eye (blue points) imaging respectively. (B) Expected theoretical value of degree
of curvature (computed using Eq. 1) as a function of the thickness of the N-BK7 introduced to
compensate for coherence gate curvature for different eye lengths. Green shaded area highlights
that a N-BK7 of 20 mm thickness covers the majority of eye lengths in the population (from 20
mm to 28 mm) [41].
3 Adapting the interferometer reference arm to the imaged sample
In this study, we only considered N-BK7 optical windows to minimize effects of both coherence gate
curvature and dispersion. Another solution to optically manipulate the geometry of the coherence
gate is the introduction of a deformable reference mirror in the reference arm. This solution would
decouple the correction of the coherence gate curvature and dispersion, since a suitable optical win-
dow in the sample arm could compensate for dispersion effect and the deformable reference arm
would correct the residual curvature of the coherence gate, without affecting dispersion, improving
signal level, axial resolution and possibly achieving even larger FOV. Moreover, this solution might
extend the curved-field FF-OCT to samples with irregular surface, more complex than a curva-
ture. Nevertheless, the main drawback of this solution is the considerable increase of the system
complexity and cost, making clinical transfer challenging. A solution considering only an optical
window, as initially presented, seems sufficient to be able to optimize for coherence gate geometry
and dispersion for a large population (Supplementary Section 2).
164 Photoreceptor reflectivity variation
One of the most interesting features of photoreceptor mosaic is the temporal and the cone-to-cone
variability in reflectivity [42]. Figures 4 (a-d) and Supplementary Video 5 present both reflectivity
change over time (seconds and minutes) and from cone to cone. This short-term intrinsic variability
in reflectivity has been attributed to phototransduction [35]. This reflectivity can be changed as
a response to a stimulus [35, 43]. Indeed, it would be interesting to image the cone mosaic with
FF-OCT during a light-evoked stimulus to study the reflectivity variation of each individual cone,
a potential metric of photoreceptor health. FF-OCT seems a good imaging system to differentiate
the IS/OS reflectivity signal of interest and multimodal signal from cone outer segment tip and
non-cone sources (for example retinal pigment epithelium) [22], thanks to the high axial resolution
of the system.
17You can also read