Spectroscopic and Theoretical Studies of Hg(II) Complexation with Some Dicysteinyl Tetrapeptides - Hindawi.com
←
→
Page content transcription
If your browser does not render page correctly, please read the page content below
Hindawi
Bioinorganic Chemistry and Applications
Volume 2021, Article ID 9911474, 12 pages
https://doi.org/10.1155/2021/9911474

Research Article
Spectroscopic and Theoretical Studies of Hg(II)
Complexation with Some Dicysteinyl Tetrapeptides

          Elliot Springfield,1 Alana Willis,1 John Merle,1 Johanna Mazlo,2
          and Maria Ngu-Schwemlein 1
          1
              Chemistry Department, Winston Salem State University, Winston-Salem, NC 27110, USA
          2
              Department of Chemistry and Biochemistry, University of North Carolina at Greensboro, Greensboro, NC 27402, USA

          Correspondence should be addressed to Maria Ngu-Schwemlein; schwemleinmn@wssu.edu

          Received 17 April 2021; Accepted 10 July 2021; Published 26 July 2021

          Academic Editor: Domenico Osella

          Copyright © 2021 Elliot Springfield et al. This is an open access article distributed under the Creative Commons Attribution
          License, which permits unrestricted use, distribution, and reproduction in any medium, provided the original work is
          properly cited.

          Tetrapeptides containing a Cys-Gly-Cys motif and a propensity to adopt a reverse-turn structure were synthesized to evaluate how
          O-, N-, H-, and aromatic π donor groups might contribute to mercury(II) complex formation. Tetrapeptides Xaa-Cys-Gly-Cys,
          where Xaa is glycine, glutamate, histidine, or tryptophan, were prepared and reacted with mercury(II) chloride. Their com-
          plexation with mercury(II) was studied by spectroscopic methods and computational modeling. UV-vis studies confirmed that
          mercury(II) binds to the cysteinyl thiolates as indicated by characteristic ligand-to-metal-charge-transfer transitions for bis-
          thiolated S-Hg-S complexes, which correspond to 1 : 1 mercury-peptide complex formation. ESI-MS data also showed dominant
          1 : 1 mercury-peptide adducts that are consistent with double deprotonations from the cysteinyl thiols to form thiolates. These
          complexes exhibited a strong positive circular dichroism band at 210 nm and a negative band at 193 nm, indicating that these
          peptides adopted a β-turn structure after binding mercury(II). Theoretical studies confirmed that optimized 1 : 1 mercury-peptide
          complexes adopt β-turns stabilized by intramolecular hydrogen bonds. These optimized structures also illustrate how specific N-
          terminal side-chain donor groups can assume intramolecular interactions and contribute to complex stability. Fluorescence
          quenching results provided supporting data that the indole donor group could interact with the coordinated mercury. The results
          from this study indicate that N-terminal side-chain residues containing carboxylate, imidazole, or indole groups can participate in
          stabilizing dithiolated mercury(II) complexes. These structural insights on peripheral mercury-peptide interactions provide
          additional understanding of the chemistry of mercury(II) with side-chain donor groups in peptides.

1. Introduction                                                         For example, an oligopeptide containing the Cys-Ala-Ala-
                                                                        Cys sequence, found in the MerP protein, retained its heavy
Bis-cysteinyl sequences are present in many metalloproteins             metal-binding activity [7]. Constrained tetrapeptides, such
that play an important role in metal detoxification, regu-               as Cys-dPro-Pro-Cys, have also been designed to pre-
lation, homeostasis, or transport. The signature Cys-Xaa-Cys            organize the two cysteine residues so that their thiol donor
and Cys-Xaa-Xaa-Cys sequences are found in various types                groups are positioned as “anchors” for mercury(II) coor-
of metal-binding proteins such as metallothioneins [1, 2],              dination [8].
MerP [3] and MerA [4], HAH1 [5], and Atox [6]. Coor-                        Although the arrangement or preorganization of metal
dination to cysteine residues dominates in these metal-                 coordinating groups/atoms is fundamentally important at
protein associations. Accordingly, small peptide models                 the primary metal coordination site of metalloproteins, their
containing such motifs have been designed to understand                 stability or function is often also linked to their local en-
their biological role in some metalloenzymes, and in the                vironment. Such features have been demonstrated in the
rational design of peptide model systems as metal chelators.            design principles of model systems for the binding and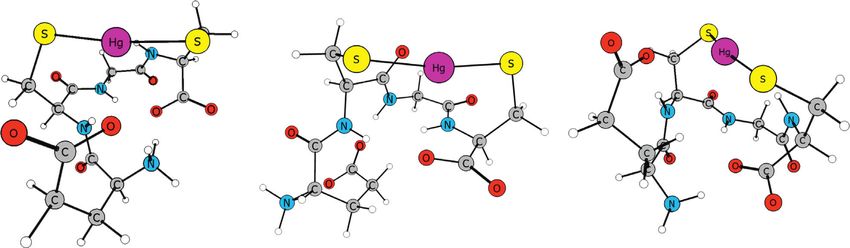
2                                                                                       Bioinorganic Chemistry and Applications

activation of dioxygen by transition-metal complexes. For             some insights into how donor group(s) at the N-terminal
example, Borovik and coworkers designed various tripodal              residue may participate in mercury(II) complexation or
ligands containing local intramolecular H-bonding net-                overall complex stabilization.
works around transition metal ions [9–11].
     The modular nature of peptides makes them versatile in           2. Materials and Methods
offering various possible types of noncovalent intramolecular
local interactions, which can enhance the stability of metal-         2.1. Materials. Fmoc-Cys (Trt) (Wang Resin LL)-resin
peptide associations. Therefore, molecular designs of bis-            (where Fmoc is fluorenylmethyloxycarbonyl, and Trt is
cysteinyl peptides containing side-chain groups that can              triphenylmethyl), 1-hydroxy-7-azabenzotriazole (HOAT),
stabilize the local environment or the metal coordination site        O-(7-azabenzotriazol-1-yl)-N, N, N′, N′-tetramethyluro-
may present advantageous cooperative binding effects. Bis-             nium hexafluorophosphate (HATU), and Fmoc-amino
cysteinyl tetrapeptides with a sequence type Xaa-Cys-Gly-Cys          acids were purchased from Novabiochem (San Diego, CA,
have an intrinsic tendency toward adopting a type II β-turn.          USA). Ethyl cyano(hydroxyimino)acetate (Oxyma Pure)
In this type of peptide reverse turn, it usually has glycine as the   and Fmoc-His (Boc) were purchased from CEM, Corpo-
third residue from the amino terminal of the tetrapeptide             ration (Matthews, NC, USA). Collidine (2, 4, 6-trime-
backbone turn structure; and the 180° turn involves hydrogen          thylpyridine, TMP), triisopropylsilane (TIS), 3, 6-dioxa-1,
bonding between the carbonyl oxygen of the first residue with          8-octanedithiol (DODT), trifluoroacetic acid (TFA), dii-
the amino group hydrogen of the fourth residue [12].                  sopropylcarbodiimide      (DIPCDI),      dichloromethane
Therefore, tetrapeptide Xaa-Cys-Gly-Cys could spatially po-           (DCM), and mercury(II) chloride were obtained from
sition the cysteinyl thiolate groups on the same side of the          Sigma-Aldrich (St. Louis, MO, USA). Mercury compounds
peptidic turn structure to bind “soft” metal ions such as             are hazardous and should be disposed in designated
mercury(II). Its N-terminal residue presents the opportunity          chemical waste containers. HPLC grade water and aceto-
to position potential donor groups such as the indole side-           nitrile, anhydrous ether, and N, N-dimethylformamide
chain of tryptophan, which is both electron-rich and possesses        (DMF) were purchased from Fisher Scientific (Pittsburgh,
an H-donor [13]. It is well documented that this aromatic             PA, USA). Analytical and semiprep reversed-phase C-18
π-group can participate in various types of cation-π inter-           HPLC columns (Gemini: 300 Å, 5 µm) were purchased
actions or shield the coordinated metal against ligand ex-            from Phenomenex, Inc. (Torrance, CA, USA).
change or oxidation [14–20]. In addition, the nonprotonated
imidazole Nim in histidine is a strong metal coordinating             2.2. Preparation of Tetrapeptides. Tetrapeptides (Figure 1)
ligand and is well known in the chelation of zinc in the “zinc-       were prepared by microwave-assisted solid phase peptide
fingers” [21]. Kinetically stable mercury(II) complexes could          synthesis following the standard Fmoc-strategy by using a
be useful for various applications, including effective treat-         CEM Discovery microwave peptide synthesizer (CEM,
ment of wastewater, regeneration of mercury adsorbents, and           Corp., Matthews, NC, USA) as previously described by our
mercury chelation therapy. An understanding of how mer-               group for similar peptides [22, 24]. The analytical HPLC
cury ions form complexes with cysteinyl peptides, which               condition was 0% B to 30% B over 30 min with a flow rate of
contain auxiliary donor group(s), could provide useful in-            1 mL/min, where solvent A is HPLC H2O with 0.1% TFA
sights for optimal mercury immobilization.
                                                                      and solvent B is HPLC acetonitrile with 0.08% TFA. The
     Previously, we reported how the glutamyl carboxylate
                                                                      retention times for these tetrapeptides are 9.7 min, 10.9 min,
group in a tripeptide ligand, Cys-Glu-Cys, and the trypto-
                                                                      9.6 min, and 21.9 min, respectively. Following purification
phan indole group of a pentapeptide, Gly-Cys-Trp-Cys-Gly,
                                                                      by semipreparative HPLC, these peptides were obtained at
affect mercury complex formation and their relative sta-
                                                                      >95% purity at an overall yield of 60%, 58%, 59%, and 43%,
bilities [22, 23]. In continuation of this work, the specific aim
                                                                      respectively. The purified peptides GCGC (molecular mass is
of this study is to gain an understanding of how proximal N-
                                                                      338.07 g/mol), ECGC (410.09 g/mol), HCGC (418.11 g/mol),
terminal amino acid side-chains, consisting of an O-, N-, H-,
                                                                      and WCGC (467.13 g/mol) were characterized by ESI mass
or π-donor, may contribute to complex stability in tetra-
                                                                      spectrometry. The observed mass for their [M+H]+ ion
peptides containing a Cys-Gly-Cys reverse-turn motif.
                                                                      corresponds to the calculated values of 339.08, 411.10,
Accordingly, tetrapeptides Xaa-Cys-Gly-Cys, where Xaa is
                                                                      419.11, and 468.14, respectively (Figure S1).
glycine (control peptide), glutamate, histidine, or trypto-
phan (Figure 1), were prepared and reacted with mercury(II)
chloride. The mercury(II) coordination properties and                 2.3. UV-Vis Spectrophotometry. Stock peptide solutions
peptide backbone-folding tendencies following interactions            were prepared in HPLC grade water previously degassed and
with mercury(II) were studied by spectroscopic methods.               purged with argon. The peptide concentration was deter-
Electrospray ionization mass spectrometry (ESI-MS) was                mined by UV absorbance at 214 or 280 nm [25]. Each tet-
used to characterize the stoichiometry of complexes formed            rapeptide solution was titrated with HgCl2 in 50 mM sodium
in ionized states. Optimized structures of each dithiolate-           phosphate at pH 7. The UV absorption spectra of titrated
mercury(II) peptide complex were compared by molecular                reaction mixtures were acquired on a dual beam Shimadzu
modeling. The proximity of the indole group to the mer-               UV-2401PC series UV-vis spectrophotometer. They were
cury(II) coordination site was also investigated by fluores-           measured at room temperature in a 1 cm path-length quartz
cence spectroscopy. The results of this study will provide            cuvette. A 2.5 mL solution consisting of 50 or 100 µM
Bioinorganic Chemistry and Applications                                                                                          3

                                          SH               SH                             SH                  SH
                              O                    O                         O                       O
                                               H                                               H
                      H2N                      N                OH H2N                         N                   OH
                                  N                    N                         N                       N
                                  H                    H                         H                       H
                                          O                O                              O                  O

                                          Gly-Cys-Gly-Cys (GCGC)         O       OH           Glu-Cys-Gly-Cys (ECGC)
                                               C10H18N4O5S2                                        C13H22N4O7S2
                                                338.071863                                          410.092992
                                          SH               SH                             SH                  SH
                              O                    O                         O                       O
                                               H                                               H
                      H2N                      N                OH H2N                         N                   OH
                                  N                    N                         N                       N
                                  H                    H                         H                       H
                                          O                O                              O                   O
                                      N                                              NH
                             HN
                                          His-Cys-Gly-Cys (HCGC)                          Trp-Cys-Gly-Cys (WCGC)
                                               C14H22N6O5S2                                    C19H25N5O5S2
                                                418.109311                                       467.129712

                    Figure 1: Chemical structures of bis-cysteinyl tetrapeptides and their monoisotopic masses.

peptide was titrated with aliquots of a 50 mM HgCl2 stock           temperature-controlled cell holder (SGL-POS QNW W/
solution prepared in the same buffer. The reaction mixture           CIR). Tryptophan emission fluorescence was measured in
was stirred for 1 min followed by an additional 2 min               the presence of increasing concentration of HgCl2. The
equilibration. The formation of the ligand metal charge-            fluorescence spectra were recorded using 10 µM peptide
transfer (LCMT) band for the binding of Hg2+ to the thi-            solutions in a 3 mL quartz cell that has a path length of 1 cm.
olates was measured at 200 nm. The pH of each final reaction         Mercury(II) chloride stock solution was prepared at 5 mM
mixture was measured and was within 0.05 pH units of 6.6.           and added to the peptide in 50 mM sodium phosphate, pH 7.
                                                                    The excitation wavelength was set at 280 nm and emission
                                                                    spectra were recorded between 290 and 500 nm. The exci-
2.4. LTQ Orbitrap Mass Spectrometry. Samples were ana-              tation and emission slit widths were fixed at 3 nm. The rate of
lyzed on an Orbitrap instrument, the Thermo Fisher Sci-             scanning was set at 1 nm/s. Variable temperature Stern-
entific LTQ Orbitrap XL mass spectrometer (Thermo Fisher,            Volmer plots were conducted at 25°C, 35°C, and 45°C.
San Jose, CA), as described in our previous study [22].
Complexes of the peptides with Hg(II) were evaluated by
reacting samples of Hg(II) and peptide solutions at a molar         2.7. Computational Modeling. The conformation space for
ratio of 1 : 1 in 5 mM ammonium formate, pH 7. The                  each Hg(II)-peptide complex was explored using the Sys-
concentration of Hg(II) and the tetrapeptide were fixed at           tematic pseudo-Monte Carlo Multiple Minimum (SPMC)
7.5 × 10⁻⁵ M. The analysis was conducted after Hg(II) and           search method implemented in Macromodel 11.9 [26] with
peptide were reacted for 45 min. MS scans were acquired             the OPLS2005 force-field. The OPLS2005 molecular me-
over an m/z range of 125–2000. Each sample injection ac-            chanics force-field has no parameters for mercury(II). Pa-
quired 200 scans. ESI-MS spectra are displayed by setting the       rameters for strontium (II) are available for the force-field
base peak at 100% relative abundance, and by labeling the           and were tested as a substitute for mercury(II) since the
m/z value of the most intense peak in each isotopic cluster.        charges are the same and sizes are similar. It was found that
                                                                    structural changes between force-field generated structures
2.5. Circular Dichroism. CD spectroscopic measurements              with strontium (II) and the final structures with mercury(II)
were conducted on a Jasco J-815 Circular Dichroism                  were minor. Therefore, for conformation searching, stron-
Spectrometer (Easton, MD, USA) equipped with a Peltier              tium (II) was used in place of mercury(II) and then replaced
temperature-controlled cell holder (PTC-423 S/C) as pre-            with mercury in subsequent steps. For each complex,
viously reported [23]. Spectra were recorded at 25°C using a        100,000 conformations were generated and tested for sim-
0.1 cm path-length quartz cell with the following parameters:       ilarity. Of the unique structures, those within 100 kJ/mol of
standard sensitivity � 100 mdeg; continuous scanning mode           the lowest OPLS2005 energy were further evaluated via
at 50 nm/min; bandwidth � 1.0 nm; response � 4 sec; data            M06-2X/LANL2DZ single-point energy calculations under
pitch � 0.1 nm. Peptide solutions were prepared at 50 µM in         vacuum conditions. Fifty structures with the lowest M06-
50 mM sodium phosphate at pH 7.                                     2X/LANL2DZ energy advanced to the geometry optimiza-
                                                                    tion stage and high-level energy evaluation as described in
                                                                    the following paragraph.
2.6. Fluorescence. Fluorescence quenching measurements                   Hg(II)-peptide complex geometries were optimized
were carried out on a FluoroMax spectrofluorometer                   using the M06-2X density functional theory method com-
(Horiba Scientific, NJ, USA), equipped with a Peltier                bined with the 6-31G (d, p) basis set for polypeptide atoms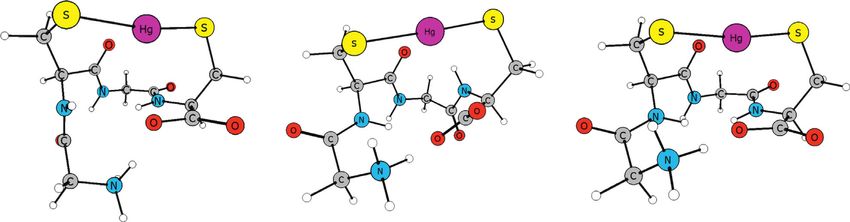
4                                                                                 Bioinorganic Chemistry and Applications

and the Stuttgart/Dresden (SDD) basis set [27] with pseu-       is in agreement with values previously reported for linear,
dopotential for 60 core electrons for the mercury atom.         bisthiolated mercury complexes, which exhibit a charac-
Others and we have applied the M06-2X method and ob-            teristic high-energy LMCT band at ca. 220 nm [8, 23, 31]. In
tained quality geometries for peptides and Hg(II)-peptide       excess of mercury(II), the rate of increase in extinction
complexes [22, 28, 29]. As in our previous studies, single-     coefficient at 210 and 220 nm changed. These new transitions
point energies calculations were obtained using MP2 (full)      may indicate the formation of polymetallic mercury species
with a 6-311G (d, p) basis set on peptide atoms and cc-         as noted in our previous work and by others [8, 23].
pVDZ-PP basis set on mercury atom [22]. The IEFPCM                   Similar trends were observed for the binding of mer-
(SMD) solvation model is used to model an aqueous en-           cury(II) to ECGC and HCGC. They exhibited an absorption
vironment in all calculations with default parameter except a   band at ca. 220 nm with an extinction coefficient of 11560
van der Waals sphere size of 2.34 Å is used for the mercury    and 11660 M−1 cm−1, respectively (Figures 2(b) and 2(c)). In
atom. Vibrational frequencies, using the geometry optimi-       contrast, the extinction coefficient at 220 nm for WCGC was
zation level of theory, were determined to ensure all opti-     significantly lower (5780 M−1 cm−1) (Figure 2(d)). Following
mized complexes were minima having no imaginary                 titrations with increasing mercury(II), a new absorbance
vibrational frequencies.                                        maximum band developed at ∼227 nm. As established
    Structure stability was estimated using the Gibbs energy    previously by others, the Bb absorption band of the tryp-
in solution (Gsoln) calculated by using (1), as previously      tophan indole ring around 220 nm will weaken and undergo
described [23]. The Gaussian09 software was used for all        a red shift when its π electrons interact with a cation
M06-2X and MP2 calculations [30].                               [17, 32, 33]. For example, Okada and Miura reported such
                                                                changes in the absorption spectra of Ctr4NT, a model
                   Gsoln � Ggas + ΔGsolv .               (1)
                                                                peptide of Ctr4, a copper transport protein of fission yeast,
                                                                when it binds Cu(I). They noted that the Cu(I)-bound
                                                                peptide spectrum minus the free peptide spectrum showed a
3. Results and Discussion                                       pair of negative/positive peak at 220/232 nm, a diagnostic
3.1. Design and Synthesis of Bis-Cysteinyl Tetrapeptides.       red shift of the Bb band that indicates indole π-cation in-
The bis-cysteinyl tetrapeptides (Figure 1) were prepared by     teraction [17]. In the absorption difference spectrum of
microwave-irradiated solid phase peptide synthesis follow-      WCGC (Figure 2(d)), a pair of minimum and maximum
ing the standard Fmoc-strategy as previously described for      absorption bands at 220/227 nm are consistent with this red
analogous compounds [22, 24]. Their sequence was designed       shift, which suggests that its indole group could be par-
to have a propensity to adopt the common β-turn involving       ticipating in some type of cation-π interaction. We have
four amino acids [12]. Glutamic acid, histidine, or trypto-     previously reported similar spectral changes for model
phan, consisting of O-, N-, H- or π-donor(s), respectively,     pentapeptides whereby its tryptophan indole group could
was selected as the N-terminal amino acid. Its glycine an-      interact with mercury(II) or ammonium cations [23].
alogue provides the reference compound to evaluate the how
such donor groups may participate in peptide turn structure
and complex formation. Crude peptides were purified to at        3.3.    Electrospray    Ionization     Mass     Spectrometry.
least 95% purity by semipreparative high performance liquid     Formation of the mercury-peptide complexes was also
chromatography (HPLC) and ESI-MS analysis confirmed              verified by ESI-MS. Reaction mixtures containing equimolar
the expected molecular mass.                                    mercury(II) to peptide ratio were analyzed. Figure 3 shows
                                                                the source spectra for the tetrapeptides and their mercu-
                                                                riated adducts. The major mercury(II) complex detected for
3.2. UV-Vis Spectrophotometry. The formation of complexes       the four tetrapeptides corresponds to 1 : 1 mercury-peptide
between mercury(II) and each tetrapeptide was studied by        complex. Figures 3(a)–3(d) insets show that the experi-
monitoring the ligand-to-metal charge-transfer (LMCT)           mental mercury isotopic pattern for the major 1 : 1 mercury-
transitions for S---Hg bonds in the mid-UV energy range.        peptide adducts matches well with the calculated isotopic
The LMCT band was measured by subtracting the back-             pattern [34]. They exhibit the signature isotopic pattern,
ground spectrum of the peptide in the absence of mercu-         which is consistent with the seven naturally occurring
ry(II). Figure 2(a) shows the absorption difference spectra      isotopes of mercury and their natural abundances. The m/z
for GCGC following titrations with increasing mole              values of each 1 : 1 mercury-peptide adduct corresponds to
equivalence of mercury(II). A steady increase in the ab-        double deprotonations, likely from two thiol groups to form
sorption bands centered at ca. 210 and 220 nm up to one         thiolates, which then act as the coordinating donor groups to
equivalence of mercury(II) indicates the formation of a         form the respective dithiolated mercury complexes. These
complex with 1 : 1 mercury to peptide stoichiometry.            mercury-peptide complexes also form cationized adducts
Changes in the 210 nm absorption difference band reflect          with Na+ and/or K+. Minor mercuriated peptide dimers [1 : 2
changes in the peptide amide absorption (n to π∗ ) following    Hg(peptide)2 and 2 : 2 Hg2(peptide)2] and trimer [3 : 3
structural changes in the peptide backbone when GCGC            Hg3(peptide)3] are also detected as cationized adducts. Their
binds mercury(II). The ca. 220 nm absorption shoulder band      m/z values also correspond to double deprotonations from
exhibits an extinction coefficient of 11560 M−1 cm−1 at 1 : 1     the peptide for each mercury associated with the respective
mercury(II) to GCGC stoichiometry (Figure 2(a) inset). This     complex.
Bioinorganic Chemistry and Applications 5
20
15
15
Δε (M–1cm–1)·103
Δε (M–1cm–1)·103
10
10 10
Δε (M–1cm–1)·103
Δε (M–1cm–1)·103
10
5
0
5 0
0 0.5 1 1.5
5 Equiv of Hg(II) 0 0.5 1 1.5 2
Equiv of Hg(II)
220nm
210nm 220 nm
210 nm
0 0
200 220 240 260 280 300 320 340 200 220 240 260 280 300 320 340
Wavelength (nm) Wavelength (nm)
(a) (b)
15
8 10
15
Δε (M–1cm–1)·103
Δε (M–1cm–1)·103
10 6
10 5
Δε (M–1cm–1)·103
Δε (M–1cm–1)·103
5
4 0
5 0 0 0.4 0.8 1.2 1.6 2
0 0.5 1 1.5 Equiv of Hg(II)
Equiv of Hg(II)
2 220nm
220nm 210nm
210nm
0 0
200 220 240 260 280 300 320 340 200 220 240 260 280 300 320 340
Wavelength (nm) Wavelength (nm)
(c) (d)
Figure 2: UV absorption difference spectra [Δε � ε (HgPeptide)-ε (Peptide)] correspond to GCGC (a), ECGC (b), HCGC (c), and WCGC
(d) from titration with 0.2 to 1.0 mole equiv of HgCl2. Inset shows changes in extinction coefficient values at specified wavelengths versus
mole equiv of HgCl2 added.
3.4. Circular Dichroism. Figures 4(a)–4(d) show the CD 193 nm. These CD spectra resemble a peptide backbone
spectra of each tetrapeptide before and after titrations with reverse turn corresponding to a β-turn type, reminiscent of a
mercury(II) at 0.2 mol equiv increments. The free peptides class B CD spectrum [35]. Theoretical calculations by
GCGC (Figure 4(a)) and ECGC (Figure 4(b)) show a weak Woody and others predicted that this turn type are char-
nπ∗ -type transition negative band at ca. 222 nm, a weak acterized by a strong positive band between 200 and 210 nm
positive band at ca. 200 nm, and a negative band at ca. (nπ∗ transition), and a strong negative band between 180
190 nm (ππ∗ transitions). Figure 4(c) shows the CD spec- and 190 nm (ππ∗ transitions) [35]. As shown in
trum of HCGC, which exhibits two low amplitude negative Figures 4(a)–4(d), each peptide-mercury complex exhibits
bands at 230 nm and 192 nm. The relatively more hydro- strong CD signals corresponding to this β-turn type. This
phobic peptide, WCGC, shows two positive bands at ca. reverse turn of the peptide chain could position the
225 nm and 197 nm, and a negative band at ca. 214 nm N-terminal side-chain group in proximity to the mercury(II)
(Figure 4(d)). These relatively low intensity CD bands (less coordination site to participate in complex stabilization.
than ± 2 × 10⁴ deg M−1 cm−1) indicate that these free tetra- Figure 4 insets show an increase in the positive ellipticity at
peptides exhibit very little secondary structure and do not 210 nm and negative ellipticity at 193 nm that are linearly
form any dominant preorganized turn conformations. dependent on the concentration of mercury(II) in the solution.
However, in the presence of increasing concentrations of These spectra also exhibit one isodichroic point at ca. 200 nm
mercury(II), their CD spectra intensified with the devel- indicating transitions to a common secondary structure fol-
opment of a positive band at 210 nm and a negative band at lowing titrations with mercury(II) up to one-to-one mole6 Bioinorganic Chemistry and Applications
539.03 [(M-2H) + Hg + H]+ 537 539.03 Experimental 539.03 Calculated
100
80
Relative abundance
535
541
60
[(M-2H) + H]+ 543
40 337.06 532 536 540 544 535 537 539541543
+
338.08 ([M-2H) + Hg + Na]
20 [M + H]+ 561.01
[(2M-2H) + Hg + H]+ 1074.06 [(2M-4H) + 2Hg + H]
+
+
626.11 875.09 1612.08 [(3M-6H) + 3Hg + H]
0
400 600 800 1000 1200 1400 1600 1800 2000
m/z
(a)
+
611.05 [M-2H + Hg + H] 609 611.05 Experimental 611.05 Calculated
100
[M + H]+
80 411.10
Relative abundance
607
613
60 + 615
[M-2H + Hg + K]
605 610 615 607 609 611613615
40 [M + K]+ 649.01
+
[2M + H] [(2M-4H) + Hg + H]+
449.05 821.19
20
1019.13 1218.10 [(2M-4H) + 2Hg + H]+
0
400 600 800 1000 1200 1400 1600 1800 2000
m/z
(b)
+
619.07 [M-2H + Hg + H] 619.07 Experimental 619.07 Calculated
100 617
80
Relative abundance
615
[M + H]+ 621
60 419.11 623
614 618 622 615 617 619 621 623
40 [M-2H + Hg + Na]+
[M + Na]+
641.05
451.10 +
20 657.02 [M-2H + Hg + K] [(2M-4H) + 2Hg + H]+
1234.13
0
400 600 800 1000 1200 1400 1600 1800 2000
m/z
(c)
+ 668.09 Experimental 668.09 Calculated
668.09 [M-2H + Hg + H] 666
100
80
Relative abundance
664
670
60 662 672
[M + H]+ 660 665 670 664666668670672
40 468.14
[M-2H + Hg + Na]+ [(2M-4H + Hg + H]+
20 690.07
+ [(2M-4H + 2Hg + H]+
706.05[M-2H + Hg + K] 1333.17
1133.21
0
400 600 800 1000 1200 1400 1600 1800 2000
m/z
(d)
Figure 3: Electrospray ionization mass spectra of reaction mixtures containing 1 to 1 ratio of Hg(II):tetrapeptides. (a) GCGC + Hg2+,
(b) ECGC + Hg2+, (c) HCGC + Hg2+, (d) WCGC + Hg2+, and the m/z value of the most intense peak in each isotopic cluster. Insets show the
experimental and calculated mercury isotopic patterns for the 1 : 1 mercuriated peptide adducts.
equiv ratio. However, in excess of mercury(II), the intensity reported a similar observation for a Hg(II)-Trp interaction
of the CD bands weakens. As observed in their corre- [23]. Based on these comparisons and UV spectral changes
sponding UV spectra (Section 3.2), this may be due to the of the indole Bb transition band for WCGC (Section 3.2), the
formation of polymetallic species, resulting in the loss of indole group in WCGC could be undertaking a cation-π
structural integrity. interaction, though it may be a weak or transient interaction
In the presence of equimolar mercury(II), WCGC also based on the relatively small negative CD signal.
showed a weak negative band ca. 235 nm (Figure 4(d)
bottom inset showing magnified view). Yorita et al. earlier
reported a similar development of a negative CD band at 3.5. Tryptophan Fluorescence Spectroscopy. Figure 5 shows
223 nm, which was characterized as a signature CD band for the fluorescence emission spectra of WCGC following ti-
a Cu(II)-Trp cation-π interaction [36]. Previously, we also trations with mercury(II). About 70% of its intrinsicBioinorganic Chemistry and Applications 7
20 20
210nm 210 nm
10 193nm 193 nm
10
15 15
ME (×104)
ME (×104)
0 0
10 10
Molar ellipticity (×104)
Molar ellipticity (×104)
–10 –10
5 5
0 0.2 0.4 0.6 0.8 1 0 0.2 0.4 0.6 0.8 1
Equiv of Hg(II) Equiv of Hg(II)
0 0
–5 –5
–10 –10
–15 –15
190 200 210 220 230 240 250 260 190 200 210 220 230 240 250 260
Wavelength (nm) Wavelength (nm)
(a) (b)
20 210nm
210nm 15 193nm
10 193nm 10
15
ME (×104)
ME (×104)
0
10 0
10
Molar ellipticity (×104)
Molar ellipticity (×104)
–10 5 –10
5 0 0.2 0.4 0.6 0.8 1
0 0.2 0.4 0.6 0.8 1 Equiv of Hg(II)
Equiv of Hg(II)
0
0
–5 Hg(II): peptide 1:1
–5
–10
–10
230 240 250 260
–15 nm
–15
190 200 210 220 230 240 250 260 190 200 210 220 230 240 250 260
Wavelength (nm) Wavelength (nm)
(c) (d)
Figure 4: Circular dichroism spectra of 100 μM tetrapeptides, (a) CGCG, (b) ECGC, (c) HCGC, and (d) WCGC following titrations with
increasing mole equiv of HgCl2 as indicated by direction of arrow for 210 nm band. Insets show changes in molar ellipticity value at 193 nm
and 210 nm versus mole equiv of HgCl2 added.
fluorescence is quenched after an equiv amount of mer- diffusive collisions. However, the small degree of temper-
cury(II) was added. The fluorescence of the indole group in ature dependent quenching indicates that the tryptophan
tryptophan is very sensitive to changes in polarity, and indole could participate in cation-π interaction with the
noncovalent interactions such as cation-π associations in- coordinated mercury. This interaction could stabilize the
volving metal or ammonium ions [18, 37–40]. Its fluores- mercury-peptide complex and possibly provide a hydro-
cence emission can be quenched by mercury(II) via complex phobic shielding effect for the dithiolated mercury.
formation resulting in static quenching, or diffusive en-
counters that result in dynamic quenching [41]. Dynamic
quenching is a diffusion-controlled process, which increases 3.6. Computational Studies. To understand how the N-ter-
at higher temperature due to faster diffusion. In contrast, minal side-chain group may contribute to the structural
higher temperature usually decreases static quenching due to stability of a XCGC peptide-mercury(II) complex in aqueous
dissociation of weakly bound complexes [42]. Therefore solution, 1 : 1 mercury(II)-peptide complexes were opti-
variable temperature fluorescence quenching of WCGC by mized and evaluated for stability. Figure 6 shows the three
mercury(II) could be used to gauge the strength of any most stable M06-2X/6-31G (d, p)/SDD optimized structures
mercury(II)-indole-π interactions. Figure 5 (inset) presents found for each mercury-peptide complex. All tetrapeptides
the Stern-Volmer plot for the fluorescence quenching of are in a zwitterion protonation state and cysteine thiol and
WCGC by mercury(II) at 25°C, 35°C, and 45°C. These plots glutamic acid carboxylate groups are deprotonated. Table 1
show an upward curvature, which is characteristic of fluo- provides some thermodynamic values used to determine
rescence quenching via both complex formation and Gsoln (1) for each complex in Figure 6. Coordinates and select8 Bioinorganic Chemistry and Applications
5 dithiolated mercury and the ammonium group. This flexible
3.5
0μM Hg2+ 25°C
side-chain carboxylate O-donor interacts with the coordi-
35°C
3 45°C nated mercury with O---Hg distances of 2.68 Å in
Fluorescence emission (a.u.) ×105
4 2.5 Hg(ECGC)-1, and 2.54 Å in Hg(ECGC)-3. Alternatively,
Fo/F
2
hydrogen bonds with the N-terminal ammonium group and
3
enables the C-terminal carboxylate oxygen to interact with
1.5
the thiolated mercury [Hg(ECGC)-2] instead. Although O-
1 donors have a lower affinity for mercury(II) than S-donors,
0 2 4 6 8 10
2 [Hg(II)] μM
these optimized structures indicate that they can provide
auxiliary binding to stabilize the thiolated mercury. From
10μM
Gibbs energy in solution, Hg(ECGC)-1 is the most stable by
1 4.1 kJ/mol over Hg(ECGC)-2 and by 6.0 kJ/mol over
Hg(ECGC)-3. From ΔH0, Hg(ECGC)-1 is the most stable by
43 kJ/mol over Hg(ECGC)-2 and by 27 kJ/mol over
0
Hg(ECGC)-3. The intrinsic stability in Hg(ECGC) com-
300 350 400 450 500
plexes is maximum when the glutamate carboxylate interacts
Wavelength (nm)
with mercury. Hg(ECGC)-1 also has the lowest Gibbs energy
Figure 5: Fluorescence spectra of 10 µM WCGC following titration of solvation indicating its stability derives mainly from
with increasing concentrations of mercury(II) at 35°C. Inset: Stern- strength of the glutamate carboxylate to mercury
Volmer plots at 25°C, 35°C, and 45°C. interaction.
The optimized structures for Hg(HCGC) complexes are
Gaussian output information for all structures in Figure 6 shown in Figure 6(c). These structures show that the N-
are provided in the supplementary information (Table S1). terminal histidyl side-chain group is also flexible and con-
tributes to complex stability by reinforcing the peptide turn
structure via an Nim-H---O hydrogen bond with the C-
3.6.1. 1 : 1 Hg(XCGC) Complexes. Stable 1 : 1 complexes terminal carboxylate group [Hg(HCGC)-1 and Hg(HCGC)-
(Figure 6) form with two S‒Hg bonds (∼2.40 Å) having an 2]. This hydrogen bonding with the C-terminal carboxylate
S‒Hg‒S angle just bent from linear (167°–178°). Another oxygen is more stabilizing than when the Nim-H forms a
common structural feature among the complexes includes hydrogen bond with the first peptide bond as shown in
O---Hg interactions (∼2.7 Å) between the second peptide Hg(HCGC)-3. These results show that the N-terminal his-
carbonyl oxygen and the dithiolated mercury. All these tidyl residue can contribute to stabilizing the peptide turn
optimized structures show a β-turn that is also stabilized by structure via intramolecular hydrogen bonding. From Gibbs
intramolecular hydrogen bonds between the peptide bonds, energy in solution, Hg(HCGC)-1 is the most stable by 3.3 kJ/
as well as that between the N-terminal ammonium and C- mol over Hg(HCGC)-2 and by 8.6 kJ/mol over Hg(HCGC)-
terminal carboxylate groups. The above structural features 3. From ΔH0, Hg(HCGC)-2 is the most stable by 21 kJ/mol
are well exemplified in each complex particularly the over Hg(HCGC)-1 and by 30 kJ/mol over Hg(HCGC)-3.
Hg(GCGC) complexes which have no N-terminal amino The stability of the complex is favored when the imidazole
acid side functionality (Figure 6(a)). N-H hydrogen interacts with the C-terminal carboxylate
Table 1 provides some thermodynamic values and Gibbs group. A stability decrease is predicted when the imidazole
energies in solution (Gsoln) for each complex as shown in N-H instead interacts with the N-terminal amide carbonyl
Figure 6. Since relative energies were calculated and not oxygen (Hg(HCGC)-3).
complexation energies, thermodynamic comparisons are Figure 6(d) shows the optimized structures for the
limited to optimized mercury complexes with the same peptide WCGC, which contains an indole-π donor group. In
peptide. From Gibbs energy in solution, Hg(GCGC)-1 is the complex Hg(WCGC)-1 the hydrogen of the cysteinyl beta
most stable by 2.1 kJ/mol over Hg(GCGC)-2 and by 3.3 kJ/mol carbon is 2.80 Å from the indole benzo ring and in complex
over Hg(GCGC)-3. This energy range is small. When con- Hg(WCGC)-3 they are 2.67 Å apart. These Cβ-H and indole-
sidering the sum of electronic MP2 energy and zero-point π interactions enable the indole ring to shield one end of the
vibrational energy (ZPVE) (ΔH0, change in enthalpy at 0 K coordination site while the dithiolated mercury is addi-
using data in Table 1), Hg(GCGC)-2 is more stable than tionally stabilized by two O-donors, an amide carbonyl and
Hg(GCGC)-1 by 78 kJ/mol and Hg(GCGC)-3 is more stable the C-terminal carboxylate. To determine the source of
than Hg(GCGC)-1 by 42 kJ/mol. Hg(GCGC)-1 has the most stability gained from the observed Cβ-H and indole inter-
negative Gibbs energy of solvation indicating its stability action, atomic charges were predicted by conducting a
derives mainly from favorable solvation. The intrinsic stability, Natural Population Analysis (NPA) [41] using MP2 den-
via ΔH0, of Hg(GCGC)-2 may be due to both oxygen atoms of sities from the gas-phase single-point calculations for these
the C-terminal carboxylate being involved in intramolecular mercury complexes. The cysteine Cβ-H bond directed to-
interactions (O---Hg and O---HN). ward the indole ring is predicted to be more polar than the
Figure 6(b) shows optimized structures for Hg(ECGC) other Cβ-H bond, with Cβ charge of −0.49 and H charge of
complexes. With a glutamyl residue at the N-terminal, the +2.2. This indicates that the observed Cβ-H and indole
deprotonated glutamate group shows an affinity for the interaction is similar to the well-established polarizedBioinorganic Chemistry and Applications 9
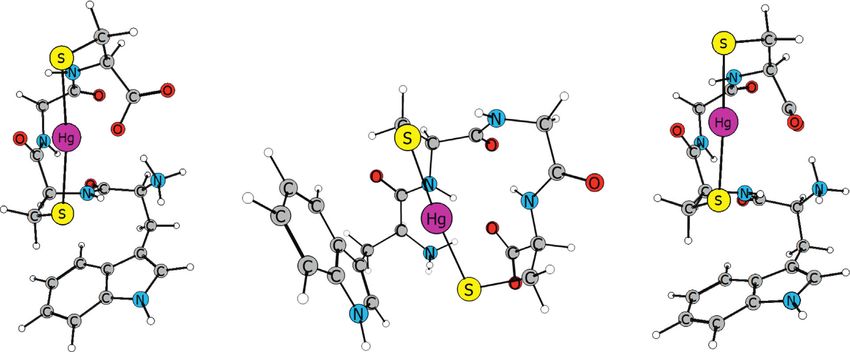
Hg(GCGC)-1 Hg(GCGC)-2 Hg(GCGC)-3
(a)
Hg(ECGC)-1 Hg(ECGC)-2 Hg(ECGC)-3
(b)
Hg(HCGC)-1 Hg(HCGC)-2 Hg(HCGC)-3
(c)
Hg(WCGC)-1 Hg(WCGC)-2 Hg(WCGC)-3
(d)
Figure 6: Three most stable Hg(XCGC) conformations (Gsolution) for each tetrapeptide where X is glycine (a), glutamate (b), histidine
(c), and tryptophan (d). Complex with 1 designation is the most stable conformation in the group.10 Bioinorganic Chemistry and Applications
Table 1: Thermodynamic values for the determination of Gsoln and relative Gibbs energy in solution for each complex.
Ee ZPVE G ΔG
Complex name G (solution) (a. u.) Relative ΔG (soln) (kJ/mol)
(MP2, gas) (a. u.) unscaled (a. u.) (298 K, gas)a (a. u.) (solv) (a. u.)
Hg(GCGC)-1 −1932.47170 0.29444 −1932.24520 −0.11076 −1932.35595 0.00
Hg(GCGC)-2 −1932.50036 0.29341 −1932.27386 −0.08131 −1932.35517 2.06
Hg(GCGC)-3 −1932.48771 0.29436 −1932.26064 −0.09405 −1932.35469 3.30
Hg(ECGC)-1 −2198.66172 0.35246 −2198.38601 −0.14368 −2198.52969 0.00
Hg(ECGC)-2 −2198.64601 0.35295 −2198.37097 −0.15716 −2198.52813 4.07
Hg(ECGC)-3 −2198.65214 0.35311 −2198.37455 −0.15284 −2198.52739 6.02
Hg(HCGC)-1 −2196.27425 0.37506 −2195.97738 −0.10102 −2196.07840 0.00
Hg(HCGC)-2 −2196.28329 0.37603 −2195.98458 −0.09257 −2196.07716 3.27
Hg(HCGC)-3 −2196.27131 0.37578 −2195.97497 −0.10014 −2196.07511 8.64
Hg(WCGC)-1 −2333.55156 0.43329 −2333.20130 −0.08360 −2333.28490 0.00
Hg(WCGC)-2 −2333.55112 0.43332 −2333.20024 −0.08409 −2333.28434 1.47
Hg(WCGC)-3 −2333.55147 0.43343 −2333.19987 −0.08371 −2333.28358 3.46
a
Using scaled zero-point vibrational energy (ZPVE).
C-H···π interaction, a weak hydrogen-bond-like interac- corroborate the above spectroscopic results and show that
tion, which is often documented in proteins [19, 20] and each mercury-peptide complex adopts a reverse-turn sec-
identified as metal ligand cation-π interactions in some ondary structure that is stabilized by intramolecular hy-
metalloproteins [43, 44]. In the Hg(WCGC)-2 complex, drogen bonds. They also show that the side-chain donor
the indole ring is close to mercury having a distance of group present in the N-terminal residue is flexible and can
3.27 Å between mercury and the fused carbon next to the stabilize the coordinated mercury or its local environment
ring nitrogen. In this case, the indole ring could partic- via O---Hg, hydrogen bonding, C-H---π, or mercury cation-
ipate in stabilizing the complex via cation-π interaction π interactions. Additionally, the indole ring may act as a
[14, 15], as indicated by the spectroscopic studies de- hydrophobic shield for the coordinated mercury. This
scribed in Sections 3.2, 3.4, and 3.5. Therefore, it is peptide model-based study shows that amino acid side
conceivable the flexible side-chain indole group in chains containing one or more donor groups can serve as
Hg(WCGC) complex can serve as a hydrophobic shield auxiliary binding group(s) to enhance the immobilization of
for the thiolated mercury. From Gibbs energy in solution, mercury(II).
Hg(WCGC)-1 is the most stable by 1.5 kJ/mol over
Hg(WCGC)-2 and by 3.5 kJ/mol over Hg(WCGC)-3. Data Availability
Using ΔH0, Hg(WCGC)-2 is the most stable by 0.5 kJ/mol
over Hg(WCGC)-1 and by 1 kJ/mol over Hg(WCGC)-3. The mass spectral and computational data used to support
This Gibbs energy range is small (3.5 kJ/mol) and each the findings of this study are included within the supple-
structure has nearly the same Gibbs energy of solvation mentary information file.
(1.3 kJ/mol difference). Interaction of the indole ring with
the N-terminal Cys-Cβ-H or with the mercury also has Conflicts of Interest
nearly indistinguishable intrinsic stabilities. Furthermore,
electronic interactions involving the pi system of the The authors declare that there are no conflicts of interest
indole influence the stability of the complex since they regarding the publication of this paper.
exist in each of the three low energy structures.
Authors’ Contributions
4. Conclusions
M. Ngu-Schwemlein is responsible for project conceptual-
By combining spectroscopic and theoretical studies, we have ization and administration, funding acquisition, and original
gained some structural insights into the associations of draft preparation. J. Merle is responsible for the computa-
mercury(II) with four tetrapeptides containing a Cys-Gly- tional work and writing the original draft for the compu-
Cys motif and an O-, N-, H-or aromatic π donor group. UV- tational section. J. Mazlo conducted the ESI-MS studies with
vis spectroscopic and ESI-MS studies indicate that mercu- M. Ngu-Schwemlein. E. Springfield completed some spec-
ry(II) binds to the cysteinyl thiolates of these peptides to troscopic studies under the supervision of M. Ngu-
form predominantly 1 : 1 dithiolated mercury complexes. Schwemlein. A. Willis worked on the computational studies
The CD spectral data show that these tetrapeptides do not under the supervision of J. Merle.
adopt preorganized turn structures. However, mercury(II)
binding readily induces reversed peptide backbone turn Acknowledgments
structures. UV-vis absorption and fluorescence quenching
of tryptophan indicate that the tryptophan indole ring in The authors acknowledge helpful suggestions regarding
WCGC can participate in mercury cation-π interaction. instrument setup from Daniel Todd at the Triad Mass
Optimized stable structures of 1 : 1 mercuriated tetrapeptides Spectrometry Facility, University of North Carolina atBioinorganic Chemistry and Applications 11
Greensboro. The US National Science Foundation (Grant [16] T. W. Craven, M.-K. Cho, N. J. Traaseth, R. Bonneau, and
no. CHE-1831020) supported this work. K. Kirshenbaum, “A miniature protein stabilized by a cati-
on−π interaction network,” Journal of the American Chemical
Society, vol. 138, no. 5, pp. 1543–1550, 2016.
Supplementary Materials [17] M. Okada and T. Miura, “Copper (I) stabilization by cysteine/
tryptophan motif in the extracellular domain of Ctr4,” Journal
Figure S1: ESI-MS spectra of all tetrapeptides. Table S1: of Inorganic Biochemistry, vol. 159, pp. 45–49, 2016.
Cartesian coordinates (Å) for all structures from modeling [18] D. K. Chakravorty, B. Wang, M. N. Ucisik, and K. M. Merz Jr.,
studies are provided. (Supplementary Materials) “Insight into the Cation−π interaction at the metal binding site
of the copper metallochaperone CusF,” Journal of the American
Chemical Society, vol. 133, no. 48, pp. 19330–19333, 2011.
References [19] M. Brandl, M. S. Weiss, A. Jabs, J. Sühnel, and R. Hilgenfeld,
“C-H· · ·π-interactions in proteins,” Journal of Molecular Bi-
[1] D. H. Hamer, “Metallothionein,” Annual Review of Bio-
ology, vol. 307, no. 1, pp. 357–377, 2001.
chemistry, vol. 55, no. 1, pp. 913–951, 1986.
[20] M. Nishio, Y. Umezawa, J. Fantini, M. S. Weiss, and
[2] W. R. Bernhard, M. Vasak, and J. H. R. Kagi, “Cadmium
P. Chakrabarti, “CH-π hydrogen bonds in biological mac-
binding and metal cluster formation in metallothionein: a
romolecules,” Physical Chemistry Chemical Physics, vol. 16,
differential modification study,” Biochemistry, vol. 25, no. 8,
pp. 1975–1980, 1986. no. 25, pp. 12648–12683, 2014.
[3] R. A. Steele and S. J. Opella, “Structures of the reduced and [21] W. Maret and Y. Li, “Coordination dynamics of zinc in
mercury-bound forms of MerP, the periplasmic protein from proteins,” Chemical Reviews, vol. 109, no. 10, pp. 4682–4707,
the bacterial mercury detoxification system,” Biochemistry, 2009.
vol. 36, no. 23, pp. 6885–6895, 1997. [22] J. Merle, J. Mazlo, J. Watts, R. Moreno, and M. Ngu-
[4] P. Lian, H.-B. Guo, D. Riccardi et al., “X-ray structure of a Schwemlein, “Reaction mixture analysis by ESI-MS: mercu-
Hg2+ complex of mercuric reductase (MerA) and quantum ry(II) and dicysteinyl tripeptide complex formation,” Inter-
mechanical/molecular mechanical study of Hg2+ transfer national Journal of Mass Spectrometry, vol. 426, pp. 38–47,
between the C-terminal and buried catalytic site cysteine 2018.
pairs,” Biochemistry, vol. 53, no. 46, pp. 7211–7222, 2014. [23] M. Ngu-Schwemlein, J. Merle, W. Meeker, K. Risdon-
[5] F. Tatsuhiko, K. Masaharu, I. Ryuji, T. Kazutake, and A. Shin- Langdon, and T. Nixon, “Evaluating the involvement of
ichi, “Copper transport systems are involved in multidrug tryptophan on thiolated peptide-mercury(II) complexes:
resistance and drug transport,” Current Medicinal Chemistry, cation-pi interactions,” Inorganica Chimica Acta, vol. 506,
vol. 15, no. 30, pp. 3268–3278, 2008. Article ID 119552, 2020.
[6] F. Hussain and P. Wittung-Stafshede, “Impact of cofactor on [24] M. Ngu-Schwemlein, X. Lin, B. Rudd, and M. Bronson,
stability of bacterial (CopZ) and human (Atox1) copper “Synthesis and ESI mass spectrometric analysis of the asso-
chaperones,” Biochimica et Biophysica Acta (BBA)-Proteins ciation of mercury(II) with multi-cysteinyl peptides,” Journal
and Proteomics, vol. 1774, no. 10, pp. 1316–1322, 2007. of Inorganic Biochemistry, vol. 133, pp. 8–23, 2014.
[7] T. M. DeSilva, G. Veglia, F. Porcelli, A. M. Prantner, and [25] B. J. H. Kuipers and H. Gruppen, “Prediction of molar ex-
S. J. Opella, “Selectivity in heavy metal- binding to peptides tinction coefficients of proteins and peptides using UV ab-
and proteins,” Biopolymers, vol. 64, no. 4, pp. 189–197, 2002. sorption of the constituent amino acids at 214 nm to enable
[8] S. Pires, J. Habjanič, M. Sezer, C. M. Soares, L. Hemmingsen, quantitative reverse phase high-performance liquid chro-
and O. Iranzo, “Design of a peptidic turn with high affinity for matography−mass spectrometry analysis,” Journal of Agri-
HgII,” Inorganic Chemistry, vol. 51, no. 21, pp. 11339–11348, cultural and Food Chemistry, vol. 55, no. 14, pp. 5445–5451,
2012. 2007.
[9] A. S. Borovik, “Bioinspired hydrogen bond motifs in ligand [26] Schrödinger, Schrödinger Release 2018, MacroModel,
design: the role of noncovalent interactions in metal ion Schrödinger, LLC, New York, NY, USA, 2018.
mediated activation of dioxygen,” Accounts of Chemical Re- [27] D. Andrae, U. Huermann, M. Dolg, H. Stoll, and H. Preu,
search, vol. 38, no. 1, pp. 54–61, 2005. “Energy-adjustedab initio pseudopotentials for the second
[10] R. L. Shook and A. S. Borovik, “Role of the secondary co- and third row transition elements,” Theoretica Chimica Acta,
ordination sphere in metal-mediated dioxygen activation,” vol. 77, no. 2, pp. 123–141, 1990.
Inorganic Chemistry, vol. 49, no. 8, pp. 3646–3660, 2010. [28] H. Valdes, K. Pluháčková, M. Pitonák, J. Řezáč, and P. Hobza,
[11] S. A. Cook and A. S. Borovik, “Molecular designs for con- “Benchmark database on isolated small peptides containing
trolling the local environments around metal ions,” Accounts an aromatic side chain: comparison between wave function
of Chemical Research, vol. 48, no. 8, pp. 2407–2414, 2015. and density functional theory methods and empirical force
[12] G. D. Rose, L. M. Glerasch, and J. A. Smith, “Turns in peptides field,” Physical Chemistry Chemical Physics, vol. 10, no. 19,
and proteins,” in Advances in Protein Chemistry, pp. 2747–2757, 2008.
C. B. Anfinsen, J. T. Edsall, and F. M. Richards, Eds., vol. 37, [29] J. Watts, E. Howell, and J. K. Merle, “Theoretical studies of
pp. 1–109, Academic Press, Cambridge, MA, USA, 1985. complexes between Hg(II) ions and l-cysteinate amino acids,”
[13] A. S. Mahadevi and G. N. Sastry, “Cation−π interaction: its International Journal of Quantum Chemistry, vol. 114, no. 5,
role and relevance in chemistry, biology, and material sci- pp. 333–339, 2014.
ence,” Chemical Reviews, vol. 113, no. 3, pp. 2100–2138, 2013. [30] M. J. Frisch, G. W. Trucks, H. B. Schlegel et al., Gaussian 09,
[14] D. A. Dougherty, “Cation-pi interactions in chemistry and Revision A.1, Gaussian, Inc., Wallingford, CT, USA, 2009.
biology: a new view of benzene, Phe, Tyr, and Trp,” Science, [31] P. Rousselot-Pailley, O. Sénèque, C. Lebrun et al., “Model
vol. 271, no. 5246, pp. 163–168, 1996. peptides based on the binding loop of the copper metal-
[15] D. A. Dougherty, “The cation−π interaction,” Accounts of lochaperone Atx1: selectivity of the consensus sequence
Chemical Research, vol. 46, no. 4, pp. 885–893, 2013. MxCxxC for metal ions Hg(II), Cu(I), Cd(II), Pb(II), and12 Bioinorganic Chemistry and Applications
Zn(II),” Inorganic Chemistry, vol. 45, no. 14, pp. 5510–5520,
2006.
[32] A. Okada, T. Miura, and H. Takeuchi, “Protonation of his-
tidine and histidine−tryptophan interaction in the activation
of the M2 ion channel from influenza A virus,” Biochemistry,
vol. 40, no. 20, pp. 6053–6060, 2001.
[33] T. Kamiyama, T. Miura, and H. Takeuchi, “His-Trp cation-π
interaction and its structural role in an α-helical dimer of
HIV-1 Vpr protein,” Biophysical Chemistry, vol. 173-174,
pp. 8–14, 2013.
[34] L. Patiny and A. Borel, “ChemCalc: a building block for
tomorrow’s chemical infrastructure,” Journal of Chemical
Information and Modeling, vol. 53, no. 5, pp. 1223–1228, 2013.
[35] A. Perczel and M. Hollósi, “Turns,” in Circular Dichroism and
the Conformational Analysis of Biomolecules, G. D. Fasman,
Ed., Plenum, New York, NY, USA, pp. 285–380, 1996.
[36] H. Yorita, K. Otomo, H. Hiramatsu, A. Toyama, T. Miura, and
H. Takeuchi, “Evidence for the cation−π interaction between
Cu2+ and tryptophan,” Journal of the American Chemical
Society, vol. 130, no. 46, pp. 15266-15267, 2008.
[37] J. R. Lakowicz, “Protein fluorescence,” Principles of Fluorescence
Spectroscopy, pp. 529–575, Springer Science and Business Media,
LLC, New York, NY, USA, 3rd edition, 2006.
[38] J. C. Ma and D. A. Dougherty, “The cation−π interaction,”
Chemical Reviews, vol. 97, no. 5, pp. 1303–1324, 1997.
[39] L. J. Juszczak and A. S. Eisenberg, “The color of cation-π
interactions: subtleties of amine-tryptophan interaction en-
ergetics allow for radical-like visible absorbance and fluo-
rescence,” Journal of the American Chemical Society, vol. 139,
no. 24, pp. 8302–8311, 2017.
[40] E. A. Orabi and G. Lamoureux, “Cation−π interactions be-
tween quaternary ammonium ions and amino acid aromatic
groups in aqueous solution,” The Journal of Physical Chem-
istry B, vol. 122, no. 8, pp. 2251–2260, 2018.
[41] A. E. Reed, R. B. Weinstock, and F. Weinhold, “Natural
population analysis,” The Journal of Chemical Physics, vol. 83,
no. 2, pp. 735–746, 1985.
[42] J. R. Lakowicz, “Protein fluorescence,” Principles of Fluorescence
Spectroscopy, pp. 278–318, Springer Science and Business Media,
LLC, New York, NY, USA, 3rd edition, 2006.
[43] S. D. Zaric, D. M. Popovic, and E. W. Knapp, “Metal ligand
aromatic cation-pi interactions in metalloproteins: ligands
coordinated to metal interact with aromatic residues,”
Chemistry, vol. 6, no. 21, pp. 3935–3942, 2000.
[44] S. D. Zarić, “Metal ligand aromatic Cation−π interactions,”
European Journal of Inorganic Chemistry, vol. 2003, no. 12,
pp. 2197–2209, 2003.You can also read