Cyclone Fani: the tug-of-war between regional warming and anthropogenic aerosol effects - IOPscience
←
→
Page content transcription
If your browser does not render page correctly, please read the page content below
Environmental Research Letters

LETTER • OPEN ACCESS

Cyclone Fani: the tug-of-war between regional warming and
anthropogenic aerosol effects
To cite this article: Lin Zhao et al 2020 Environ. Res. Lett. 15 094020

View the article online for updates and enhancements.

                                This content was downloaded from IP address 46.4.80.155 on 03/11/2020 at 14:38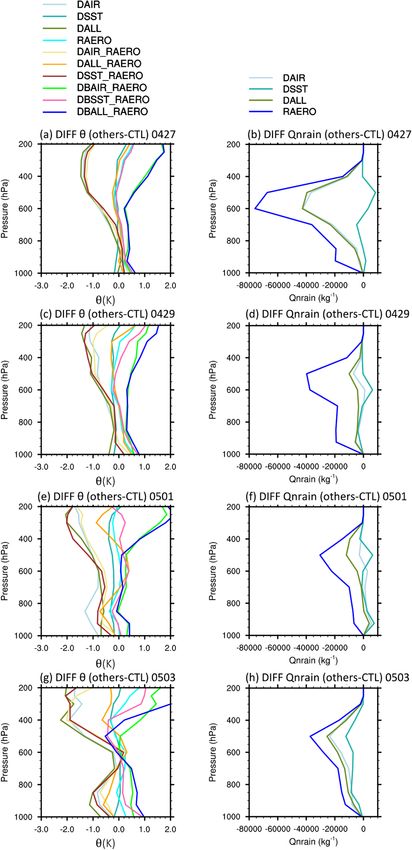
Environ. Res. Lett. 15 (2020) 094020 https://doi.org/10.1088/1748-9326/ab91e7
Environmental Research Letters
LETTER
Cyclone Fani: the tug-of-war between regional warming and
OPEN ACCESS
anthropogenic aerosol effects
RECEIVED
17 October 2019 Lin Zhao1,2, S-Y Simon Wang2, Emily Becker3, Jin-Ho Yoon4 and Avik Mukherjee2
REVISED 1
8 April 2020 Key Laboratory of Land Surface Process and Climate Change in Cold and Arid Regions, Northwest Institute of Eco-Environment and
Resources, Chines Academy of Sciences, Lanzhou, People’s Republic of China
ACCEPTED FOR PUBLICATION 2
11 May 2020
Department of Plants, Soils and Climate/Utah Climate Center, Utah State University, Logan, UT, United States of America
3
University of Miami Rosenstiel School of Marine and Atmospheric Science, Miami, FL, United States of America
PUBLISHED 4
School of Earth Sciences and Environmental Engineering, Gwangju Institute of Science and Technology, Gwangju, Republic of Korea
19 August 2020
E-mail: yjinho@gist.ac.kr
Original content from Keywords: cyclone Fani, WRF-Chem, anthropogenic aerosols, regional climate warming
this work may be used
under the terms of the Supplementary material for this article is available online
Creative Commons
Attribution 4.0 licence.
Any further distribution
of this work must
maintain attribution to
Abstract
the author(s) and the titleBefore Cyclone Amphan took place in 2020, Cyclone Fani (May 2019) is the strongest
of the work, journal
citation and DOI. pre-monsoon cyclone in the Bay of Bengal (BOB) since 1991, killing 90 people in eastern India and
Bangladesh while causing US$1.81 billion of damages. Fani developed during a period of high
concentration of anthropogenic aerosols in the BOB with abnormally high sea surface temperature
(SST), thereby presenting an opportunity to understand the compound effects of atmospheric
aerosols and regional climate warming on a tropical cyclone. A quantitative attribution analysis
was conducted using the Weather Research and Forecasting model with chemistry (WRF-Chem)
run at the convection-permitting (4 km) grid spacing, accompanied by an ensemble of
coarser-resolution simulations to quantify the uncertainty. The removal of post-1990 trends in the
tropospheric variables and SST from WRF-Chem’s initial conditions (IC) and boundary
conditions (BC, including the lateral and lower boundary conditions) resulted in a reduction of
cyclone precipitation by about 51% during the 5 d of April 28-May 2. The removal of tropospheric
warming shows approximately twice as strong an effect on Fani (39% reduction in precipitation) as
that of SST warming (22% reduction). When aerosol’s direct and indirect effects were removed
from the simulations, i.e., no aerosol influence on radiation and cloud microphysics, Fani initially
strengthened but later weakened, as measured by geopotential height and precipitation amounts.
These results suggest that aerosol and its interaction with the atmosphere acted to mitigate the
strengthening effect of anthropogenic warming on Fani, but was not strong enough to entirely
counteract it. Although the ensemble of coarser simulations appears to overestimate Cyclone Fani
in terms of precipitation, the direction of the effects is in agreement with that obtained from the
4 km simulations. Given the increasing anthropogenic aerosols in the BOB, future attribution
studies using more sophisticated dynamical aerosol models on BOB tropical cyclones are urged.
1. Introduction approximated to 8.1 billion US dollars in Bangladesh
and India (www.aon.com). Exposed to a high con-
Originated from a tropical depression that formed centration of anthropogenic aerosols during the
west of Sumatra in the Indian Ocean on 26 April 2019, pre-monsoon season (Wang et al 2013), BOB trop-
cyclone Fani eventually developed to the strongest ical cyclones are facing a double-punch effect from
pre-monsoon cyclone (A Category 4-equivalent cyc- anthropogenic climate change: persistent warming
lone in figure 1(a)) in the Bay of Bengal (BOB) since in the ocean surface and the air, accompanied by
1991. According to Aon’s Weather, Climate & Cata- a detectable increase in aerosol loading (Bhat et al
strophe Insight: 2019 Annual Report, Cyclone Fani 2001). Literature shows that local climate warming
made landfall in the Indian state of Odisha on 3 has increased the intensity of BOB cyclones (Yu and
May 2019, killing 81 people while causing damages Wang 2009, Hoarau et al 2012) while a modeling
© 2020 The Author(s). Published by IOP Publishing LtdEnviron. Res. Lett. 15 (2020) 094020 L Zhao et al
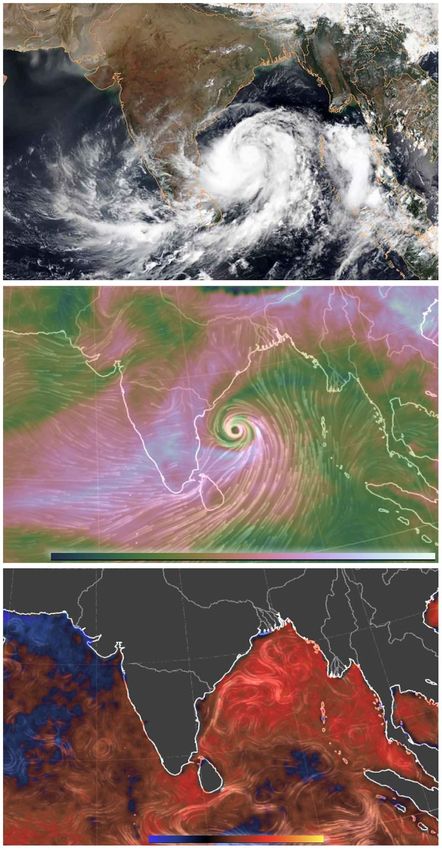
(a) Fani on May 1, 2019
(b) Surface wind & AOT 5/1/2019
sulfate extinction
0.01 0.02 0.05 0.1 0.2 0.4 0.8
(c) SST anomaly & current 5/1/2019
-1.5 0 1.5 3.0 °C
Figure 1. (a) Visible/true-color image of cyclone Fani on 00Z 1 may 2019 depicted by Terra—MODIS (source: NOAA), (b)
nullschool generated streamlines of surface wind and the aerosol optical thickness (AOT; shading) by sulfate extinction and (c)
SST anomaly overlaid with surface currents (white streamlines) at the same time (source: https://earth.nullschool.net with
permission).
analysis found that increased aerosols can deepen quick intensification of Fani presents an interesting
the short-wave trough that develops in May, sub- case in understanding the compound effects of atmo-
sequently intensifying tropical cyclones during the spheric aerosols and climate warming in the BOB on
pre-monsoon season (Wang et al 2013). Cyclone a pre-monsoon tropical cyclone.
Fani developed around the equator as depression High values of aerosol optical thickness (AOT)1
and slowly move upward, then it has a quick intens- due to sulfate extinction were present in the BOB
ification as an extremely severe cyclonic storm dur- around Cyclone Fani (figure 1(b)), concurrent with
ing the 24 h from 0530Z 30th April to 0530Z May
1st, the maximum sustained surface wind speed 1AOT is derived from the GEOS-5 data provided by the Global
increased from 120–130 km h−1 to 180–190 km h−1 Modeling and Assimilation Office (GMAO) at NASA Goddard
(http://www.rsmcnewdelhi.imd.gov.in). Thus, the Space Flight Center, displayed by https://earth.nullschool.net.
2Environ. Res. Lett. 15 (2020) 094020 L Zhao et al
intense warm sea surface temperature (SST) 2 anom- Super Typhoon Haiyan by about 20% (Takayabu
alies in the northern BOB, with regions of the ocean et al 2015), and strengthens rainfall for Hurricane
reaching 32 ◦ C prior to Fani’s landfall (figure 1(c)). Florence by 2%–9% (Reed et al 2020). In general,
In the weather timescale, aerosols present both a neg- the Clausius–Clapeyron (CC) relation that increases
ative and positive impact on the microphysical and moisture holding capacity under climate warming
dynamical properties of clouds: a negative impact is plays a key role in the overall increase of precipita-
caused by processes that reduce precipitation effi- tion. However, most previous studies found that the
ciency (Tao et al 2012, Hazra et al 2013) and weaken response of tropical cyclone (TC) rainfall to climate
the cyclone winds (Rosenfield et al 2012 ), while a warming exceeds the CC relation. (Lenderink et al
positive impact is associated with the ‘cloud invigora- 2017) suggested that both higher moisture content
tion effect’ linking an increase in aerosol loading with and higher vertical velocities contribute to the TC pre-
deepening of convective clouds. The debate about cipitation process. Adding to the challenges in attrib-
the invigoration effect and possible cloud responses uting climate change on individual storms, global
remains fierce, however, as conclusions vary region- climate models have a common difficulty in dir-
ally, and depend on aerosol types (Altaratz et al 2014, ectly representing tropical cyclones. Therefore, recent
Varble 2018, Jiang et al 2018, Fan et al 2018). As repor- studies such as Wehner et al (2017), Patricola and
ted by Evan et al (2011), anthropogenic black carbon Wehner (2018), and (Wang et al 2018) urged the need
and sulfate aerosols would reduce the vertical wind for applying convection-permitting regional simula-
shear to create an environment more favorable for tions for the attribution analysis of hurricanes.
tropical cyclone intensification, while Lau and Kim The impact of aerosol on tropical cyclones has
(2007) found that the loading of dust aerosol in the mostly been investigated independent of the stud-
atmosphere might cool SST to suppress the develop- ies on regional climate warming effects. Using the
ment of cyclone. assimilation of aerosol optical depth, the effects of
During the pre-monsoon season in the BOB, dust on increasing static stability produce a less favor-
the observed increases in anthropogenic aerosols and able environment to tropical cyclogenesis (Reale et
ocean heat content may have complex effects on Fani, al 2014). By comparing the effects of aerosol radi-
and understanding these effects requires a novel event ative forcing and greenhouse gas on the TC poten-
attribution analysis. This study does not focus on tial intensity, aerosol cooling seems to reduce TC
detailing the aerosol effects on cloud microphysics intensity more strongly than greenhouse gas warming
and convective processes, as that itself is an active increases it (Sobel et al 2019). Given the high concen-
research topic (see a review by Fan et al 2016). Rather, tration of anthropogenic aerosols in the BOB, what
we seek to provide an attribution analysis that assesses would these effects be on Fani?
the compound effects of highly concentrated aero-
sols and persistent SST warming, both of which are 3. Model experiments and data sources
present in the BOB during Cyclone Fani.
Following the emerging ‘storyline approach’ of attri-
2. Background of attribution on bution analysis (e.g. Zappa and Shepherd 2017,
individual cyclones Wang et al 2018), we adopted a quantitative attri-
bution approach that constrains the boundary and
Few studies have discussed the effect of climate initial conditions of a regional atmospheric model
change on individual tropical cyclones. Due to the used to simulate this synoptic event. Using the
large natural variability and the limited period of con- Weather Research and Forecasting model with chem-
sistent observations, there is no consensus on how cli- istry (WRF-Chem), we can generate the closest pos-
mate change affects the intensity and track of indi- sible influences of the environmental conditions at
vidual tropical cyclones (Landsea et al 2006, Patricola the time of Cyclone Fani (via initial and boundary
and Wehner 2018). The few diagnostic and modeling conditions) and simulate the same event by assum-
studies that attributed the effect of climate change on ing the absence of long-term (warming) trends in
individual tropical cyclones in the recent years point those conditions and of the aerosol effects, in order
to a general intensification effect on tropical cyclones to examine their combined effects on a TC. We
but with various degrees of rainfall or wind speed used the WRF-Chem version 3.9.1 that includes aer-
change. For example, statistical analysis and mod- osol interactions with the atmosphere (Grell et al
eling experiments have indicated that the warming 2005, Skamarock et al 2008, Powers et al 2017).
trend likely intensifies Hurricane Harvey’s precipit- WRF-Chem utilizes the Modal Aerosol Dynamics for
ation by 15%–20% (Risser and Wehner 2017, Van Europe (MADE) aerosol module and Carbon-Bond
Oldenborgh et al 2017, Wang et al 2018), enhances Mechanism version Z (CBM-Z) to parameterize aer-
osol transport and deposition and represent the gas-
2 SST is derived from the NOAA Real-time, global, sea phase chemistry (Ackermann et al 1998, Zaveri and
surface temperature (RTG_SST_HR) analysis, displayed by Peters 1999). The domain of simulations is com-
https://earth.nullschool.net. posed of 623 × 539 grid points (outlined in figure
3Environ. Res. Lett. 15 (2020) 094020 L Zhao et al
(a) OBS 0428 (b) CTL 0428 (c)RAERO 0428
(d) OBS 0429 (e) CTL 0429 (f) RAERO 0429
(g) OBS 0430 (h) CTL 0430 (i) RAERO 0430
(j) OBS 0501 (k) CTL 0501 (l) RAERO 0501
(m) OBS
(j)OBS 0502
0501 (n) CTL 0502 (o) RAERO 0502
Figure 2. The observed and simulated 850 hPa streamfunction (m2 s−1 , contours at intervals of 107 m2 s−1 ) at 00UTC overlaid
with daily averaged precipitation (mm d−1 , shading) within the simulation domain from 28 april to 2 may: (a), (d), (g), (j) and
(m) are observation; (b), (e), (h), (h) and (n) are control simulations (CTL); (c), (f), (i), (l) and (o) are simulations without
anthropogenic aerosol effects (RAERO).
4Environ. Res. Lett. 15 (2020) 094020 L Zhao et al
2) with a horizontal grid spacing of 4 km, a resolu- variables may not be linearly correlated but the non-
tion that starts to resolve convective precipitation (i.e. linear effect among these different trends is negligible
convection-permitting) while convective parameter- (not shown). More details about the detrend pro-
ization is turned off. The model was forced by ini- cesses can be referred to Cho et al (2016) and Wang
tial conditions (IC) and boundary conditions (BC, et al (2016), (2018).
including the lateral and lower boundary conditions) Here, the anthropogenic emission was based
using the 0.5◦ × 0.5◦ resolution Global Forecast Sys- on the Emissions Database for Global Atmospheric
tem (GFS) initial analysis with nesting. Here, SST is Research (EDGAR) HTAP V2 inventory (Janssens-
derived from GFS rather than other observed data. Maenhout et al 2015). The EDGAR HTAP emission
As reported by Fu and Wang (2018), SST from GFS is inventory provides total emissions, as well as sector-
a best lower boundary condition for WRF to repres- by-sector estimates for air, energy, industry, resid-
ent the intensity of typhoon Nangka compared with ential, shipping, and transportation sectors. To com-
the NOAA optimum interpolation SST (OISST), and pare the non-anthropogenic aerosol effect on meteor-
ECMWF Interim reanalysis (ERA- Interim). We con- ological variables, four additional experiments with
ducted four sets of 4 km simulation based on the non-anthropogenic aerosol effects were designed:
combination of Lin (Lin et al 1983)/Morrison (Mor- (5) a control aerosol simulation forced by the ori-
rison et al 2009) microphysics schemes with Mellor– ginal GFS analysis as IC and BC without aerosols
Yamada–Nakanishi–Niino (MYNN) (Nakanishi and (RAERO; with the chemistry module turned off)
Niino 2006)/the Yonsei University (YSU) planetary and within this setup, a ‘detrend’ experiment of
boundary layer (PBL) schemes (Hong et al 2006), (6) SST (DSST_RAERO), (7) tropospheric variables
and subsequently produced the control simulation (DAIR_RAERO), and (8) both SST and tropospheric
(CTL, table 1) from their ensemble mean. To quantify variables as above (DALL_RAERO), all of which
model uncertainty, we also conducted multiple simu- without simulating the interaction between anthro-
lations with coarser resolution settings to increase the pogenic aerosol and the atmospheric variables. How-
ensemble size. The ensemble spread and members are ever, due to the absence of aerosols, the direct and
discussed in section 4. indirect effects like aerosol-radiation and aerosol-
Based upon Cho et al (2016) and Wang et microphysics interaction are not present in these (5)-
al (2016), the regional model experiments were (8) simulations. To evaluate the sensitivity of the cli-
designed under the assumption that any post- mate trend effect, we also included another three
1990 trend manifest in the tropospheric and ‘double-trend’ simulations forced by the original IC
ocean temperatures contains signals that are and BC added with the post-1990 monthly trends
traceable to the anthropogenic global warm- (thus doubling the warming effect, i.e. DB run):
ing. Since GFS data only started in 2004 (9) the atmospheric variables (DBAIR_RAERO), (10)
(https://www.ncdc.noaa.gov/data-access/model-da SST (DBSST_RAERO), and (11) both the atmo-
ta/model-datasets/global-forcastsystem-gfs), which sphere and SST (DBALL_RAERO). We have tested
is not adequate for computing the post-1990 trends, certain runs (RAERO) using both a single domain
we used the NCEP Reanalysis 2 trend given that NCEP and a nesting domain with the chemistry com-
GFS also contributes to the NCEP reanalysis (Cam- ponent turned off. The results show that both
pana et al 2019). We first conducted four experiments runs can capture the main pattern of the observed
of anthropogenic global warming effects with the precipitation (figures S2 and S3 (available online
chemistry component engaged (see table 2): a con- at stacks.iop.org/ERL/15/094020/mmedia)), which is
trol simulation (1) forced by the original GFS analysis indicated by the pattern correlation of precipita-
as IC and BC (CTL, as a 4-member ensemble), and tion between simulations and observation. It is argu-
‘detrended’ simulations in which we removed the able that the lateral boundary interpolated from
linear monthly trends from the IC and BC for (2) 50 km to 4 km is not problematic for this simulation
SST (denoted as DSST), (3) all tropospheric vari- domain.
ables, such as temperature, geopotential height, rel- Table 2 provides a summary of these experiments,
ative humidity, U wind and V wind (DAIR), and (4) while the detailed model setup is described in (Wang
both SST and tropospheric variables (DALL). The et al 2016). Other physics schemes were configured
trends were first computed from the NCEP-DOE identically in all simulations, with the following com-
Reanalysis 2 monthly data for each variable (Kanam- mon options: YSU PBL scheme, the NOAH land-
itsu et al 2002) and then linearly interpolated onto surface model (Chen and Dudhia 2001), and the
GFS’s horizontal and vertical grids. We then sub- Morrison microphysics scheme. The Fu-Liou-Gu (Fu
tracted these trends from the GFS’s initial analysis and Liou 1992, Gu et al 2011) radiation scheme,
(including geopotential height, horizontal winds, air which allows for aerosols in long-wave and short-
temperature, etc to be consistent), before using it as wave radiation, was applied for the simulations. The
IC and BC to drive the WRF-Chem. We note that the additional coarser-resolution simulations (to create a
individual trends revealed in the different IC and BC large ensemble) used a combination of other physics
5Environ. Res. Lett. 15 (2020) 094020 L Zhao et al
schemes not listed above. All simulations cover the temperature’s warming trend accounting for approx-
period from 0000 UTC 26 April to 0000 UTC 04 May imately two-thirds of the cyclone reduction (DAIR)
2019. and the SST trend accounting for one-third (DSST).
The observed gridded 12 h and daily mean pre- The removal of aerosol (cyan line; RAERO) intensi-
cipitation, derived from Level-3 half-hourly Integ- fied the tropical cyclone initially, but then weakened
rated Multi-satellite Retrievals of Global Precip- it near landfall (May 1).
itation Measurement (IMERG) final product at This result suggests that the effect of the BOB
the 0.1◦ × 0.1◦ resolution, was obtained from aerosols on Fani is relatively weak compared to that
NASA Global Precipitation Measurement (GPM) of the air temperature and SST trends, which could
data products (https://pmm.nasa.gov/). For observed be attributed to greenhouse gases induced warming
SST, we use the Reynolds SST Analysis (Reynolds (Wang et al 2013). In terms of precipitation (fig-
et al 2007). ure 3(d); averaged within the 12◦ lat. × 12◦ long.
box following Fani), the outcome of the simula-
4. Results tions agrees with that of the 850 hPa HGT. The
removal of both the air temperature and SST trends
The observed evolution of Fani from 28 April 2019 to (DALL) resulted in a reduction of cyclone precipit-
2 May is displayed in figure 2 (left column) in terms of ation by about 51% during 4/28-5/2, in which the
850 hPa streamfunction at 00 UTC, overlaid with the tropospheric warming shows almost twice as strong
daily mean precipitation. Pre-monsoon tropical cyc- an effect on Fani (39% reduction) as that of SST
lones in the BOB tend to develop from low-pressure warming (22% reduction). These results are consist-
systems in the equatorial Indian Ocean and migrate ent with Trenberth et al (2018) in that the increased
northward (Krishna 2009, Ng and Chan 2012) and SST not only enhances fuel available to sustain and
this was also the case with Fani. After its genesis, Fani intensify a hurricane but also increases its rains upon
tracked northward into the high-aerosol area and its landfall. As shown in figures 3(d) and (e), DSST
interaction with the aerosols is visible in the swirling and DBSST_RAERO (detrend SST and double trend
patterns of AOT of sulfate (figure 1(b)). Meanwhile, SST) generally decreased and increased precipitation,
the local SST anomaly at Fani’s position reached as respectively. Note that the precipitation response to
high as 2.5 ◦ C (figure 1(c)), which is in line with the detrended IC and BC is much quicker than the
projections from the post-1980 warming trend of the pressure field, showing differences at the first fore-
BOB SST during May (Wang et al 2013). cast hour of the simulations. The removal of aerosols
The control simulation of Fani (CTL) in terms of (RAERO), on the other hand, does not show a robust
daily precipitation and the 850hPa streamfunction at net effect from 4/27-5/3.
00 UTC is plotted in figure 2 (middle column), along- Without aerosol and its direct and indirect
side the aerosol removal simulation (RAERO, figure 2 effect with radiation and microphysics, the simula-
right column). The WRF-Chem simulation captures tions with removed climate trends show a consist-
the size and intensity of Fani in general, albeit overes- ent tendency of a weakened Fani, with increased
timating the cyclone winds starting on April 29. The geopotential height and decreased precipitation of
position of cyclone rainbands is slightly offset day- smaller amplitude. Comparison between DALL and
by-day, while the accumulated precipitation amounts DALL_RAERO suggests that aerosol interactions with
within 12◦ lat. × 12◦ long. around the cyclone cen- the atmosphere act to mitigate the warming effect on
ter averaged to an underestimation of ~15% during Fani by reducing the 155 m increase in 850 hPa geo-
the 5 d, based on CTL (figure 3(d)). A comparison potential height to a smaller level of 138 m, and the
of Fani’s observed and modeled trajectories is plot- 51% decrease in precipitation to 39% from the five-
ted in figure 3(a) for CTL and in figure 3(b) with day average. In other words, Fani might have grown
other experiments, following the 850 hPa vorticity noticeably stronger if the BOB aerosols were not
center. Despite the sub-daily variation in the traject- present. Likewise, by doubling the warming trends
ory, the simulated cyclone track is generally in good in the air and SST with the absence of aerosols
agreement with the observed one, until 12Z April (DBALL_RAERO), Fani would intensify with a drop
30 when the CTL track persistently deviated east by of height by 11 m accompanied by a precipitation
about 90 km. increase of 15% during 4/28-5/2; this sensitivity test
Acknowledging this track bias, we next examined shows the effect of amplified warming and lends sup-
the differences in the 850 hPa geopotential height port to the detrend simulations.
(HGT) between the control simulation and the other Any change in the cyclone intensity can affect
experiments to represent Fani’s intensity (figure 3(c)), its trajectory. As shown in figure 3(b), Fani would
averaged within 12◦ lat. × 12◦ long. around the drift westward without the influence of post-1990 cli-
cyclone center. Not surprisingly, the removal of the mate trends and the presence of aerosols. Likewise,
trends in the air and SST (DALL; olivedrab line) res- with further (doubled) warming in the atmosphere,
ults in the strongest increase in cyclone pressure, sig- the cyclone would drift eastward. The uncertainty
nifying a reduction in Fani’s strength, with the air of aerosol effect in the ensemble CTL with respect
6Environ. Res. Lett. 15 (2020) 094020 L Zhao et al
(a) Track (b) Track
(c) Geopotential height difference (d) Precipitation Ratio
(e) SST difference
double trend SST(DBSST_RAERO-CTL)
normal SST(CTL-CTL)
detrend SST(DSST-CTL)
Figure 3. (a) The trajectories of the observed and control simulation (CTL); (b) the trajectories of all simulated trajectories; (c)
domain averaged (12◦ lat. × 12◦ long. around the CTL cyclone center) 850 hPa geopotential height (HGT, m) difference (other
experiments minus CTL, instantaneous value at each 12 h), noted that red CTL line means CTL minus observation; (d) domain
averaged simulated precipitation ratio (other experiments divided by CTL, accumulation within the past 12 h), noted that red
CTL line means CTL divided by observation; (e) domain averaged SST difference (K) compared to CTL (others minus CTL),
noted that experiments were generally three categories in terms of SST: normal SST such as CTL, detrend SST such as DSST,
double trend SST such as DBSST_RAERO.
Table 1. CTL experiments of WRF-Chem at 4 km grid spacing.
Experiments PBL schemes Microphysics schemes
CTL YSU_MOR YSU Morrison
YSU_LIN YSU Lin
MYNN_MOR MYNN Lin
MYNN_LIN MYNN Morrison
7Environ. Res. Lett. 15 (2020) 094020 L Zhao et al
Table 2. Description of all the WRF-Chem experiments.
Experiments Descriptions
Control experiment CTL simulation with original IC and BC for all tropospheric vari-
ables from GFS data; consideration of the inclusion of the
anthropogenic aerosol effects, including aerosol and its
direct and indirect effect with atmospheric radiation and
microphysics
DAIR same as CTL but remove the linear monthly trends of post-
1990 from NCEP R2 for the IC and BC for all tropospheric
variables
Detrend experiments DSST simulation as CTL but remove the linear monthly trends
from the IC and BC for SST
DALL same as CTL but remove the linear monthly trends of post-
1990 from NCEP R2 for the IC and BC for both SST and
tropospheric variables
No aerosol experiment RAERO simulation with original IC and BC for all tropospheric vari-
ables from GFS data; without aerosol forcing and turn off
aerosol direct and indirect effect, basically it is WRF model.
DAIR_ RAERO same as RAERO, simulation removed the linear monthly
trends of post-1990 from NCEP R2 for the IC and BC for all
tropospheric variables; without aerosol forcing and turn off
aerosol direct and indirect effect
DSST_RAERO same as RAERO, simulation removed the linear monthly
trends of post-1990 from NCEP R2 for the IC and BC for
Detrend experiments SST; without aerosol forcing and turn off aerosol direct and
and without aerosol indirect effect
DALL_RAERO same as RAERO, simulation removed the linear trends
from the IC and BC for both SST and tropospheric vari-
ables; without aerosol forcing and turn off aerosol direct and
indirect effect
DBAIR_RAERO same as RAERO, simulation removed the linear monthly
trends of post-1990 from NCEP R2 for the IC and BC for all
tropospheric variables instead of removed; without aerosol
forcing and turn off aerosol direct and indirect effect
DBSST_RAERO same as RAERO, simulation removed he linear monthly
trends of post-1990 from NCEP R2 for the IC and BC for
Double trend SST instead of removed; without aerosol forcing and turn off
experiments and aerosol direct and indirect effect
without aerosol DBALL_RAERO same as RAERO, simulation removed the linear monthly
trends of post-1990 from NCEP R2 for the IC and BC for
both SST and tropospheric variables instead of removed;
without aerosol forcing and turn off aerosol direct and
indirect effect
to different parameterization schemes (table 1) was schemes and two different PBL schemes, which are
assessed using the 4 km simulations, as shown in fig- described in table 3 and named with 24 km (fig-
ures 4(a) and (b). By changing the PBL schemes to ure 4). Together with the 4 km cloud-resolving sim-
MYNN and the microphysics schemes to LIN, the dif- ulations, we produced an ensemble size of 13 for
ferent members produce a difference in the 850 hPa each experiment. Based on the median of 850 hPa
geopotential height that is more noticeable in the later geopotential height difference in CTL_24 km rel-
period (after 4/30) than before, up to 100 m. The pre- ative to CTL (figure 4(c)), the ensemble of sim-
cipitation fluctuation is also more pronounced after ulations appears to overestimate Fani by about
4/30 with a difference up to 5 mm 12 h−1 . 58 m in terms of the 850 hPa HGT. Meanwhile,
The ensemble size of TC simulations is import- other 24 km simulations uniformly experienced an
ant. Reed et al (2020) and Patricola and Wehner intensification of Fani’s geopotential height within
(2018) argued that an ensemble size of at least the range from −11 m (DSST_RAERO_24 km) to
10 is necessary for TC attribution experiments. −45 m (DBALL_RAERO_24 km). In other words, the
Here, we conducted twelve more simulations using coarser-resolution simulations are in general agree-
a 24 km grid spacing by following the experi- ment with the convection-permitting ones, suggest-
ments in table 2 through the combination of three ing aerosol invigoration achieved by the two-way
cumulus schemes and two different microphysics interaction between convection and microphysics
8Environ. Res. Lett. 15 (2020) 094020 L Zhao et al
(a) Geopotential height (m) (b) Precipitation
(c) Geopotential height difference (m) (d) Precipitation ratio
Figure 4. (a) domain averaged (12◦ lat. × 12◦ long. around the CTL cyclone center) 850 hPa geopotential height (HGT, m)
(instantaneous value at each 12 h) at 4 km grid spacing; (b) domain averaged simulated precipitation at 4 km grid spacing
(mm/12 h, accumulation within the past 12 h; box and whisker plots of (c) the ratio of domain averaged simulated 850 hPa
geopotential height and (d) domain averaged simulated precipitation relative to CTL with ensemble members from april 28 to
may 2; noted that ensemble size of 13 contains twelve simulations with 24 km grid spacing and 4 km cloud-resolving simulations.
Table 3. Twelve combination of paramutation schemes of WRF-Chem at 24 km grid spacing for all runs in table 2.
Combinations Cumulus schemes PBL schemes Microphysics schemes
1 Kain-Fritsch (Kain 2004) YSU Morrison
2 Kain-Fritsch YSU Lin
3 Kain-Fritsch MYNN Morrison
4 Kain-Fritsch MYNN LIn
5 Betts-Miller-Janjic (Janjic 1994) YSU Morrison
6 Betts-Miller-Janjic YSU Lin
7 Betts-Miller-Janjic MYNN Morrison
8 Betts-Miller-Janjic MYNN LIn
9 Grell-3 (Grell and Dévényi 2002) YSU Morrison
10 Grell-3 YSU Lin
11 Grell-3 MYNN Morrison
12 Grell-3 MYNN LIn
interaction might be weaker in the case of Fani. It is increased precipitation by 22%. By comparing the
likely due to the highly saturated aerosol in the BOB detrend + aerosol experiments (DAIR_24 km,
compared to other regions. DSST_24 km, and DALL_24 km) with the aero-
In terms of the accumulated precipitation, figure sol removal simulations (DAIR_RAERO_24 km,
4(d) shows the precipitation ratio compared to CTL DSST_RAERO_24 km, and DALL_RAERO_24 km),
during the 5 d. According to the median, CTL_24 km the accumulated precipitation was increased up to
9Environ. Res. Lett. 15 (2020) 094020 L Zhao et al
Figure 5. The vertical profile of the domain averaged (12◦ lat. × 12◦ long. around the CTL cyclone center) potential temperature
(θ, K) and raindrops number concentration (Qnrain, kg−1 ) difference (other experiments minus CTL): (a), (c), (e) and (g) are
potential temperature difference; (b), (d), (f) and (h) are rain number concentration difference.
6%. These ensemble results suggest that aerosol plays accompanied by a weakening effect from anthropo-
a negative effect on cyclone Fani by weakening its genic aerosols (but less pronounced than warming).
strength and precipitation. The double trend exper- These results echo the finding of (Sobel et al 2019)
iments profoundly increased the accumulated pre- regarding TC potential intensity but differ in that
cipitation at a range of 18%–23%. Therefore, des- climate warming intensifies a TC more so than aer-
pite the uncertainty introduced by different model osols reduce it, at least in the BOB. Reasons of the
settings, Fani underwent an intensification effect apparent discrepancy with those of (Sobel et al 2019)
from warming trend (which is mostly warming) are manifold. In the regional model (WRF-Chem),
10Environ. Res. Lett. 15 (2020) 094020 L Zhao et al
SST is ingested from the GFS forcing data and there- effect, hence delineating a ‘tug of war’ in their respect-
fore does not undergo the atmosphere feedback ive effects on Fani.
as in the fully coupled global model. The physic We should note that the selected domain size for
schemes, gaseous chemistry and aerosol mechan- evaluation may influence the intensity of precipita-
ism all differ between the global and regional models. tion since more intense rainfall occurs closer to Fani’s
Moreover, the different resolutions and aerosol com- center. By checking the vertical profile of ‘qnrain’
ponents can lead to somewhat different simulation within 6◦ domain centered on Fani (not shown), des-
results. pite more intense rainfall as expected, the variance of
‘qnrain’ profile is consistent with 12◦ x 12◦ domain
box centered on Fani. These analyses suggest that
anthropogenic aerosols affected Cyclone Fani primar-
5. In-cyclone mechanisms ily by modulating the raindrop concentration, while
climate trends modulated Fani mainly through chan-
The processes by which the different experiments
ging the atmospheric instability.
produced different amounts of precipitation from
Fani are discussed as follows. The removal of aer-
osol interactions did not produce as much of a 6. Concluding remarks
change in the potential temperature as the other
detrend simulations did (figure 5 left column). Most Through the present WRF-Chem simulations, the
of the detrend simulations produced two stabiliza- removal of warming trends from the troposphere and
tion zones, one in the lower troposphere since most SST appears to reduce Fani’s intensity and decrease
of the atmospheric warming took place in the lower the cyclone precipitation, while the removal of aerosol
levels (not shown), and the other in the upper tropo- interactions in the simulation initially strengthened
sphere, corresponding to the reduced convective pre- the tropical cyclone, but later weakened it. How-
cipitation (cf figure 3(d)) and an associated reduc- ever, when aerosols and climate trends were both
tion in latent heat release (not shown). Likewise, the removed from the simulations, the intensification
double-warming runs without aerosol interactions effect of regional/BOB aerosols and climate warm-
destabilize the lower troposphere while warming the ing on Fani (DALL_RAERO) was ‘mitigated’ by over
upper troposphere through enhanced deep convec- 49% during April 28-May 2, suggesting certain non-
tion. Meanwhile, the effect of anthropogenic aerosols linear dynamics involved in the aerosol interactions
is not consistent, at least between April 27 and May 1; with the increased heat in the air and ocean. An assess-
this echoes the fluctuated precipitation difference in ment could be made, based on the cyclone precipit-
figure 3(d). ation ratio averaged from April 28 to May 2 (figure
By plotting the vertical profile of the concentra- 3(d)), that the removal of post-1990 regional climate
tion of raindrops (‘qnrain’ in WRF-Chem) within warming alone (while keeping the aerosol effects;
the 12◦ domain centered on Fani, the simulations DALL) could have increased Fani’s precipitation by
without engaging the aerosol and its direct and indir- 51%, from which aerosols would deduct up to 13%.
ect effect (experiments named with RAERO) pro- This leaves the net intensification of Fani due to the
duced a consistent reduction in the concentration BOB climate warming and aerosol combined effects
of raindrops, particularly in the middle troposphere to be about 38%. This result provides a rudiment-
(figure 5 right column). This reduction in ‘qnrain’ ary, yet quantitative estimate for what a premonsoon
echoes the previous simulations of (May et al 2011) TC like Fani might have been like had it developed in
and (Hassim et al 2016), who found decreased num- the pre-1990 atmospheric and oceanic conditions and
ber concentrations of smaller rain droplets in the without the presence of anthropogenic aerosols.
core of convective storms during high aerosol con- Caution should be exercised when interpreting
ditions and the resultant decline in the deposition these statements since the simulations presented here
growth of cloud ice crystals. Such an effect of anthro- did have drawbacks. First, the cloud resolving (4 km)
pogenic aerosols is different from that of sea-salt simulations were not done in a large-ensemble fash-
aerosols, which can strengthen a tropical cyclone ion. The challenge lies in that setting up the interact-
through enhancing the condensation process (Jiang ive aerosol module of high-resolution WRF-Chem for
et al 2019). (Note that all the detrend simulations large ensembles that involve engaging various phys-
with the aerosol module turned off produced the ics schemes and different resolutions in the detrend
same result in ‘qnrain’, hence the single profile of experiments is extremely difficult, for the model
RAERO.) The detrend experiments with an active aer- would become unstable. As a result, model sensit-
osol interaction suggest that the atmospheric warm- ivity and uncertainty have not been fully evaluated
ing trend mitigates the weakening effect of anthropo- (such as the effect of the ensemble choices on Fani
genic aerosols on the concentration of raindrops by tracks). Second, the regional climate warming effect
~50%, while the SST trend (or the combination of was estimated in terms of the ‘change’ in the air
air and SST trends) completely offset that weakening and SST, while the aerosols effect was examined in
11Environ. Res. Lett. 15 (2020) 094020 L Zhao et al
a ‘with or without’ manner, so the two effects were Altaratz O, Koren I, Remer L and Hirsch E 2014 Cloud
not analyzed symmetrically. Third, one should expect invigoration by aerosols—coupling between microphysics
and dynamics Atmos. Res. 140 38–60
that the simulation results may fluctuate by chan-
Bhat G, Gadgil S, Hareesh Kumar P, Kalsi S, Madhusoodanan P,
ging the period of climate trends and/or using a dif- Murty V, Prasada Rao C, Babu V R, Rao L and Rao R 2001
ferent model. Finally, one should consider the long- BOBMEX: the Bay of Bengal monsoon experiment Bull. Am.
term effect of the persistent increase in anthropogenic Meteorol. Soc. 82 2217–44
Campana K et al 2019 The development and success of NCEP’s
aerosols on the intensification of the pre-monsoon
global forecast system 99th American Meteorological Society
trough of the BOB, a trend that has modified the Annual Meeting (AMS) (January)
pre-monsoon tropical cyclone activity including fre- Chen F and Dudhia J 2001 Coupling an advanced land
quency and intensity (Wang et al 2013). surface–hydrology model with the Penn state–NCAR MM5
modeling system. Part I: Model implementation and
Amid the model uncertainty, the simulations con-
sensitivity Mon. Weather Rev. 129 569–85
ducted and presented here call for future efforts with Cho C, Li R, Wang S-Y, Yoon J-H and Gillies R R 2016
more sophisticated models in understanding how the Anthropogenic footprint of climate change in the june 2013
rapidly increasing anthropogenic aerosols in the BOB northern India flood Clim. Dyn. 46 797–805
Evan A T, Kossin J P and Ramanathan V 2011 Arabian Sea tropical
interact with the pronounced warming in producing
cyclones intensified by emissions of black carbon and other
the compound effects on high-impact tropical cyc- aerosols Nature 479 94–97
lones like Fani. Fan J, Rosenfeld D, Zhang Y, Giangrande S E, Li Z, Machado L A,
Martin S T, Yang Y, Wang J and Artaxo P 2018 Substantial
convection and precipitation enhancements by ultrafine
aerosol particles Science 359 411–8
Acknowledgments Fan J, Wang Y, Rosenfeld D and Liu X 2016 Review of
aerosol–cloud interactions: mechanisms, significance, and
LZ is supported by the Strategic Priority Research challenges J. Atmos. Sci. 73 4221–52
Program of the Chinese Academy of Sciences Fu H and Wang Y 2018 Effect of uncertainties in sea surface
temperature dataset on the simulation of typhoon Nangka
(XDA2006010202), the National Natural Sci- (2015) Atmos. Sci. Lett. 19 e797
ence Foundation of China (41930759, 41822501, Fu Q and Liou K 1992 On the correlated k-distribution method
41975012, 91837209, 41605011, 41975130, 41875016, for radiative transfer in nonhomogeneous atmospheres J.
41875018), and the Youth Innovation Promotion Atmos. Sci. 49 2139–56
Grell G A and Dévényi D 2002 A generalized approach to
Association of CAS (QCH2019004). SYSW is sup- parameterizing convection combining ensemble and data
ported by the US Department of Energy under Award assimilation techniques Geophys. Res. Lett. 29 38-1-38-4
Number DE-SC0016605 and the U.S. SERDP Pro- Grell G A, Peckham S E, Schmitz R, Mckeen S A, Frost G,
ject Number RC-2709. JHY is supported by GIST Skamarock W C and Eder B 2005 Fully coupled “online”
chemistry within the WRF model Atmos. Environ. 39
Research Institute IERI grant funded by the GIST 6957–75
in 2020 and the National Research Foundation of Gu Y, Liou K, Ou S and Fovell R 2011 Cirrus cloud simulations
Korea under Grant NRF_2017R1A2B4007480. Sur- using WRF with improved radiation parameterization and
face wind data in Figure 1b is derived from GFS data increased vertical resolution J. Geophys. Res. Atmos. 116
D06119
provided by EMC/NCEP/NWS/NOAA, while current Hassim M, Grabowski W and Lane T 2016 Impact of aerosols on
data in Figure 1c is derived from WAVEWATCH III precipitation over the maritime continent simulated by a
data provided by MMAB/EMC/NCEP/NWS/NOAA, convection-permitting model Atmos. Chem. Phys. Discuss.
displayed by https://earth.nullschool.net. 1–25
Hazra A, Goswami B and Chen J-P 2013 Role of interactions
between aerosol radiative effect, dynamics, and cloud
Data availability statement microphysics on transitions of monsoon intraseasonal
oscillations J. Atmos. Sci. 70 2073–87
The data that support the findings of this study are Hoarau K, Bernard J and Chalonge L 2012 Intense tropical
available upon request from the authors. cyclone activities in the northern Indian Ocean Int. J. Clim.
32 1935–45
Hong S-Y, Noh Y and Dudhia J 2006 A new vertical diffusion
package with an explicit treatment of entrainment processes
ORCID iDs Mon. Weather Rev. 134 2318–41
Janjić Z I 1994 The step-mountain eta coordinate model: further
Lin Zhao https://orcid.org/0000-0002-6520-5096 developments of the convection, viscous sublayer, and
S-Y Simon Wang https://orcid.org/0000-0003- turbulence closure schemes Mon. Weather Rev. 122 927–45
2009-2275 Janssens-Maenhout G, Crippa M, Guizzardi D, Dentener F,
Muntean M, Pouliot G, Keating T, Zhang Q, Kurokawa J and
Jin-Ho Yoon https://orcid.org/0000-0002-4939- Wankmüller R 2015 HTAP_v2. 2: a mosaic of regional and
8078 global emission grid maps for 2008 and 2010 to study
hemispheric transport of air pollution Atmos. Chem. Phys.
15 11411–32
References Jiang B, Lin W, Li F and Chen B 2019 Simulation of the effects of
sea-salt aerosols on cloud ice and precipitation of a tropical
Ackermann I J, Hass H, Memmesheimer M, Ebel A, Binkowski F S cyclone Atmos. Sci. Lett. 20 e936
and Shankar U 1998 Modal aerosol dynamics model for Jiang J H, Su H, Huang L, Wang Y, Massie S, Zhao B, Omar A and
Europe: development and first applications Atmos. Environ. Wang Z 2018 Contrasting effects on deep convective clouds
32 2981–99 by different types of aerosols Nat. Commun. 9 3874
12Environ. Res. Lett. 15 (2020) 094020 L Zhao et al
Kain J S 2004 The Kain–Fritsch convective parameterization: an extreme precipitation during hurricane harvey Geophys. Res.
update J. Appl. Meteorol. 43 170–81 Lett. 44 12457–64
Kanamitsu M, Ebisuzaki W, Woollen J, Yang S-K, Hnilo J, Fiorino Rosenfeld D, Woodley W L, Khain A, Cotton W R, Carrió G,
M and Potter G 2002 Ncep–doe amip-ii reanalysis (r-2) Bull. Ginis I and Golden J H 2012 Aerosol effects on
Am. Meteorol. Soc. 83 1631–44 microstructure and intensity of tropical cyclones Bull. Am.
Krishna K M 2009 Intensifying tropical cyclones over the North Meteorol. Soc. 93 987–1001
Indian ocean during summer monsoon—global warming Skamarock W C, Klemp J B, Dudhia J, Gill D O, Barker D M,
Glob. Planet Change 65 12–16 Duda M G, Huang X-Y, Wang W and Powers J G 2008 A
Landsea C W, Harper B A, Hoarau K and Knaff J A 2006 Can we Description of the Advanced Research WRF Version 3, NCAR
detect trends in extreme tropical cyclones? Science Technical Note (Boulder, CO, USA: National Center for
313 452–4 Atmospheric Research)
Lau W K and Kim K M 2007 How nature foiled the 2006 Sobel A H, Camargo S J and Previdi M 2019 Aerosol versus
hurricane forecasts Eos Trans. Am. Geophys. Union 88 105–7 greenhouse gas effects on tropical cyclone potential intensity
Lenderink G, Barbero R, Loriaux J and Fowler H 2017 and the hydrologic cycle J. Clim. 32 5511–27
Super-clausius–clapeyron scaling of extreme hourly Takayabu I, Hibino K, Sasaki H, Shiogama H, Mori N, Shibutani
convective precipitation and its relation to large-scale Y and Takemi T 2015 Climate change effects on the
atmospheric conditions J. Clim. 30 6037–52 worst-case storm surge: a case study of Typhoon Haiyan
Lin Y-L, Farley R D and Orville H D 1983 Bulk parameterization Environ. Res. Lett. 10 064011
of the snow field in a cloud model J. Clim. Appl. Meteorol. 22 Tao W K, Chen J P, Li Z, Wang C and Zhang C 2012 Impact of
1065–92 aerosols on convective clouds and precipitation Rev.
May P, Bringi V and Thurai M 2011 Do we observe aerosol Geophys. 50 RG2001
impacts on DSDs in strongly forced tropical thunderstorms? Trenberth K E, Cheng L, Jacobs P, Zhang Y and Fasullo J 2018
J. Atmos. Sci. 68 1902–10 Hurricane Harvey links to ocean heat content and climate
Morrison H, Thompson G and Tatarskii V 2009 Impact of cloud change adaptation Earth’s Future 6 730–44
microphysics on the development of trailing stratiform Van Oldenborgh G J, Van Der Wiel K, Sebastian A, Singh R,
precipitation in a simulated squall line: comparison of Arrighi J, Otto F, Haustein K, Li S, Vecchi G and Cullen H
one-and two-moment schemes Mon. Weather Rev. 137 2017 Attribution of extreme rainfall from Hurricane Harvey,
991–1007 august 2017 Environ. Res. Lett. 12 124009
Nakanishi M and Niino H 2006 An improved Mellor–Yamada Varble A 2018 Erroneous attribution of deep convective
level-3 model: its numerical stability and application to a invigoration to aerosol concentration J. Atmos. Sci 75
regional prediction of advection fog Bound.-Layer Meteorol. 1351–68
119 397–407 Wang S S, Zhao L, Yoon J-H, Klotzbach P and Gillies R R 2018
Ng E K and Chan J C 2012 Interannual variations of tropical Quantitative attribution of climate effects on Hurricane
cyclone activity over the north Indian Ocean Int. J. Clim. 32 Harvey’s extreme rainfall in Texas Environ. Res. Lett. 13
819–30 054014
Patricola C M and Wehner M F 2018 Anthropogenic influences on Wang S Y, Buckley B M, Yoon J H and Fosu B 2013 Intensification
major tropical cyclone events Nature 563 339–46 of premonsoon tropical cyclones in the Bay of Bengal and its
Powers J G, Klemp J B, Skamarock W C, Davis C A, Dudhia J, Gill impacts on Myanmar J. Geophys. Res. Atmos. 118 4373–84
D O, Coen J L, Gochis D J, Ahmadov R and Peckham S E Wang S Y S, Zhao L and Gillies R R 2016 Synoptic and quantitative
2017 The weather research and forecasting model: overview, attributions of the extreme precipitation leading to the
system efforts, and future directions Bull. Am. Meteorol. Soc. August 2016 Louisiana flood Geophys. Res. Lett. 43 11805–14
98 1717–37 Wehner M F, Reed K A and Zarzycki C M 2017 High-resolution
Reale O, Lau K, Da Silva A and Matsui T 2014 Impact of Multi-decadal Simulation of Tropical Cyclones. Hurricanes
assimilated and interactive aerosol on tropical cyclogenesis and Climate Change (Berlin: Springer) pp 187–211
Geophys. Res. Lett. 41 3282–8 Yu J and Wang Y 2009 Response of tropical cyclone potential
Reed K, Stansfield A, Wehner M and Zarzycki C 2020 Forecasted intensity over the north Indian Ocean to global warming
attribution of the human influence on Hurricane Florence Geophys. Res. Lett. 36 L03709
Sci. Adv. 6 eaaw9253 Zappa G and Shepherd T G 2017 Storylines of atmospheric
Reynolds R W, Smith T M, Liu C, Chelton D B, Casey K S and circulation change for European regional climate impact
Schlax M G 2007 Daily high-resolution-blended analyses for assessment J. Clim. 30 6561–77
sea surface temperature J. Clim. 20 5473–96 Zaveri R A and Peters L K 1999 A new lumped structure
Risser M D and Wehner M F 2017 Attributable human-induced photochemical mechanism for large-scale applications J.
changes in the likelihood and magnitude of the observed Geophys. Res. Atmos. 104 30387–415
13You can also read