Designing a Pilot Remote and Rural Migration Scheme for Scotland: Analysis and Policy Options - Expert Advisory Group on Migration and Population
←
→
Page content transcription
If your browser does not render page correctly, please read the page content below
Designing a Pilot Remote
and Rural Migration
Scheme for Scotland:
Analysis and Policy
Options

Expert Advisory Group on Migration and Population
Designing a Pilot Rem ote and Rural Migration Schem e for Scotland: Analysis and Policy Options

Contents

Executive Summary                                                                               3

Introduction                                                                                    7

1. Population Trends in Remote and Rural Areas                                                  9

2. Economic and Social Context                                                                20

3. Policy Options                                                                             32

4. Integration and Settlement                                                                 46

References                                                                                    56

                                                 1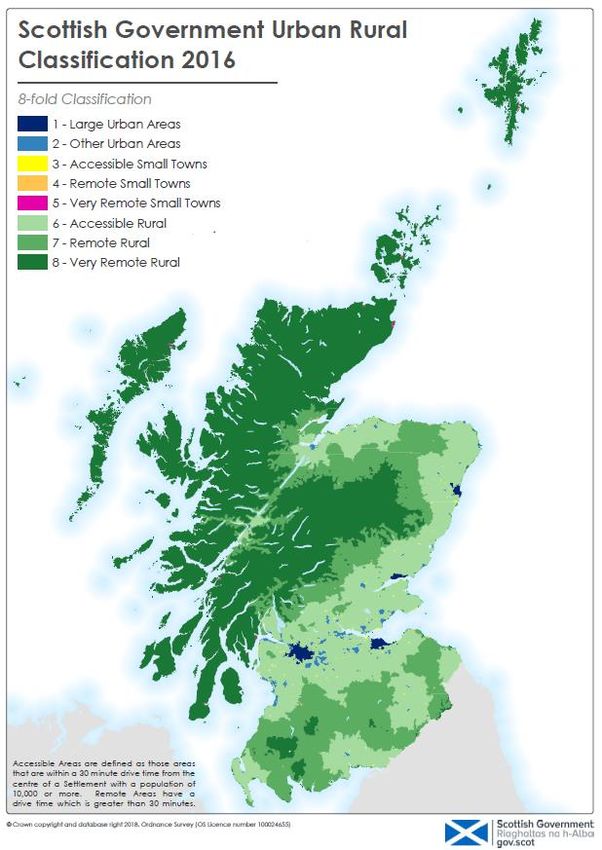
Designing a Pilot Rem ote and Rural Migration Schem e for Scotland: Analysis and Policy Options

Expert Advisory Group on Migration & Population

Chair

Professor Christina Boswell
University of Edinburgh

Members

Professor David Bell
University of Stirling

Dr Andrew Copus
Karelian Institute, University of Eastern Finland

Professor Rebecca Kay
University of Glasgow

Professor Hill Kulu
University of St Andrews

                                                 2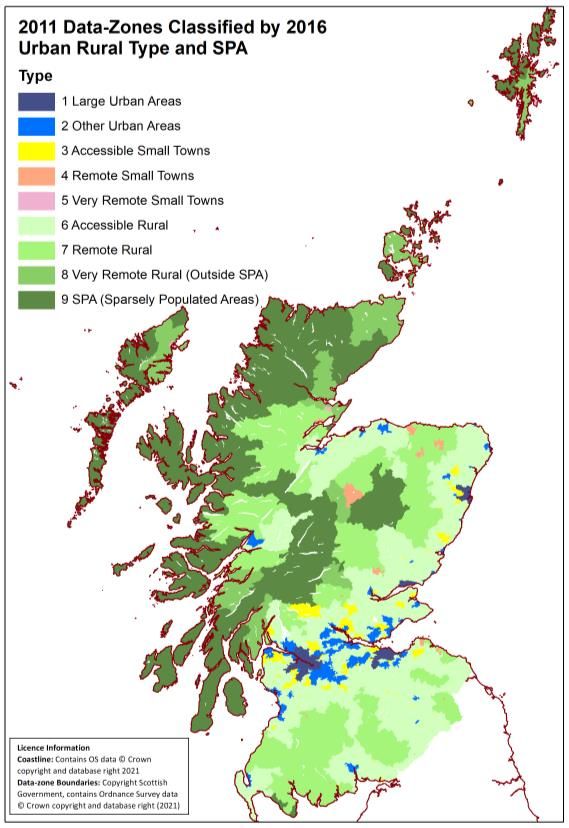
Designing a Pilot Rem ote and Rural Migration Schem e for Scotland: Analysis and Policy Options

Executive Summary
This report sets out analysis and policy options to inform a potential pilot
scheme for migration to remote and rural areas of Scotland. It builds on earlier
Expert Advisory Group reports setting out the particular demographic
challenges faced by remote and rural areas, and the potential for international
migration to help address them. These considerations underpinned
recommendations from the Migration Advisory Committee in 2019 to establish
a pilot scheme for attracting migration to remote and rural areas, endorsed by
the then Home Secretary.

In designing such a scheme, it is important to clarify which types of areas
would be covered. Most definitions of ‘remote and rural’ areas are based on
measures of population density and drive-time from more populous
settlements; however, such classifications can be based on different
geographical units, and this becomes important when considering which
areas might be included in such a scheme. In the report, we suggest two main
ways of identifying which remote and rural areas of Scotland might be
‘designated areas’ for a remote and rural migration scheme, based on
population data, and also taking into account travel to work areas.

A second key point is about the goal of such a scheme. A migration scheme
for remote and rural areas should not aim to achieve ‘replacement migration’
to offset population decline. Rather, it should be targeted to attract migrants
with the skills and profile that would best address socio-economic challenges
created by population decline – an approach we term ‘strategic mitigation’.

The Challenges for Remote and Rural Areas

Scotland’s remote and rural areas have experienced population ageing and
decline over a number of years, and by 2019, the share of population of
working age in remote and rural areas was 6-7 percentage points below the
Scottish average. This ageing process reduces the number of births and
increases the number of deaths, with the consequence that the only way for
an ageing population to grow is through expanding in-migration. However,
population decline in remote and rural areas has not been offset by in-
migration. Positive net migration to remote rural areas has remained at very
low levels, and in 2017-18 only around 7% of in-migration was from overseas.

Population decline has a range of negative social and economic impacts on
local communities. It restricts the local labour supply, and leads to an increase
in its average age. Labour markets in sparsely populated areas are
particularly vulnerable, as small increases or decreases in labour supply can
have large effects on the viability of the local economy. There is no readily
available pool of labour to fill vacancies. Population decline can also
adversely affect public service provision, through creating labour shortages in
key services. Moreover, government funding formulae for public services are
largely population driven, implying that public services will receive less
resource as people move away, which can then further accelerate economic
and population decline.

                                                 3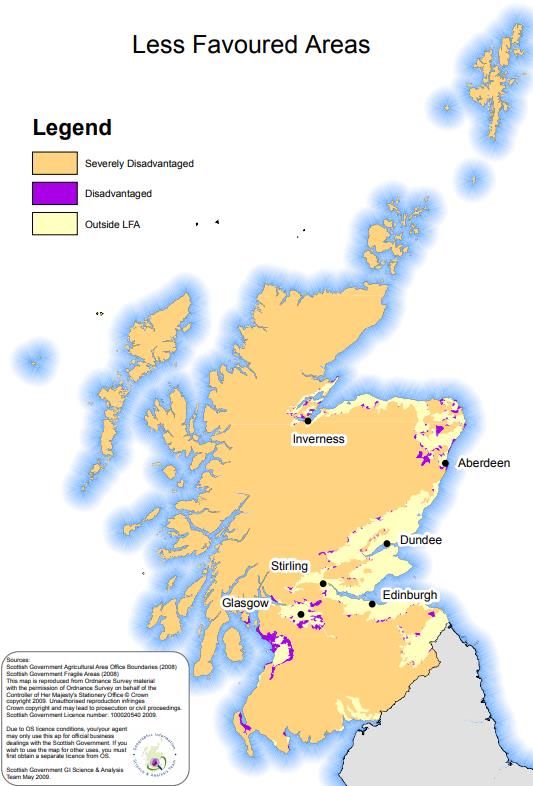
Designing a Pilot Rem ote and Rural Migration Schem e for Scotland: Analysis and Policy Options

As employers struggle to recruit and local economies become less buoyant,
businesses may leave the area taking with them access to more attractive or
better-paid jobs. As remaining residents age, commercial and leisure facilities
and social services for younger people and families often decline making it
less attractive for those age groups to stay, whether they are locally born or
newer arrivals. In these ways a spiral effect is created.

It is important to understand these dynamics, to inform the design of a
potential immigration scheme. Clearly, the negative socio-economic impacts
of population decline create a strong rationale for seeking to mitigate such
decline through facilitating in-migration. At the same time, in order for such in-
migration to be viable and lead to longer-term settlement, it is important to
make sure there are sustainable employment opportunities and an attractive
environment for migrants in the local area.

Options for a Remote and Rural Migration Scheme (RRMS)

Based on this analysis, we suggest that a RRMS should aim to attract
migrants with the skills and profile that can best contribute to strategic
mitigation in remote and rural areas. This implies selecting migrants with
relevant skills and occupations to meet labour market needs; and supporting
them to settle and integrate in such areas with their families. Building on these
considerations, we set out three main proposals for a RRMS.

1.       Expanding Skilled Worker Route

The first scheme would involve relaxing conditions for the Skilled Worker
route (previously known as Tier 2), specifically for employers in designated
areas. We suggest the most viable option for this approach would be through
a bespoke Shortage Occupation List for remote and rural areas. The list
would include occupations of strategic importance to remote and rural areas,
and accommodate a wider range of skills and salaries than currently permitted
under this route. Sponsored employers could recruit migrants to jobs located
in a designated area, and matching the list of shortage occupations.

In order to maximise the benefits of this scheme for remote and rural areas,
the scheme would need to either encourage, or require, entrants and their
families to also reside in the designated area. This would be more feasible if
the designated area took the form of an existing travel to work area.

The advantage of the modified Skilled Worker approach is that it would
involve only modest adjustments to current UK immigration rules. It would
allow employers in remote areas to recruit migrants across a wider spectrum
of skills, salaries and occupations. It also builds in a route to permanent
settlement, although migrants would need to have continuous employment in
an eligible occupation and a designated area for 5 years.

                                                   4
Designing a Pilot Rem ote and Rural Migration Schem e for Scotland: Analysis and Policy Options

2.       Scottish Visa

The second scheme would build on the Scottish Government proposal for a
Scottish Visa, but specifically targeted at designated areas. Rather than
relying on employers to identify entrants, this scheme would involve a points-
based system, which prioritised features such as skills and occupational
experience, age, family/dependents, language skills, ties to the region.
Scottish Government would set a quota for the number to be admitted,
potentially by local authority.

Such a scheme would need to offer a generous package of rights from the
outset, including recourse to public funds. This would be especially important
for migrants moving to remote and rural areas, given the existence of ‘shallow’
labour markets in such areas. We propose that the requirement to be based in
a designated area would apply for the first 4 years, at which point migrants
would be eligible for permanent residency and full mobility rights within the
UK.

The disadvantage of this scheme is that it would not include a guarantee of
viable employment, or a successful business start-up, in the place of
destination. This risk could be partially mitigated by including criteria relating
to particular occupations/skills that are in demand within the points-based
system.

3.       Remote and Rural Partnership Scheme

The third option, modelled on the Canadian Atlantic Pilot scheme, would be a
job-based scheme, embedded in a broader partnership between local
authorities, employers, public services and the voluntary sector. Under this
scheme, the Scottish Government would work with local authorities and
employers in designated areas to develop a ‘strategic mitigation’ plan,
including identifying occupations that were seen as crucial for mitigating
population decline. However, unlike for the Shortage Occupation List option,
they could be areas displaying strong potential for future growth/regeneration,
rather than being limited to those that could demonstrate (existing) acute
shortages. Employers with job vacancies within the occupations identified in
the strategic mitigation plan could enrol in the scheme. They would agree to
take an active role in supporting employees, in turn receiving assistance in
recruiting workers from overseas, and exemption from paying fees or charges.

Enrolled employers would nominate employees to enter through the scheme,
with entrants approved by the Home Office. Those entering under the scheme
would signal their intention to stay in a designated area of Scotland (for at
least 4 years). They would have a job offer, and be offered an integration
package including help in finding accommodation, schooling, access to health
and other public services, and language classes for the family. As with the
other options, it would be most beneficial for local areas if entrants would both
work and reside in the designated area. If designated areas are defined as co-
extensive with travel to work areas, this is likely to be achievable in the
majority of cases.

                                                   5
Designing a Pilot Rem ote and Rural Migration Schem e for Scotland: Analysis and Policy Options
Evaluating a Pilot Scheme
For each of these three options, a pilot scheme would involve trialling the
scheme for a small number of migrants (for example, 200). The long-term
success of the scheme would be assessed based on its potential to contribute
to strategic mitigation in remote and rural areas facing depopulation. As such
an effect may take many years to kick in, and it would be more appropriate to
evaluate the performance of the scheme in relation to more specific medium-
term goals, notably:
Attracting migrants with the appropriate profile to contribute to the
economic and social well-being of the local community in designated
areas.
Supporting the integration and long-term settlement of migrants and
their families in these designated areas.
We set out a range of indicators and methods that could be used to monitor
achievement of these goals, to evaluating the success of a pilot scheme.
Promoting Integration and Settlement
All three of the schemes would be enhanced by complementary initiatives to
support integration and settlement in remote and rural areas. This approach
was built into our third ‘partnership’ scheme; but the other two schemes would
also benefit from measures to mobilise stakeholders and the wider community
to support migrants and their families.
Communities in remote and rural areas may have limited experience of
receiving international migrants, and offer more limited public services and
amenities than urban areas. In such settings, particular attention needs to be
paid to assisting newcomers to make positive social contacts and ensuring
that they have access to and knowledge of their rights and entitlements. It will
therefore be important that the RRMS be developed alongside a clearly
defined integration strategy. The Scottish Government would need to work
with local authorities and other stakeholders to develop an integration
framework that can be adapted to the capacities and needs of the designated
areas and the groups of migrants who arrive to them; and which clearly sets
out the roles and responsibilities of different stakeholders, and the resources
available to them.
61 Introduction
Designing a Pilot Rem ote and Rural Migration Schem e for Scotland: Analysis and Policy Options

Introduction

Background to the report

Scotland’s remote and rural areas face significant demographic challenges. A
legacy of selective out-migration over the last decades of the twentieth
century means that most remote and rural areas are experiencing negative
natural change (more deaths than births), and their population is declining as
well as ageing. At the same time, low levels of net migration from other areas
of Scotland, the UK and overseas (especially compared to Scotland’s cities),
means that population decline is not being offset by in-migration. Population
ageing and decline can have a range of negative effects for local
communities, reducing their capacity to sustain local services and businesses.

These challenges were highlighted in the first Expert Advisory Group (EAG)
report, which argued that in-migration of working-age migrants was the only
viable option for averting a downward demographic spiral.1 The Migration
Advisory Committee (MAC) acknowledged the issues in a May 2019 report,
noting that the ‘only way to address this question in the UK context would be
to pilot a scheme that facilitated migration to these areas, then monitor what
happens over several years and evaluate the outcomes’.2

In order to develop an evidence base for designing and piloting a remote and
rural migration scheme (RRMS), the Scottish Government commissioned the
EAG to prepare a report on how such a scheme to attract international
migration to these areas might operate, and its potential impacts on remote
and rural communities. The commission reflects the priority which the Scottish
Government places on addressing depopulation in rural and island areas, as
reflected in the National Planning Framework.3

Chapter 1 of the report provides some background analysis on the
demographic challenges in remote and rural areas, building on earlier EAG
analysis. Chapter 2 analyses the economic and social impacts of population
ageing and decline for local communities. The chapter discusses different
approaches to identifying which remote and rural areas might participate in
the scheme.

The report goes on to consider different options for a RRMS (Chapter 3),
including the criteria for recruitment of entrants; and their rights and conditions
of stay. The chapter also considers how such a scheme might be piloted and
evaluated. Finally, we consider how a RRMS would best be implemented,
including exploring issues around settlement and retention and longer-term
integration (Chapter 4).

Definitions

It is important to note at the outset how we use the term ‘remote and rural’
through this report. There is no standard definition of this term, and its
meaning will vary depending on which aspect of ‘remoteness’ is emphasised,
and which data and level of analysis are employed.

                                                 7
Designing a Pilot Rem ote and Rural Migration Schem e for Scotland: Analysis and Policy Options
We define and clarify various aspects of these definitions in Chapter 1, which
starts with an analysis of small area data, to gain a granular picture of
demographic change across smaller geographical units. However, we go on
to adopt a more generalised framework allowing us to draw on a wider range
of data, and to align the analysis with more familiar geographical
classifications. To this end, we draw on the Scottish Government’s own
Urban-Rural classification (2016).4 The 8-fold version, distinguishing ‘very
remote’ rural areas and small towns, contains most of the areas with the most
rapid demographic decline. An even ‘tighter boundary’ is provided by the
James Hutton Institute’s ‘Sparsely Populated Area’ (SPA) definition.5
The analysis of population change in Chapter 1 uses these definitions. Parts
of the socio-economic analysis of Chapter 2 use the 6-fold version of the
Urban-Rural classification, in which the ‘very remote’ rural areas and small
towns form part of the ‘remote’ category. Other parts of the analysis in
Chapters 1 and 2 are based upon data for Council Areas. In this case, the
Rural & Environment Science & Analytical Service (RESAS) Urban-Rural
classification6 is used. Some analysis in Chapter 2 is based upon data from
Rural Scotland Key Facts, and it is important to be aware that in this case the
small towns are not included in the ‘remote rural’ category. Based on the
analysis of Chapters 1 and 2, the report also introduces the term ‘designated
areas’ to refer to those areas that might be included in a RRMS.
A second key concept in the report is the notion of ‘strategic mitigation’. We
use this term to capture the insight that a scheme to attract international
migration to remote and rural areas should not aim to achieve one-to-one
‘replacement migration’. Rather, it should focus in a more targeted way in
attracting migrants with the skills and profile that would best address the
social and economic challenges created by population decline.
Finally, we note that the report focuses on international migration, rather than
internal migration within Scotland or from the rest of the UK (covered in the
EAG’s fourth report7). This reflects the specific recommendation to design a
pilot scheme for international migration to remote and rural areas, and
Chapter 3 on policy options is focused solely on a discussion of schemes to
attract migrants from overseas. However, we note that much of the analysis in
Chapters 1 and 2, and the recommendations in Chapter 4, are relevant to
promoting and supporting migration from within Scotland and the UK.
81 Population Trends in Remote and Rural Areas
Designing a Pilot Rem ote and Rural Migration Schem e for Scotland: Analysis and Policy Options
1. Population Trends in Remote and Rural Areas
This chapter explores population trends in remote and rural parts of Scotland.
It begins (section 1.1) by illustrating the complexity of patterns of change at
the most detailed geographic level (data-zone), and for three broad age
groups. However, at this level of granularity it is very difficult to understand the
overall narrative of recent changes, and for this reason we introduce a
discussion of different ways of classifying remote and rural areas (1.2). We
then consider population trends in these areas, looking at changes in overall
population and age structure (1.3), and migration (1.4).
1.1 Patterns of Population Change at the Local Level
Remote Scotland has experienced a long history of demographic decline,
dating back to the Highland Clearances of the 18th and 19th centuries. In terms
of age structure legacy effects, it would be interesting to track change since
the middle of the last century. However, for small area analysis with a
consistent data set we are limited to the period 2001-19.
The Scottish population as a whole has seen fairly steady growth over the
past two decades. The population was 8% higher in 2019 than it was in 2001.
However, many parts of rural Scotland have seen periods of both growth and
decline since 2001. Generally speaking, the first few years of the new century
were characterised by growth, even in the most remote areas of Scotland.
However, from the later years of the first decade, change turned negative in
the more remote parts of Scotland, whilst the upward trend was sustained
only within the most accessible rural areas.
The best way to capture variations in population change across different
areas is through data-zone mapping, drawing on the Small Area Population
Estimates (SAPE) produced by National Records of Scotland (NRS). These
provide population estimates for 6,976 data-zones across Scotland, each
containing approximately 500-1,000 people. The SAPE offer population
estimates for each year since the 2001 census. Using these data, we can
identify the year of peak population, and then calculate the average annual
percentage change since that date.
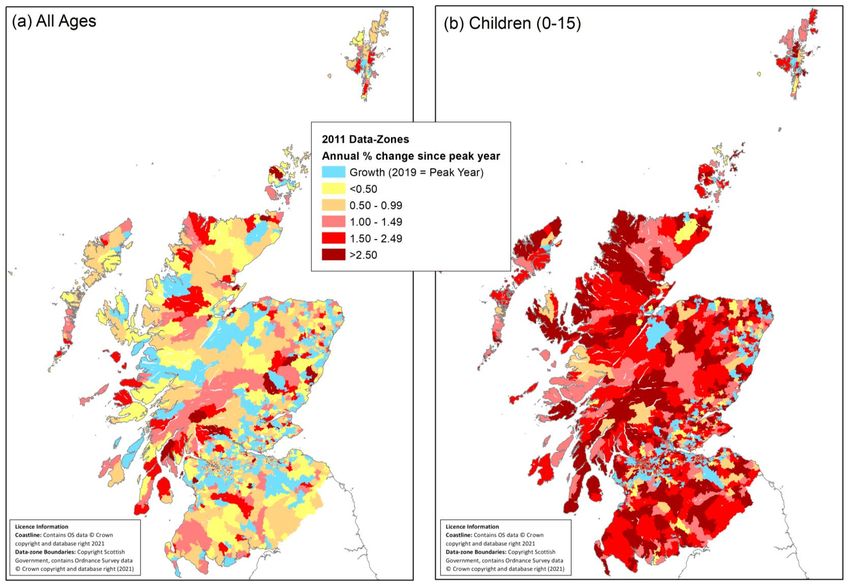
For many more accessible parts of the country, growth has been continuous,
and peak population is recorded in 2019. These areas are shaded blue in
Figure 1.1a. The yellow-red shaded areas have been losing population for all
or part of the last two decades. The distribution of blue and red areas across
Scotland demonstrates the complexity of patterns of population change, and
serves as a warning against simplistic generalisations. The pattern is very
fragmented, and maps like Figure 1.1 tend to make rural-urban comparisons
challenging, but as the aggregate analysis in Section 1.3 indicates, remote
parts of Scotland have shown the most consistent decline.
9Designing a Pilot Rem ote and Rural Migration Schem e for Scotland: Analysis and Policy Options
Figure 1.1: Average Annual Percentage Change in Population since Peak Year, 2001-19 by Data-Zone
Source: Derived from NRS Small Area Population Estimates Time Series Data
10Designing a Pilot Rem ote and Rural Migration Schem e for Scotland: Analysis and Policy Options
Source: Derived from NRS Small Area Population Estimates Time Series Data
11Designing a Pilot Rem ote and Rural Migration Schem e for Scotland: Analysis and Policy Options
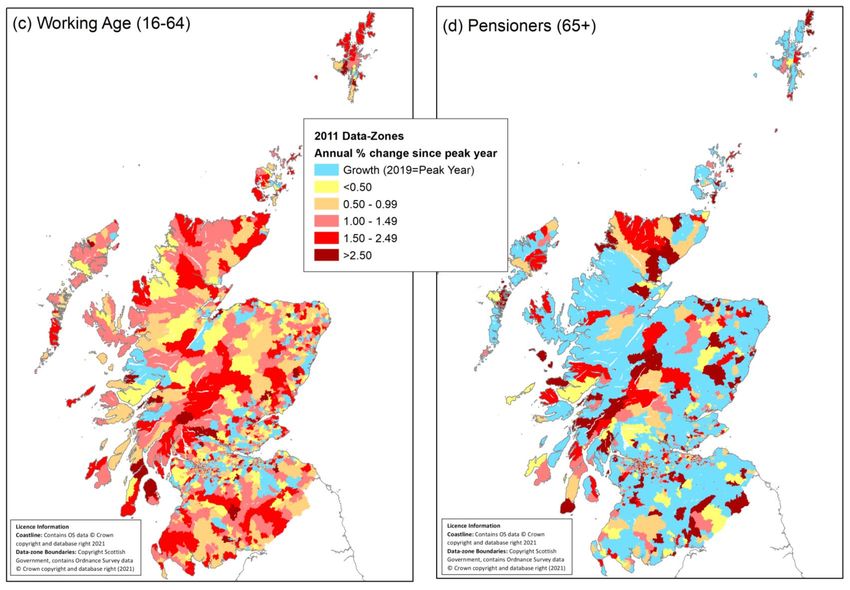
Figures 1.1b-d show that the overall trend masks important age-related
differences. Decline has been more rapid and widespread for children (Figure
1.1b). The population of pensioners has grown in most parts of rural Scotland
(Figure 1.1d). The pattern for the working age population is intermediate
between these two extremes (Figure 1.1c). Arguably it is the working age
population that is most relevant to this report, since it is working age migrants
who can contribute most to strategic mitigation. However, children are of
course crucial to the demographic sustainability of rural Scotland.
This breakdown of population growth by data-zone provides important insights
into detailed local demographic patterns; but it is less helpful as a framework
for understanding broader trends. For this we need to group zones into larger
geographical areas. Such a framework can facilitate analysis of different age
groups within the population, which for many rural data-zones is rendered
precarious by the small numbers involved. It will also assist in the
identification of viable units for inclusion in pilot schemes.
1.2 Classifying remote rural and sparsely population areas
For these reasons it is helpful to group data-zones by rurality and remoteness.
Our starting point is Scottish Government’s 2016 Urban-Rural classification.
Figure 1.2: Scottish Government Urban-Rural Classification 2016 (8-fold)
(a) (b)
Source: Scottish Government 8-fold Urban-Rural Classification
Note: Figure 1.2b is derived from a combination of Scottish Government 8-fold
Urban-Rural classification and James Hutton Institute SPA classification
12Designing a Pilot Rem ote and Rural Migration Schem e for Scotland: Analysis and Policy Options
The 8-fold version (Figure 1.2a) is more useful than the 6-fold version for a
study of population change, because it separates the very remote rural areas
and small towns. The remote rural areas of the 6-fold classification are
defined by a drive-time contour of 30 minutes from a settlement of 10,000
persons. This incorporates a very large and diverse area – much of which has
seen population growth in recent years. The very remote area is defined by
60-minute drive-time from a settlement.
The boundaries of the Urban-Rural classification follow the drive-time
contours. In order to relate our (SAPE-based) analysis of population trends to
this classification it is necessary to produce a ‘best fit’ map of data-zones.
Figure 1.2b shows Scotland’s data-zones classified according to which Urban-
Rural category their centroid falls within.
As Figure 1.2a shows, the Urban-Rural classification designates almost all of
the three Island Council Areas, and the north and west of Highland, including
the areas immediately surrounding the three island capitals, together with
Thurso, Wick and Oban, as ‘very remote rural’. However, as Figure 1.1a
shows, the immediate commuting zones around these centres exhibit very
different demographic characteristics to the rest of very remote rural. These
areas can be separated if we overlay the ‘Sparsely Populated Area’ (SPA)
(Figure 1.2b).8 The SPA was specified (at output area level) using a
‘population potential’ approach, based on the total population which fell within
a 30-minute drive-time. For the purposes of this analysis, data-zones 100%
within the SPA boundary have been identified as SPA. On this basis the areas
adjacent to the Islands capitals can form a separate category, which we have
labelled ‘very remote rural (outside SPA)’. This category also covers an area
around the Dornoch Firth, Speyside, and around Lochgilphead.
1.3 Population trends
The particular demographic challenges faced by remote and rural areas may
be illustrated in greater detail through an analysis of the NRS Small Area
Population Estimates (SAPE).
Table 1.1 provides some basic demographic data for each of the urban rural
categories shown in Figure 1,2b. Remote and very remote rural and small
town data-zones are home to less than 10% of the total population of
Scotland. Whilst urban, accessible and even remote rural areas continued to
grow in the two decades prior to 2019, the populations of very remote rural
areas and small towns have declined in recent years. A similar, but more
negative, pattern is seen in the working age population, with peak population
occurring in 2011 in all the small town categories, and in 2007/8 in the
remote/very remote rural categories.
13Designing a Pilot Rem ote and Rural Migration Schem e for Scotland: Analysis and Policy Options
Table 1.1: Population Totals and Peak Years for Rural and Urban Categories
Total Population Peak Working Age Peak
(‘000) Year Population (‘000) Year
2001 2019 2001 2019
Large Urban 1,748 1,911 2019 1,157 1,303 2019
Other Urban 1,854 1,960 2017 1,201 1,232 2011
Accessible Small Towns 441 469 2019 283 286 2011
Remote Small Towns 117 125 2019 71 73 2011
Very Remote Small Towns 69 66 2011 43 39 2011
Accessible Rural 535 617 2019 346 378 2019
Remote Rural 156 167 2019 97 98 2007
Very Remote Rural 145 150 2010 90 88 2008
SPA 113 111 2007 70 64 2007
Very Remote Rural Non-SPA 31 39 2019 20 24 2019
Scotland 5,064 5,463 2019 3,287 3,498 2019
Source: NRS Small Area Population Estimates
Note: The table rows are a combination of the Scottish Government 8-fold
Urban-Rural classification and James Hutton Institute SPA classification.
Between 2001 and 2019 the total population of Scotland (dashed line on
Figures 1.3-1.5) increased by 8%. That of remote, very remote, and SPA
data-zones initially grew faster than Scotland as a whole, reaching a peak in
the second half of the noughties, then declined. The SPA population reached
a point more than 2% below its 2001 level, whilst the remote and very remote
areas remain above their starting point in 2001. In contrast the population of
accessible rural areas has consistently out-performed that of Scotland as a
whole. Perhaps most surprisingly the fastest growing group of data-zones
(though also by far the smallest in population terms) was the very remote rural
(non-SPA), which reached a point almost 25% up on its 2001 level.
Figure 1.3: Population Trends for Rural and Small Town Data-Zones 2001-19
2001=100 2001=100
(a) Rural (b) Small Towns
125 125
Very Remote Non-SPA
120 120
Accessible
115 115
110 110 Remote
105 Remote 105
Accessible
Very Remote
100 100 Very Remote
95
SPA
95
2001
2004
2006
2009
2012
2017
2002
2003
2005
2007
2008
2010
2011
2013
2014
2015
2016
2018
2019
2004
2005
2009
2013
2014
2018
2001
2002
2003
2006
2007
2008
2010
2011
2012
2015
2016
2017
2019
Source: National Records of Scotland; Small Area Population Estimates
Notes: (i) Estimated by aggregating data zones classified according to the Scottish Government Urban-Rural Classification and the James
Source: NRS Small Area Population Estimates
Hutton Institute SPA classification.
Notes: (ii) Black dashed line is Scotland average.
(i) Estimated by aggregating data zones according to Scottish Government
Urban-Rural classification and James Hutton Institute SPA classification.
(ii) Black dashed line is Scotland average.
14Designing a Pilot Rem ote and Rural Migration Schem e for Scotland: Analysis and Policy Options
Population trends in small towns (Figure 1.3b) were rather more subdued.
Accessible Small Towns closely followed the national trend, whilst remote
towns grew slightly more rapidly until 2011, but subsequently levelled off,
converging with the national trend by 2019. Very remote towns showed
stability until 2011, but then contracted by almost 5%.
Turning to the age structure of the population, SAPE data shows that across
Scotland, the percentage of the population in the 0-15 age group declined
from 19% in 2001 to a little under 17% in 2019 (Figure 1.4a). The child
populations of remote, very remote and SPA data-zones were at a similar
level in 2001, but over the past two decades their shares have all contracted
more rapidly – reaching between 14.5% (SPA) and 15.5% (remote).
Figure 1.4: Broad Age Group Trends by Rural and Small Town Category,
2001-2019
Rural Children (0-15) as a % Total Population Towns
21 21
20 20
19 19
18 18
Accessible
Accessible
17 17 Remote
Very Remote Non-SPA Very Remote
16 16
Remote
15 Very Remote 15
SPA
14 14
2001
2002
2003
2004
2005
2006
2007
2008
2009
2010
2011
2012
2013
2014
2015
2016
2017
2018
2019
2001
2002
2003
2004
2005
2006
2007
2008
2009
2010
2011
2012
2013
2014
2015
2016
2017
2018
2019
Working Age (16-64) as a % Total Population Towns
Rural
66 66
65 65
64 64
63 63
62 62
61 Accessible 61 Accessible
60 Very Remote Non-SPA 60 Very Remote
59 Remote 59
Very Remote Remote
58 58
SPA
57 57
2001
2002
2003
2004
2005
2006
2007
2008
2009
2010
2011
2012
2013
2014
2015
2016
2017
2018
2019
2001
2002
2003
2004
2005
2006
2007
2008
2009
2010
2011
2012
2013
2014
2015
2016
2017
2018
2019
Rural Pensioners (65+) as a % Total Population
Towns
28 SPA 28
26 Very Remote 26
Remote Remote
24 24 Very Remote
Very Remote Non-SPA
22 22
Accessible Accessible
20 20
18 18
16 16
14 14
2001
2002
2003
2004
2005
2006
2007
2008
2009
2010
2011
2012
2013
2014
2015
2016
2017
2018
2019
2001
2002
2003
2004
2005
2006
2007
2008
2009
2010
2011
2012
2013
2014
2015
2016
2017
2018
2019
Source: National Records of Scotland, Small Area Population Estimates
Notes: (i) Estimated by aggregating data zones classified according to the Scottish Government Urban-Rural Classification and the James Hutton Institute SPA classification.
(ii) Black dashed line is Scotland average.
Source: NRS Small Area Population Estimates
Notes:
(i) Estimated by aggregating data zones according to Scottish Government
Urban-Rural classification and James Hutton Institute SPA classification.
(ii) Black dashed line is Scotland average.
15Designing a Pilot Rem ote and Rural Migration Schem e for Scotland: Analysis and Policy Options
The working age share of the Scottish population (Figure 1.4b) rose slightly
from 2001 to 2011, reaching almost 66%, thereafter declining steadily,
reaching 64% in 2019. All but one of the rural groups of data-zones had a
similar profile over the two decades, but with an earlier onset and deeper
decline. Accessible rural areas and the non-SPA part of very remote rural
were both close to the Scottish average at the beginning of the period, but
diverged steadily, so that by 2019 they were approximately 2.5% and 3.5%
lower than the country as a whole. The remote, very remote and SPA areas
began the period with their working age share 2-3% below the average, and
ended it 4-5% below.
The pensioner (over 65) share of the Scottish population was 16% in 2001
(Figure 1.4c). It rose steadily over the next two decades, reaching 19% by
2019. All the rural groups of data-zones showed a steeper upward trend in the
share of pensioners. The remote, very remote and SPA groups were already
well above the Scottish average in 2001, and by 2019 the SPA share was
almost 10% higher. Among the small towns groups the trends were very
similar, with the accessible towns beginning slightly below the Scottish
average and finishing 2% above. Remote and very remote towns had a higher
share of pensioners throughout the period.
The above account illustrates the familiar story of demographic ageing, which
is more severe in rural and remote areas than in the urban parts of the
country. The trend in working age population, which has two segments,
initially increasing and later turning negative, is particularly interesting. The
key finding here is that by 2019 the share of population of working age in
remote and rural areas and towns was 6-7 percentage points below the
Scottish average. The significance of the ageing process for migration policy
lies in the fact that the ageing of the population has consequences for its
capacity for natural increase, reducing the number of births and increasing the
number of deaths. As a consequence, the only way for an ageing population
to grow is through expanding in-migration.
1.4 Migration trends
As we have shown in previous EAG reports9,10 population decline in remote
and rural areas has not been offset by in-migration. In this section, we briefly
consider patterns of both Scotland/UK and international migration into and out
of these areas. This is relevant both for understanding the demographic
challenges of remote and rural areas, and also for reflecting on the design of
a future RRMS.
16Designing a Pilot Rem ote and Rural Migration Schem e for Scotland: Analysis and Policy Options
Figure 1.5: In and Out Migrants per 10,000 persons by 6-fold Urban-Rural
Classification 2001-2019
Source: NRS Small Area Population Estimates; Urban-Rural Analysis Table 3
In order to explore trends in migration to remote and rural areas, we draw on
a table provided by National Records of Scotland as part of the SAPE, which
is disaggregated according to the six-fold classification (Figure 1.5). These
data do not distinguish overseas migration from that originating in other parts
of the UK, or mobility within Scotland.
These data indicate that rural areas and small towns, especially in accessible
areas, have more mobile populations than the cities – rural areas and small
towns have higher rates of both in and out migration per 10,000 head of
population. This may reflect a greater propensity to relocate in search of jobs
and services. The trend over time is less clear, although all areas appear to
have experienced a gradual reduction in both in and out flows in the 2000s.
After 2011 there appears to have been a rising trend which levelled off during
the second half of the decade.
Figure 1.6: Net Migration per 10,000 persons by 6-fold Urban-Rural Category
2001-19
Source: NRS Small Area Population Estimates; Urban-Rural Analysis Table 3
Patterns and trends of net migration are less clear (Figure 1.6). During the
first few years of the century, remote rural and accessible rural had the most
positive net migration rates (per 10,000 head of population), whilst the large
17Designing a Pilot Rem ote and Rural Migration Schem e for Scotland: Analysis and Policy Options
urban areas showed negative rates. By the end of the period, although
accessible rural areas remained in the most positive position, the rates for
remote rural areas had moved down close to zero, whilst the large urban
areas had the second most positive rates.
Only a very small proportion of this migration involved migrants from
overseas. The RESAS classification of Council Areas 11 groups the three
Island Areas and Argyll and Bute in the category ‘Islands and Remote Rural’.
According to NRS Local Area Migration data, only 7% of in-migrants to these
areas, in the year 2017-18, originated overseas. In the Mainly Rural, and
Urban with Substantial Rural Council Areas the proportion was a little higher,
at 8% and 9% respectively. In the Larger City Council Areas the proportion
was three times greater, at 28%.
Figure 1.7 illustrates the trends in net migration rates (per 10,000) from within
Scotland, from the rest of the UK, and from overseas, for the four RESAS
groups of Council Area. As one might expect, the Large Cities group shows
net out-migration to the rest of Scotland, and positive net migration from
overseas; and a net migration rate close to zero for UK flows. There are large
fluctuations, particularly for overseas migration.
At the other end of the urban-rural continuum, the graph for the Islands and
Remote Rural Council Areas shows a declining, and increasingly negative,
net migration rate from within Scotland, and an overseas migration rate
fluctuating around zero. Flows from the rest of the UK are the most positive,
and latterly increasing. The two intermediate groups of Council Areas show
much smaller differentiation between the three sources of migrants, all of
which have rates per 10,000 close to zero.
Figure 1.7: Net Migration from Within Scotland (WS), Rest of UK (RUK) and
Overseas (OS) by RESAS Classification of Council Area 2003-2018
Source: NRS Local Area Migration data 2018
18Designing a Pilot Rem ote and Rural Migration Schem e for Scotland: Analysis and Policy Options
Net migration rates, expressed in rates per 10,000, do not, however, give any
impression of the absolute size of in and out flows. Figure 1.8 shows that in all
four groups of Council Areas, flows from within Scotland were by far the
largest, and those from overseas the smallest. In the Islands and Remote
group, the net effect of within-Scotland migration, and migration from
overseas, were both negative. Of the three sources only the rest of the UK
had a positive impact upon total population, averaging an additional 50
persons per 10,000.
Figure 1.8: In, Out and Net Migration per 10,000 persons, 2013-18, by
Source, RESAS Classification of Council Areas
Source: NRS Local Area Migration data 2018
192 Economic and Social Context
Designing a Pilot Rem ote and Rural Migration Schem e for Scotland: Analysis and Policy Options

2.        Economic and Social Context

Population decline can have a range of negative economic and social impacts
on local communities, often contributing to a cycle of declining services and
employment opportunities, which in turn triggers further out-migration. This
chapter sets out some of the economic and labour market challenges for
remote and rural areas created by population decline (2.1) and considers the
distribution of incomes in these areas (2.2) and the impacts on public services
and local communities (2.3). The chapter ends with a discussion of different
approaches to identifying what we term ‘designated areas’: remote and rural
areas facing population decline, which would potentially benefit from a remote
and rural migration scheme (2.4).

2.1       Employment Patterns in Remote Rural Scotland

As we saw in Chapter 1, prolonged periods of natural decrease in population
and low levels of in-migration result in a shrinking population and an ageing
workforce. Such demographic change influences the balance of supply and
demand in the local economy. It both restricts the local labour supply and
leads to an increase in its average age. Population decline can also
adversely affect public service provision, through creating labour shortages in
key services. Moreover, government funding formulae for public services are
largely population driven, implying that public services will receive less
resource as people move away.

Labour markets in sparsely populated areas are particularly vulnerable to
small fluctuations in labour supply. Here it is useful to distinguish between
‘deep’ and ‘shallow’ markets. Markets are described as deep when there are
many buyers and sellers, which implies that the loss of a few buyers or sellers
would make no material difference to the operation of the market. Labour
markets in sparsely populated areas are, in contrast, extremely shallow. Small
increases or decreases in labour supply can have large effects on the viability
of the local economy. These effects may be amplified to the extent that
households are dependent on both partners working. The loss of one job may
cause both to emigrate to take up new employment opportunities. It may also
cause a loss of children to the area who would form the future labour supply.

Nevertheless, those in remote rural areas are typically more economically
active than those in the rest of Scotland, albeit by a small margin. Annual
Population Survey data for 2017 shows that 81% of adults in remote rural
areas between 16 and 64 were economically active, compared with 80% in
accessible rural areas and only 77% in the rest of Scotland. With
unemployment rates at around 4% (irrespective of geography), employment
rates in the remote rural areas stood at 78%, therefore exceeding those in the
rest of Scotland where they were 74%.

Remote rural areas are also characterised by more diverse employment
patterns than elsewhere. Self-employment accounts for 23% of employment
in remote rural areas, 18% in accessible rural and only 11% in the rest of
Scotland. The proportion of the employed in remote rural areas with a second
job, at 6%, was double the rate for the rest of Scotland. And the proportion

                                                   20
Designing a Pilot Rem ote and Rural Migration Schem e for Scotland: Analysis and Policy Options
working from their own homes comprised 24% in remote rural areas in 2017
compared with only 9% in the rest of Scotland. The share of those working
from home rose dramatically during the pandemic: this was a working pattern
with which residents of remote rural areas were already more familiar. It
remains to be seen how much of the change in working patterns persists after
the pandemic.
The occupational distribution of employment drawn from the 2017 Annual
Population Survey shows that only around 11% of those living in remote rural
areas belong to higher managerial and professional occupations, compared
with 16% in the rest of Scotland. In contrast, 18% of those employed in the
remote rural areas are small employers and own account workers. This
compares with 14% in accessible rural areas and 8% in the rest of Scotland.
Those living in Scotland’s more remote areas are more likely to work on their
own behalf, as ‘solo self-employed’.
Another aspect of the fragility of the rural economy is its lack of diversification.
The Scottish Government produces annual data on registered private sector
businesses by the six-fold rural/urban classification. Registered businesses
are those either registered for VAT (implying turnover over £85,000 as at
March 2018) or for PAYE (employing others). In 2018, registered businesses
accounted for 52% of the nearly 300,000 businesses operating in Scotland.
Most agricultural businesses do register for VAT even if their turnover is less
than £85,000, so that they can recover VAT on their input costs.
Figure 2.1 shows estimates of the share of enterprises, employment and
turnover of those registered businesses located in Scotland's remote rural
areas.12 It clearly suggests that agriculture is the dominant sector in these
areas. However, this may be misleading for the reasons alluded to above:
Scotland has almost as many unregistered businesses as registered
businesses. Unregistered businesses are likely to be relatively small and
therefore disproportionately located in remote rural areas. Figure 2.2, which
again reflects data on registered businesses, shows that even within this
group, smaller businesses are overrepresented in Scotland’s remote rural
areas.13 While 13% of employment in registered businesses in the rest of
Scotland is accounted for by enterprises with between 0 and 9 employees,
37% of remote rural area employment falls within this type of business.
It is also noteworthy that remote rural areas have a substantially smaller share
of employment (16%) in the public sector than is the case in the rest of
Scotland (24%). This is likely to reflect lower representation of parts of the
public sector where activity is centralised, such as hospitals, colleges,
universities and administrative centres, which rarely have a presence in
remote rural areas. Note that international recruitment in these parts of the
public sector is not unusual: the public sector is more likely to have processes
in place for such recruitment than would be the case among small rural
enterprises.
21Designing a Pilot Rem ote and Rural Migration Schem e for Scotland: Analysis and Policy Options
Figure 2.1: Employment by Sector and Number of Employees 2017
100%
90% 16% 15%
24%
80%
18%
70% 26%
60% 10%
12% 41%
50%
19%
40% 16%
30% 11%
20% 37% 11%
31%
10%
13%
0%
Remote Rural Accessible Rural Rest of Scotland
0-9 employees 10-49 employees 50-249 employees
250+ employees Public sector
Source: Scottish Government Rural Scotland Key Facts 2018
Figure 2.2 shows estimates of employment in registered businesses in remote
rural areas in 2017. Agriculture plays a more significant role in employing
people in remote rural Scotland than in any of the other geographic zones,
accounting for 39% of all Scottish registered enterprises in this sector.
However, total employment in food and accommodation is almost the same
as that in agriculture in registered businesses in remote rural areas. Food and
accommodation has a much larger presence than agriculture in the rest of
Scotland. This sector therefore represents a smaller share of total Scottish
employment than does agriculture in remote rural areas.
Note that these estimates derive from a census carried out each March. They
therefore do not capture seasonal variations in employment which are likely to
be more pronounced in food and accommodation than in other sectors in
remote rural Scotland. Agricultural employment in remote rural areas does not
vary seasonally in the way that it does, say, in Tayside and Angus, where
seasonal fruit picking causes large swings in employment. It is likely therefore
that employment in food and accommodation substantially outstrips that in
agriculture during the summer months. Employment in other sectors, such as
professional and scientific services, administration, education and health is,
as one would expect, relatively low and will remain so throughout the year.
22Designing a Pilot Rem ote and Rural Migration Schem e for Scotland: Analysis and Policy Options
Figure 2.2: Employment in Remote Rural Area Registered Businesses
20,000
18,000
16,000
14,000
Emplopyment
12,000
10,000
8,000
6,000
4,000
2,000
0
Source: Scottish Government Businesses in Scotland 2019
Figure 2.1 showed that businesses in remote rural areas are typically smaller
on average than those in the rest of Scotland. A different visualisation of the
same theme is shown in Figure 2.3. It shows the number of businesses per
thousand population by size of employment across Scotland is different in
rural/urban geographies.14 Remote rural Scotland has the largest
representation of enterprises with no employees. Confirming the high levels of
self-employment recorded in the Scottish Household Survey, these data show
that there is a disproportionately high level of small-scale entrepreneurship in
remote rural Scotland. Overall levels of employment are high, but the large
share of self-employment may be a form of ‘concealed unemployment’ among
the ‘solo self-employed’. The Institute for Fiscal Studies15 argues that this
group typically earn less than average employees and that this wage gap has
widened over time. Moreover, a large proportion of the solo self-employed are
underemployed – they would prefer to work more hours, but there is
insufficient demand to warrant extending their working time. Remote rural
areas also have the highest share of enterprises with 1-4 employees.
Population decline can also adversely affect public service provision, through
creating labour shortages in key services. Moreover, government funding
formulae for public services are largely population driven, implying that public
services will receive less resource as people move away, which can then
further accelerate economic and population decline.
23Designing a Pilot Rem ote and Rural Migration Schem e for Scotland: Analysis and Policy Options
Figure 2.3: Number of Enterprises by Size per Thousand Population by
Rural/Urban Geography
Source: Scottish Government Businesses in Scotland 2018
We found evidence of labour shortages in responses to the EAG survey
conducted in 2019 for our report on internal migration in Scotland and the
UK.16 Local authorities in remote and rural areas noted difficulties for a range
of employers in attracting and retaining suitably qualified staff. This was
affecting both private and public sector employers, although the industries and
kinds of vacancies most affected vary between areas. At a more local level
still, local authorities, including both Shetland and Argyll and Bute, reported
that within their area more remote communities or remotely located
businesses, such as hotels or processing plants, struggled the most. 17
Shetland Council’s most recent employment survey, conducted in 2017, found
that over 20% of employers reported difficulties with filling vacancies. 18 This
issue was particularly acute in manufacturing (food and drink processing,
engineering, textiles and crafts) and construction, but also affected public
services. The Council noted long-term difficulties filling vacancies in health
and social care and NHS Shetland’s Workforce Plan Update 2019-2020
highlighted posts for consultants and senior nurses vacant for six months or
more.19 The Workforce Plan also notes augmented pressure on services due
both to increased demand linked to ageing of the local population and to
difficulties maintaining supply as the workforce ages. In certain specialisms
ageing of the workforce is an acute concern: 53% of nurses and midwives for
example are aged 45 and above and 40% are over 50 years old. 20 The report
24Designing a Pilot Rem ote and Rural Migration Schem e for Scotland: Analysis and Policy Options
also notes that some services especially in more remote communities, rely on
a single practitioner or specialist, making them particularly vulnerable.
Argyll and Bute also reported ‘significant skills gaps and unfilled vacancies in
areas such as health and social care, where demand is increasing as the
population ages’.21 Moreover, a 2019 survey of the tourism and food and drink
industries revealed significant recruitment issues across both industries, with
40-50% of employers reporting difficulties filling posts either due to a lack of
applicants or a lack of suitably skilled applicants. Senior managerial and
operational roles were reported as particularly hard to fill and the tourism
sector also specifically noted problems recruiting and retaining chefs, other
kitchen and waiting staff.22 Since those employees who were successfully
recruited to and retained in such posts were often EU nationals, there were
further concerns about how the end of free movement would exacerbate
these trends.
These difficulties reflect the shallowness of the labour markets in remote rural
areas. Employment rates are very high, but many are employed in small scale
enterprises associated with agriculture or food and accommodation. There is
no readily available pool of labour to fill vacancies in other sectors: such
vacancies are therefore likely only to be met from migrants who must assess
the costs of moving in respect of income, housing and movement costs and
(possibly) partner’s employment.
2.2 Incomes
We now consider incomes across remote rural areas of Scotland. This is
important both for understanding the local economy, but also the potential to
attract migrants to work in key sectors and occupations in remote and rural
areas. Our main data source is the Annual Survey of Hours and Earnings
(ASHE) collected by the Office for National Statistics provides accurate
estimates of national employee earnings. However, for relatively small areas,
mean or median annual earnings cannot be estimated precisely because
sample sizes are relatively small.
Hourly earnings in remote rural Scotland are lower than in the rest of the
country. ASHE data analysed by the Scottish Government shows median
hourly pay (based on residence) is £12.95 in remote rural Scotland. This
compares with £15.09 in accessible rural areas and £13.79 in the rest of
Scotland (see Figure 2.4). Similar differences emerge for both males and
females. However, this is largely a compositional effect. Median annual
earnings for full-time workers in rural areas are around 3.3% less than those
in the rest of Scotland, while hourly earnings for all employees lagged by
6.1%. The larger share of part-time employment in the remote areas explains
the greater differential between earnings for all workers compared with those
for full-time workers. Focussing on full-time wages for employees gives a very
partial view of the remote rural labour market because full-time employees
constitute a smaller proportion of the labour market than is the case for the
rest of Scotland.
25Designing a Pilot Rem ote and Rural Migration Schem e for Scotland: Analysis and Policy Options
Figure 2.4: Median Hourly Earnings in Remote Rural, Accessible Rural and
the Rest of Scotland
£16.00 £15.50
£15.09
£14.22 £14.52
£13.79
£14.00 £13.21 £13.25 £12.95
£12.44
£12.00
£10.00
£8.00
£6.00
£4.00
£2.00
£0.00
Male Female All
Remote Rural Accessible Rural Rest of Scotland
Source: Scottish Government, Rural Scotland Key Facts 2018
Median annual earnings for full-time employees in remote rural Scotland were
estimated at £27,188 per annum in 2017. Although, as already noted, this
estimate lies below that for the rest of Scotland, it suggests that more than
half of all full-time employment in remote rural Scotland pays above the
Skilled Worker route earnings threshold of £26,500 per annum. Data from the
Scottish Household Survey suggest that the distribution of income in remote
rural areas is closer to that of the rest of Scotland, then it is to Scotland’s
accessible rural communities. The most striking example is that while 22% of
highest income householders in remote rural Scotland earned more than
£40,000 per annum and the corresponding proportion for the rest of Scotland
is 21%, the proportion earning more than £40,000 in accessible rural areas is
30%. High income householders in Scotland prefer to live in accessible rural
areas rather than in urban centres or remote rural areas. Accessible rural is
desirable for high earners who can commute to urban centres. The time and
transport costs of accessing high-paying urban jobs from Scotland’s remote
rural areas has tended to be an almost insurmountable obstacle to this form of
commuting. The pandemic may have changed this calculation somewhat,
given the substantial increase in home working that it has caused.
The ASHE data can also be disaggregated by travel to work area (TTWA).
TTWAs do not directly align with measures of rurality. Instead, TTWA
boundaries are derived from commuting patterns: they capture areas within
which 75% of journeys to work take place. This may be relevant for migration
policy if these are employer-based without a residence requirement. Workers
will seek accommodation within what they considered to be feasible travel to
work distances, and these are more likely than not to be within the relevant
TTWA (we discuss TTWAs further in 2.4).
26Designing a Pilot Rem ote and Rural Migration Schem e for Scotland: Analysis and Policy Options
Figure 2.5 shows median gross annual earnings for full-time employees in
2020 by Scottish TTWA. (More up-to-date earnings data is available on
TTWAs from ASHE than on remote rural Scotland). It shows that for most
TTWAs, median annual earnings are above the Skilled Worker route
threshold of £26,500. Those were median earnings are below the threshold
are concentrated in rural areas, though it is not easy to determine how far
these overlap with our remote rural areas. However, where the median lies
close to the threshold, migrants would not be eligible for around half of the
full-time jobs available within the TTWA.
These data focus on full-time workers. Our earlier analysis shows that full-
time work is less common in remote rural areas. Instead, part-time work,
double jobbing and self-employment are much more common than in
Scotland as a whole. These are manifestations of weakness in the local
labour market and likely also to be a major cause of emigration from these
areas.
Figure 2.5: Median Gross Annual Earnings for Full-time Employees by TTWA
2020
Thurso
Orkney Islands
Shetland Islands
Peterhead
Inverness
Stranraer
Glasgow
Aberdeen
Edinburgh
Arbroath and Montrose
Mull and Islay
Ayr
Livingston
Dumbarton and Helensburgh
Motherwell and Airdrie
Kilmarnock and Irvine
Dunferml ine and Kirkcaldy
Girvan
St Andrews and Cupar
Falkirk and Stirling
Elgin
Not Classified
Perth
Dundee
Greenock
Alness and Invergordon
Galashiels and Peebles
Western Isles
Dumfries
Fraserburgh
Berwick
Hawick and Kelso £26,500
Lochgilphead
Aviemore and Grantown-on-Spey
£0 £5,000 £10,000 £15,000 £20,000 £25,000 £30,000 £35,000 £40,000
Source: Office for National Statistics Annual Survey of Hours and Earnings 2020
As we have already seen, agriculture is one of the two most important sectors
in remote rural areas. It is heavily dependent on subsidy. Eligibility for subsidy
is contingent on location. The most generous subsidies are available in ‘Less
Favoured Areas’. The map of these areas is shown in Figure 2.6.
27You can also read