Development and Deployment of a Framework to Prioritize Environmental Contamination Issues - MDPI
←
→
Page content transcription
If your browser does not render page correctly, please read the page content below
sustainability

Article
Development and Deployment of a Framework to
Prioritize Environmental Contamination Issues
Nicholas D. Kim 1 , Matthew D. Taylor 2 , Jonathan Caldwell 2 , Andrew Rumsby 3 ,
Olivier Champeau 4 and Louis A. Tremblay 4,5, *
 1    School of Health Sciences, Massey University Wellington, P.O. Box 756, Wellington 6140, New Zealand;
      n.kim@massey.ac.nz
 2    Waikato Regional Council, P.O. Box 4010, Hamilton East, Hamilton 3247, New Zealand;
      matthew.taylor@waikatoregion.govt.nz (M.D.T.); jonathan.caldwell@waikatoregion.govt.nz (J.C.)
 3    EHS Support, PO Box 15887, New Lynn, Auckland 0640, New Zealand; andrew.rumsby@ehs-support.com
 4    Cawthron Institute, Private Bag 2, Nelson 7042, New Zealand; olivier.champeau@cawthron.org.nz
 5    School of Biological Sciences, University of Auckland, P.O. Box 92019, Auckland 1142, New Zealand
 *    Correspondence: louis.tremblay@cawthron.org.nz; Tel.: +64-3-539-3290

 Received: 23 September 2020; Accepted: 10 November 2020; Published: 11 November 2020

 Abstract: Management and regulatory agencies face a wide range of environmental issues globally.
 The challenge is to identify and select the issues to assist the allocation of research and policy resources
 to achieve maximum environmental gain. A framework was developed to prioritize environmental
 contamination issues in a sustainable management policy context using a nine-factor ranking model
 to rank the significance of diffuse sources of stressors. It focuses on contamination issues that
 involve large geographic scales (e.g., all pastoral soils), significant population exposures (e.g., urban
 air quality), and multiple outputs from same source on receiving environmental compartments
 comprising air, surface water, groundwater, and sediment. Factor scores are allocated using a scoring
 scale and weighted following defined rules. Results are ranked enabling the rational comparison of
 dissimilar and complex issues. Advantages of this model include flexibility, transparency, ability to
 prioritize new issues as they arise, and ability to identify which issues are comparatively trivial and
 which present a more serious challenge to sustainability policy goals. This model integrates well as a
 planning tool and has been used to inform regional policy development.

 Keywords: diffuse contamination; environmental management; priority ranking; local government;
 air pollution; stormwater; anthropogenic stressors; agricultural runoff; New Zealand; geothermal

1. Introduction
     Regulatory agencies around the world face a wide range of environmental contamination issues.
Territorial agencies must choose between issues when deciding where research and policy resources
will be allocated with so many chemicals entering our natural environment [1]. Resources will always
be limited. Ideally, they should be allocated in proportion to the seriousness of each issue in relation to
policy goals. A ‘contaminant’ is defined as something that is out of place in an ecosystem, either because
it does not occur naturally, or because it is present at significantly higher than natural background
levels. A contaminant is regarded as a ‘pollutant’ when its concentration has become high enough
to interfere with natural processes to produce one or more undesirable effects. Pollution of air, soil,
water, or sediments can cause a wide range of sustainability problems. For example, accumulation of a
trace metal in agricultural soils may cause one or more of the following: direct toxicity (to microbes,
invertebrates, plants, grazing animals or wildlife), changes to soil chemistry, contamination of local
ground water, non-compliance with food standards, increased dietary intakes in humans, accumulation
in nearby river and lake bed sediments, and toxicity to aquatic ecosystems.

Sustainability 2020, 12, 9393; doi:10.3390/su12229393                      www.mdpi.com/journal/sustainability
Sustainability 2020, 12, 9393 2 of 23
There are multiple sources of contaminants. Point source industrial discharges are often subject
to site-specific controls which have led to major improvements in the quality of waste discharges.
However, there has been less progress in managing multi-source or wide-scale contamination diffuse
pollution sources. Diffuse pollution has been defined as: ‘pollution arising from land use activities
(urban and rural) that are dispersed across a catchment or sub catchment, and do not arise as a
process industrial effluent, municipal sewage effluent, deep mine or farm effluent discharge’ [2].
Although useful as a guide, the exclusions in this definition mean that it does not match all contexts:
for example, in New Zealand, farm effluent discharges are recognized as a major source of diffuse
pollution. Urban stormwater is widely recognized as a major diffuse source of pollutants released in the
urban environment that contribute to the deterioration of receiving water bodies [3]. The intensification
of agricultural activities results in another important diffuse source of anthropogenic contaminants
in agricultural soils due to the use of significant quantities of fertilizers and pesticides to optimize
production and achieve food security targets [4,5]. Atmospheric deposition is another key source
facilitating the transport and dispersion of pollutants and materials in the atmosphere either through
precipitation or deposition in dry weather [3,6,7].
All sources of non-point and widespread pollution are complex problems and constitute a major
challenge for environmental regulators and policymakers globally [8]. The management of diffuse
contamination is challenging as it results in the discharge of mixtures of multiple compounds in
environmental media [9]. One of the major challenges of assessing the risk of complex environmental
mixtures is the identification of those chemicals that contribute significantly to observed effects. Methods
such as effect-directed analysis can assist to establish the corresponding cause–effect relationships and
provide focus for potential management measures [10,11].
This study presents the development and validation of a framework to prioritize 117 environmental
contamination issues in the Waikato region of New Zealand from a sustainable management policy
context. The focus is on contamination issues that involve large geographic scales (e.g., all pastoral
soils), significant population exposures (e.g., urban air quality), or multiple instances of the same source
(e.g., 8000 former sheep-dip sites). Such issues are not managed under specific discharge consent
provisions but may be subject to current or future regional planning rules. Outcomes of the results
are discussed in relation to their implementation by staff of the relevant government organization
for environmental protection (Waikato Regional Council) to decide research priorities and inform
policy development.
2. Materials and Methods
2.1. Study Area
The Waikato region covers a 25,000 km2 area and is predominantly rural with significant natural
geothermal areas with a population over 458,000. Dominant rural activities and their approximate land
areas are pastoral farming (dairy, beef, and sheep: ~1,430,000 ha), plantation forestry (~330,000 ha),
and horticulture (~10,000 ha over the top 10 crops) [12].
2.2. Development of the Framework
2.2.1. Identification of Contamination Issues
Although many disparate environmental contamination issues are known, it is common for each
these to be considered individually and on a case-by-case basis, often only after a trigger has been
reached. As a first step, any systematic attempt to prioritize environmental contamination issues
requires the opposite approach: a rational method to identify and capture known and potential
contamination issues in a single list, irrespective of external interests or preconceptions. The first
step was to develop a broad and ‘reasonably comprehensive’ inventory of contamination issues for
the study area (New Zealand’s Waikato region). Then source categories were linked with the mainSustainability 2020, 12, 9393 3 of 23
environmental compartments where substances can accumulate including air, soil, groundwater,
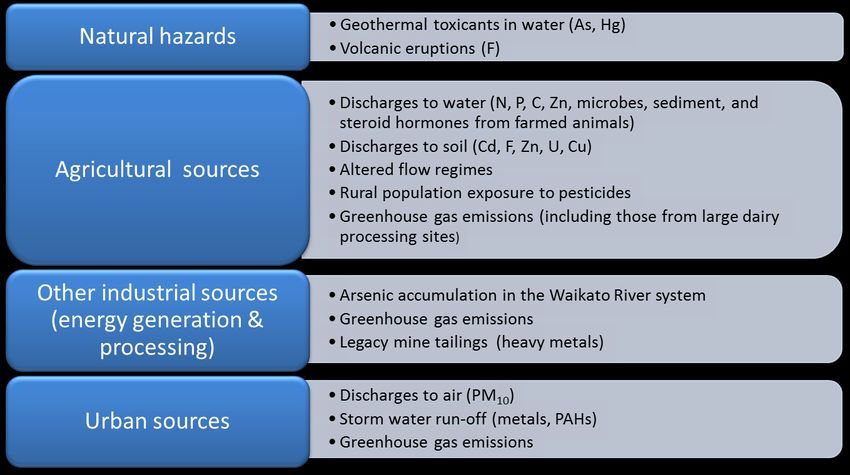
surface water, and sediment. A list of natural (26) and anthropogenic (38) sources was compiled that
may result in contamination of different environmental compartments (Table 1).
This ‘source category and discharge’-based approach was taken on the basis that all types of
environmental contamination require a source, and most sources involve a discharge—i.e., a transfer
of contaminants from the source to one or more environmental compartments. Each of the 64 source
categories was assigned a two-letter code, number, and short description as shown in Table 1. The first
letter in these codes denotes the recipient environmental compartment (A = air, S = soil, G = groundwater,
W = surface water and bed sediments) the second letter (N or A) whether the contamination is of natural
or anthropogenic origin, and the number and description distinguish between different sources within
a given category. For many contamination issues, significant movement occurs between environmental
compartments, e.g., a contaminant discharged to air may subsequently deposit on soil. These links
were recorded in issue descriptions.
Use of this source-list enabled a systematic approach to developing an inventory, through
consideration of known or suspected contamination issues applicable to each source category in turn.
Environmental chemistry expertise and familiarity with the study area was required for this step,
with some judgments made about which issues were trivial enough to be safely excluded at the early
stage. The resulting list comprised 117 known and potential environmental contamination issues of
possible significance, with each one being identified by its source category code (Table 1), an additional
numeral and a short description. To avoid duplication, this is not shown as a single list because the
issues identified are all shown in the ranked results presented for each environmental compartment
(Table 2, Tables S2 and S3).
Some source categories had no known significant instances of contamination linked to them,
whereas others had several. The number of issues identified for each compartment were air: 28, soil: 44,
groundwater: 23, and surface waters and bed sediments: 29. Although this inventory was developed
for the Waikato region of New Zealand, most of the potential or known contamination issues would
also apply to other predominantly rural regions around the world. Others occur in specific areas
around the world where the sources are prominent, for example potential for arsenic and mercury
contamination is commonly associated with natural geothermal systems as seen in Iceland, Japan and
parts of the US.
The inventory developed in this work should not be viewed as comprising all known and potential
contamination issues within the study region. Rather, as new concerns are identified, they can readily
be added under an appropriate source code and ranked to determine their relative priority within the
larger set, as discussed below. This approach would be preferable to a common situation that occurs,
where newly identified concerns can take on an artificial importance, causing unnecessary diversion of
institutional resources away from more significant resource management problems.
A structurally and philosophically unique feature of this model (compared with other risk
assessment methodologies) is the ground-up baseline assumption that every instance of diffuse
contamination to any environmental compartment is caused by a discharge, or source, of the
contaminant to that compartment; and that such source may be either natural or anthropogenic.
Creating a baseline framework using these concepts (Table 1) provides for a comprehensive coverage
of all broad source categories without initially having to know the identities and natures of every
discharge. This approach has the benefits of forcing expert consideration of discharges that may
exist within each broad category, leading to early inclusion of potentially important sources that
would normally be omitted; providing for natural as well as anthropogenic contamination sources;
and making it easy to add new issues within the pre-existing framework as they are identified or arise.Sustainability 2020, 12, 9393 4 of 23
Table 1. Natural and anthropogenic source categories of substances in air, soil, groundwater, and surface waters and their bed sediments.
Environmental
Natural Source Code and Category Anthropogenic Source Code and Category
Compartment.
AN1 Synthesis in the atmosphere AA1 Industrial point-sources
AN2 Entrainment of crustal material AA2 Fossil-fuel combustion
AN3 Entrainment of oceanic salts AA3 Solid-fuel combustion
AN4 Biogenic emissions from living plants AA4 Pollens from pastoral grasses, plantation forestry, urban trees, etc.
AN5 Dispersion of native plant pollens AA5 Aerial topdressing or spreading of fertilizers
AN6 Volatilization from soils AA6 Increased entrainment of crustal material after land clearance
AN7 Volcanoes and geothermal areas AA7 Use of pesticide sprays or fumigants
Air
AN8 Wild forest fires AA8 Natural substances associated with farming of animals
AN9 Global distillation AA9 Weapons testing or use
AN10 Cosmic dust AA10 Long-range pollutant transport
AN11 Gases generated through biological processes AA11 Waste incineration
AA12 Greenhouse gases released through combination of sources AA1,
AA2, AA3, AA7, AA8 and AA11
AA13 Smoking
AA14 Indoor sources
SN1 Weathering of parent rocks and minerals SA1 Anthropogenic discharge to air followed by wet or dry deposition
SN2 Wet or dry deposition, preceded by any of the natural sources
SA2 Use of soil treatments on land
to air
SN3 Sorption from groundwater or geothermal springs SA3 Use of pesticides (herbicides, insecticides, fungicides)
SN4 Concentration through biogenic or physical processes SA4 Use of plant supplements, veterinary medicines, or animal remedies
SN5 In situ generation through microbial or abiotic processes SA5 Excretion of natural substances from farmed animals
Soil
SN6 Degradation of complex organic material SA6 Sorption from irrigation water
SA7 Loss of natural substances from exotic plants
SA8 Fixation from air or water by exotic species
SA9 Deposition to soil at industrial sites through spills, storage, local air
discharge, or inappropriate disposal
SA10 Weathering, ablation or renovation of human artifacts
SA11 Release associated with mining activities or removal of overburden
SA12 Creation of landfills, monofills or hazardous waste repositories.Sustainability 2020, 12, 9393 5 of 23
Table 1. Cont.
GA1 Discharge to groundwater, preceded by any of the anthropogenic
GN1 Geothermal discharges into groundwater
sources to soil
Groundwater GN2 Leaching, preceded by any of the natural sources to soil GA2 Alteration of the groundwater environment
GA3 Direct discharge into ground
GA4 Fracking and underground gasification of coal
WN1 Losses from stream beds and banks WA1 Losses from stream beds and banks
WN2 Surface runoff from land WA2 Anthropogenic discharge to air followed by wet or dry deposition
WA3 Inputs of contaminated surface runoff, preceded by any of the
WN3 Direct inputs of groundwater
Surface waters and bed anthropogenic sources to soil
sediments WA4 Inputs of contaminated groundwater, preceded by any of the
WN4 Geothermal systems
anthropogenic sources to groundwater
WN5 Wet or dry deposition, preceded by any of the natural
WA5 Direct discharge to water from industrial point-sources
sources to air
WN6 In situ generation through microbial or abiotic processes WA6 Urban storm water runoff
WN7 Degradation of complex organic material WA7 Altered physical or biogeochemical processes
WA8 Discharge to water through spills, weathering, ablation or renovation
of human artifactsSustainability 2020, 12, 9393 6 of 23
Table 2. Basic structure of the nine-factor model used to score and rank the significance of diffuse
contamination issues.
Factor Highest
Factor Scoring Scale
Weighting Possible Score
1. Scale—geographic or size of exposed population 1 to 5 2 10
2. Accumulation capacity 1 to 15 1 15
3. Reversibility 0 to 5 1 5
4. Human health—potential for chronic harm 0 to 5 3 15
5. Human health—potential for serious acute harm 0, 2.5, or 5 1 5
6. Environmental impact 0 to 5 2 10
7. Impact on animal welfare and production 0 to 5 2 10
8. Harm to trade 0 to 5 1 5
9. Reduction in land use flexibility 0 to 5 1 5
Identification of the individual discharge types within each source category was undertaken
by expert practitioners with expertise in air, soil, surface and groundwater quality monitoring,
environmental chemistry, chemical contamination, resource allocation, and regulatory compliance.
The systematic approach taken was to (a) record instances of diffuse contamination within each source
category (Table 1) that were already known or were suspected, (b) identify additional possibilities by
examining the extent to which each of the major natural and anthropogenic source categories (Table 1)
are operative within the biogeochemical, physical and resource use contexts set by the Waikato region
(e.g., “natural generation of the greenhouse gases NH4 and N2 O from wetlands” has ceased to be a
diffuse contamination issue as nearly all wetlands in the Waikato region are impacted by drainage,
but this drainage of wetlands has created a new issue “Release of CO2 from drained wetlands”),
and (c) exclude potential sources that were so localized, transient (e.g., the appearance of 109 Cd in New
Zealand rainwater from Pacific Islands atomic weapons testing) or minor that it is very unlikely they
would be capable of causing diffuse contamination in the first place, or inducing more than minor
adverse effects.
2.2.2. Ranking Approach
Environmental contamination issues vary widely in their reach and consequences. However, in
a sustainability context it is reasonable to define the most serious issues as those of the largest scale,
which grow worse over time, exert deleterious effects (to humans, ecosystems, productive capacity,
an economy, or resource capacity) and are irreversible. The ranking model of this framework is based
on scores and weightings given to nine factors which capture these ideas. The basic structure of the
ranking model is summarized in Table 2 and Table S1 and outlined further below.
In Table 2, the ‘Scoring scale’ was the only component that was ranked. For each factor and issue,
a score was independently assigned, by each of four experts. The recommended approach was for each
expert to assign scores to one factor at a time (across all issues), then sort those from highest-to-lowest
to verify that they were comfortable with how each issue scored relative to the others. For each issue,
the arithmetic average of each score from the four experts was then used in subsequent calculations.
It was found that in general, scores assigned by different experts resulted in the same (or very similar)
high-to-low placements, despite differences in the absolute values assigned. This gave some confidence
in the reproducibility of the ultimate rankings.
• Factor 1. Scale
Scale can be considered in two ways: geographic area, and for human exposures, the population
exposed. Scale of an issue was allocated a score of 1 to 5 based on calibration points shown in Table S1.
Scores for scale were given a factor weighting of 2, providing a maximum possible score of 10 (Table 1).Sustainability 2020, 12, 9393 7 of 23
• Factor 2. Accumulation capacity
There are three ways by which substances, or the harm they could cause, may accumulate: (a) the
substance accumulates in the environmental compartment of interest over time, (b) the substance
pools in an area from multiple sources, or (c) potentially harmful effects of long-term exposure are
cumulative. Accordingly, this factor was characterized using three sub-components (outlined below),
each of which was allocated a score from 1 to 5.
For progressive accumulation within an environmental compartment to achieve a high score,
three aspects had to be satisfied: the contaminant is routinely added, the majority added is retained,
and the relative concentration increase is significant. Two such examples of progressive accumulation
are fluorine accumulation in phosphate-fertilized soils, and carbon dioxide accumulation in the
global atmosphere.
Accumulation caused by pooling of an otherwise transient contaminant occurs for some air and
water discharges. Pooling in this context is where environmental conditions cause accumulation of
a contaminant discharge which would ordinarily disperse. For example, air pollutants from wood
burned for domestic home heating can pool as a result of calm conditions or a thermal inversion layer.
Winter air pollution is a significant problem in cities and towns of the Waikato region, home heating
can be responsible for up to 90% of total particulate matter less than 10 microns in diameter (PM10)
and 91 percent of PM2.5 on winter days [13–15]. Vehicle emissions are also a source of hazardous air
pollutants, but with pooling being more localized to areas around major traffic corridors.
A higher accumulation score was also applied if potentially harmful effects of long-term exposure
would be cumulative. Some substances may accumulate in the body with age until they pass toxic
thresholds, and others can cause incremental damage which progressively increase disease risk.
Accumulation of damage can occur through exposure to carcinogens (e.g., indoor radon, arsenic in
drinking water, asbestos) or neurotoxic agents (e.g., many pesticides, solvents). Scoring included
consideration of bioaccumulation and biomagnification where these processes were thought to be
contextually and toxicologically relevant.
These three components of accumulation are relatively independent, and scores were therefore
added, which (with no extra weighting applied) gave a maximum possible score for Factor 2 of 15
(Table 2).
• Factor 3. Reversibility
Partnered with accumulation potential, reversibility denotes the capacity for an environmental
compartment to return to its natural state once a source of contamination is removed. Contamination
of urban air with polycyclic aromatic hydrocarbons from diesel fumes is reversible over time through
various dilution processes. By contrast, anthropogenic carbon dioxide emissions are less reversible,
because carbon dioxide has a long atmospheric residence time. Trace metal contamination of soils
and lakebed sediments is persistent, whereas many xenobiotic organic compounds (e.g., most modern
synthetic pesticides) degrade. Reversibility was scored from 0 to 5 with calibration points as shown
in Table S1. Within this factor a high score of 5 would imply that even if sources were removed,
the attained level of contamination would be maintained in that environmental compartment for a
long time, e.g., years to decades. Conversely, at the other end of the scale a score of 0 implies that the
contamination of that compartment is readily reversible once the source is removed.
• Factors 4 and 5. Potential harms to human health
Protection of human health is a universally important policy goal reflected in legislation, planning
rules and case-law. Harm to human health can occur through two distinct mechanisms, and so was
addressed in the model through use of two factors (Table 2 and Table S1).
Chronic harm (Factor 4) can occur through long-term exposure and is typically at a low level
but often across many people. This factor which was scored from 0–5 depending on the likelihood ofSustainability 2020, 12, 9393 8 of 23
exposure and nature of potential harm: from no impact to a likely impact on most exposed people
(Table S1). Acute harm (Factor 5) occurs through short-term high dose exposures, and in environmental
settings this possibility mainly applies to toxic gases. Exposure to high levels of hydrogen sulfide (H2 S)
gas has been linked with 10 human fatalities in the New Zealand geothermal resort town of Rotorua
since the 1930s, and accidental carbon monoxide poisoning is a routine cause of fatalities around
the world. Unlike chronic harm, serious acute harm does not require the progressive accumulation
or the accumulation of damage, although localized pooling may be involved. It is infrequent and
may involve few people, but when it occurs its consequences can be severe for individuals affected.
Instances of contamination with capacity to cause acute harm did not necessarily show high scores for
other factors. Acute harm was therefore added as a separate factor (Factor 5) to ensure its potential
significance was reflected in the final rankings. Potential for a contamination issue to cause acute harm
was allocated a score of 0, 2.5 or 5 based on descriptions shown in Table S1. The possibility of fatality
occurring was assessed based on toxicology and likely exposure pathways, within the regional context.
With weightings applied (Table 2) the two human health factors (Factors 4 and 5) gave a maximum
possible score of 20.
• Factor 6. Environmental impact
Factor 6 reflects potential for the contamination issue to harm ecological receptors: soil organisms
(microbes, invertebrates, plants), aquatic organisms, wildlife and higher animals, and ecosystem
functioning as a whole. This potential was ranked on a scale of 1–5 with guidance notes as in
Table S1. A mid-score of score of 2.5 was given for either (a) a likely impact on some organisms in
the ecosystem based on toxicological considerations and experience, or (b) existence of plausible
mechanisms supporting a possible impact on most organisms in an ecosystem. Factor 6 was allocated
a weighting of 2, giving a maximum possible score of 10 (Table 2). This ensured that environmental
harms were not understated relative to policy objectives through dilution against other factor scores.
• Factors 7 and 8. Production and trade
These factors were ranked on a scale of 0–5 (Table 2) and are relevant to policy goals supporting
sustainability of the regional economy. Trade was considered to be a separate factor to production
because several contamination issues of negligible impact on production can have a negative impact
on international trade. Presence of specific pesticide residues in food exports may cause a ban on
importation in recipient countries, through quantified risks, perceived risks, or for political reasons.
For trade a score was allocated based on the potential for the existence of the contamination issue
to harm trade, irrespective of the mechanism or motive. Scores for animal welfare and production,
and trade, were given weightings of 2 and 1 respectively (Table 2), giving a maximum possible score
for these two related factors of 15.
• Factor 9. Reduction of land use flexibility
Some contaminants have the capacity to contaminate land to a degree that reduces its inherent
range of viable uses, e.g., a contaminated industrial site may have become unsuitable for residential
use without expensive site remediation. Metal accumulation in some pastoral farms may reach levels
where if the land use changes to horticulture, vegetables grown in the soil would exceed food standards.
Loss of land use flexibility contrasts with policy goals. New Zealand legislation [16] states a purpose of
safeguarding the life-supporting capacity of land and soil resources including their capacity to sustain
economic activity. Subsidiary regional policy seeks to prevent contamination from causing a reduction
in land use flexibility. This issue was addressed independently because it was not specifically captured
in other factors. Capacity of a contamination issue to restrict future uses (Factor 9) was allocated a
score of 0, 2.5 or 5 (Table 2).Sustainability 2020, 12, 9393 9 of 23
2.2.3. Scoring and Allowing for Cross-Compartment Spread
Factor scores for each of the 117 contamination issues were allocated by the authors individually
and by consultation, based on experience with environmental contamination issues and familiarity with
the specific regional context. Recording of scores and calculations were carried out by spread sheet.
The approach outlined above initially generates sustainability scores for environmental
contamination issues as they apply within the air, soil, groundwater, freshwaters, and bed sediments
environmental compartments (Table S2). These divisions are useful because they broadly match the
corresponding structure for research and policy development work areas currently used at the Waikato
Regional Council. However, many significant contamination issues spread between environmental
compartments, and a discharge that contaminates air, soil and water could be more important than a
discharge that reaches only one of these. For these reasons, a single integrated priority list was also
developed, in which issues that affected two or more compartments, or were traceable to a single
source, were grouped back into their own parent issue. This was done by selecting and combining
scores manually for issues involving significant cross-compartmental spread (Table 3).
The following rules were applied:
1. For facets of an issue relating to the same environmental compartment, we took the score for the
most relevant facet or the average score. This avoided artificial inflation of the score of a parent
issue that could occur in cases where several sub-components had been individually scored;
2. When merging facets of a single wider issue relating to the different environmental compartments,
we summed the scores. This gave appropriate numerical credit for inter-compartmental spread
of the impacts;
3. Some issues traceable to a single parent source were simply redefined in that way and re-scored,
as described for the parent category ‘inorganic contaminants phosphate fertilizers’ below.
Examples of the application of these rules to give cross-compartment scores are provided in
Appendix A.
2.3. Addressing Bias
Bias may be introduced through differences in personal understanding of the scope or effects of
each issue. Fortunately, in a relative ranking system the raw score for each factor is less important
than where it sits in relation to other factor scores. As a check on appropriate placing, scores for
each factor were sorted from high to low, and then compared with nearby scores for other issues.
This helped to ensure that individual factor scores for each contamination issue were appropriately
placed relative to those recorded for similarly scored issues. More broadly, the ranking approach could
be anthropocentric (Table 2). We argue that statutes and policies also reflect the same human values.
The stated purpose of New Zealand’s principal environmental protection legislation [16], ‘to promote
the sustainable management of natural and physical resources,’ is also anthropocentric. A strength of
the modeling approach is that it provides a systematic process and auditable record of decision making.
Individual factor scores are shorthand account professional judgments that have been made at a specific
point in time. Review of factor scores offers an easy way to determine the reasons why one issue
has been ranked more highly than another. In addition, scores and factor weightings can readily be
revisited, and new issues can be prioritized in a consistent way, as knowledge develops. This contrasts
with the common approach where the reasons behind prioritization decisions are unknown or obscure.
3. Results and Discussion
This framework was designed to provide an interface between science and policy as a mean to
assign limited resources against the most significant risks (Russell & Gruber 1987). An important feature
of the framework is to be robust and objective as the ranking of risks can be influenced by subjectivity
and reflect social, cultural, and moral acceptability values (Haynes et al., 1993). There are three keySustainability 2020, 12, 9393 10 of 23
differences that can be made between this ranking model and traditional source-pathway-receptor
Environmental Impact Assessments (EIAs):
(1) The framework of this model is all-encompassing, in the sense that it first sets out a comprehensive
list of discharge-based source categories within which any specific environmental contamination
issue can be allocated. This approach: (a) provides for the holistic treatment of diffuse
contamination issues within a geographic area; (b) avoids predetermination about which issues will
be considered (traditional approaches can be biased at the outset by only considering contamination
issues that have already been recognized as policy or political priorities), and (c) allows for
inclusion of both natural and novel contamination issues (such as environmental contamination
caused by geothermal arsenic, or allergenic pollens from exotic tree species in urban areas).
This framework also sets a basis for rapid scoring and placement of new issues as they arise,
and accommodation of cross-compartmental flows.
(2) The model is designed to work at the interface between policy and science. A core objective
was to ensure that the methodology could not become bogged down in mathematical modeling,
lost in uncertainties, or paralyzed by the qualitative differences that may exist between two or
more diffuse contamination issues—or have to necessarily wait for the results of research that may
be years in the future (uncertainties of this type instead form part of the identified risk profiles).
The ranking approach used in this model is in fact intentionally devoid of more detailed types
of quantitative calculations (for example fugacity modeling, within and between compartment
flows, toxicological parameters) which characterize conventional approaches. This makes it
possible to prioritize all issues for an entire region or even a country within the one framework,
revisit any issue or the complete ranking that at any time, and derive individual rankings in a
timely manner. In this sense the model should be seen as more of an advanced triaging process,
rather than an EIA-based model or Delphi-type assessment (Lee et al., 2019). It allows for
differences in our characterization and understanding between issues and does not predetermine
which issues will be included based on prior concern or knowledge. Once top issues are identified,
research (including EIA) and policy resources can then be more efficiently devoted to those issues.
Each factor in the model represents a policy aspect of issue and harm characterization. We would
argue that this type of tool—which forces coherent and systematic thinking aligned to pre-selected
policy priority factors—is what many regulatory agencies have been missing. Decisions about
policy and spending priorities are made every day, but in the absence of a systematic framework
many of these are based more on public concern and political visibility of an issue than its risks to
human or environmental health and/or sustainability goals.
(3) The framework is specifically designed to return higher scores for diffuse contamination issues
which pose the greatest threats to sustainable management of natural and physical resources, as
defined in New Zealand’s Resource Management Act (1991) under which its regional councils
operate. Under that Act the term ‘sustainable management’ is defined as managing the use,
development, and protection of natural and physical resources in a way, or at a rate, which enables
people and communities to provide for their social, economic, and cultural well-being and for their
health and safety while (a) sustaining the potential of natural and physical resources (excluding
minerals) to meet the reasonably foreseeable needs of future generations; and (b) safeguarding
the life-supporting capacity of air, water, soil, and ecosystems; and (c) avoiding, remedying,
or mitigating any adverse effects of activities on the environment. This sustainability focus,
defined in this way, means that the model allows for issues such as the impact of the ongoing
contamination issue on the sustainability of productivity, continuance of trade, and potential
economic impacts to be considered. This again differs from other ranking models where the
priority may more often be based on mitigating or reducing point-in-time risks to human and
ecological health, and the longer term sustainability context view may be inadvertently part of
the picture but often takes a back seat. This is not to say that other models do not also rank some
of the top issues as this one does, but in this model the sustainability focus is quite intentional.Sustainability 2020, 12, 9393 11 of 23
3.1. Individual Compartment Rankings
Scores for 117 environmental contamination issues relating to air, soil, groundwater, freshwater
and bed sediment are shown in Table S2, and the distribution of scores and their environmental
compartments in Figure 1. For the top 10 ranked issues in each compartment, individual scores for
each of the nine factors are provided in Table S3. All 117 issues were assessed for cross-compartment
effects or a common parent source. The ranked integrated priority list for the 22 issues that show
significant cross-compartment spread or a common parent source is summarized in Table 3.
Although it would be possible to provide a literature-supported discussion about each of the
117 issues, the purpose of the ranking model is to reach past this complexity to pick out issues with the
most potential to compromise the policy objective of environmental sustainability. For this reason,
and to illustrate the operational use of ranking model, the focus of subsequent discussion is on the top
three ranked issues in each environmental compartment.
3.1.1. Discharges to Air
The top three ranking air-related issues, and their scores relative to the top air issue, were:
1. AA12.2 Regional impact of greenhouse gases generated globally (100%)
2. AA3.1 Hazardous air pollutants (primarily PM10 ) from domestic home heating in winter (58%)
3. AA4.1 Pollens from pastoral grasses and plantation forestry in rural areas (57%) (Table S2)
The highest-ranking air issue represents regional impacts of climate change caused by global
anthropogenic greenhouse gas emissions. This achieved high factors scores for regional scale,
accumulation, persistence, and environment impact, with moderately high scores for all other
factors apart from potential to cause acute harm to human health (Table S3). Potential regional
impacts include higher frequencies of severe rainfall events (causing more flooding and soil erosion),
droughts, dust storms and wildfires, increased coastal erosion, storm surges and flooding, and increased
concentrations of some aeroallergens (due to longer pollen seasons) and air pollutants (PM10 and
ground-level
Sustainability 2018,ozone) [17–19].
10, x FOR PEER REVIEW 12 of 24
Figure
Figure 1.
1. Relative
Relativescores
scoresfor
for117
117individual
individualenvironmental
environmentalcontamination
contaminationissues
issuesaffecting
affectingair,
air,soil,
soil,
groundwater,
groundwater, and
and aquatic
aquatic ecosystems.
ecosystems. The
Thehighest
highestscore
scoreoverall
overallscore
score(53
(53out
outofof80,
80,scaled
scaledto
to1.0)
1.0)was
was
achieved
achievedbybyissue
issueAA12.2
AA12.2Regional
Regionalimpact
impactof
ofgreenhouse
greenhouse gases
gases generated
generated globally.
globally.
Table 3. Ranked integrated priority list for 22 issues that show significant cross-compartment effects
or a common parent source. All 117 issues were assessed for cross-compartment effects or a common
parent source.
Contamination Issue Score Broad Source Category or Categories
Inorganic contaminants from phosphate
fertilizers in soil, groundwater, freshwater and 90 Agriculture
sedimentSustainability 2020, 12, 9393 12 of 23
Table 3. Ranked integrated priority list for 22 issues that show significant cross-compartment effects or
a common parent source. All 117 issues were assessed for cross-compartment effects or a common
parent source.
Broad Source Category or
Contamination Issue Score
Categories
Inorganic contaminants from phosphate fertilizers in
90 Agriculture
soil, groundwater, freshwater and sediment
Excess nutrients (nitrogen and phosphorus) in soils
86 Agriculture
and freshwaters
Agriculture, energy generation,
Global generation of greenhouse gases (impact of) 86
transport and industry
Microbial contamination of freshwater 57 Agriculture
Zinc accumulation in soil, freshwater, and sediment 57 Agriculture
Volcanic eruptions 55 Natural hazards/ Geothermal
Mine tailings sites 54 Legacy industrial
Agriculture, forestry,
Altered flow regimes and increased sediment 54
urbanization
Natural source with
Arsenic in the Waikato River system 50 anthropogenic exacerbation
(energy generation)
Domestic home heating,
Urban air quality 47
vehicle emissions
Steroid hormones from farmed animals 46 Agriculture (pastoral)
Agriculture, energy generation,
Waikato region generation of greenhouse gases 43
Transport and industry
Natural arsenic and mercury from geothermal areas 42 Natural geothermal
Exposure to pesticides in rural communities 41 Agriculture
Assimilable organic carbon in rural waters 39 Agricultural
Urban storm water runoff 37 Urban
Use of modern pesticides in pastoral farming 35 Agriculture
Mercury from coal combustion 35 Energy generation
Use of treated timber 34 Product use
Rural use of antibiotics, artificial hormones or other
33 Agriculture
non-pesticide xenobiotic compounds
Landfills 33 Industrial and urban
Legacy issues from DDT usage 32 Agriculture
Poor urban air quality in winter is the highest ranked regional air issue (30.5 out of 80; Table
S2), health impacts of which are primarily attributed to airborne particulates measured as PM10 [20].
In most Waikato towns, wood and coal combustion for domestic home heating is the dominant (>80%)
winter PM10 source [21]. Acute and chronic health impacts of the PM10 load range from minor irritation
to cardiopulmonary morbidity and mortality [22,23], and societal costs of poor urban air quality in the
Waikato region have been estimated at over US$500 million per annum [20]. Recent research, based on
data from the ‘Growing up in New Zealand’ child cohort study, found that living in a neighborhood
with a higher density of wood burners was associated with the increased risk of a non-accidental
emergency department visit before the age of three by 28% [24].Two key reasons why this issue achieved
a high overall score in this ranking model is that population is treated as an aspect of scale, and issues
that have the potential to harm human health are emphasized by weighting (Table 2). Poor urban air
quality has become a better characterized problem in New Zealand since the introduction of ambient
air monitoring requirements under the Resource Management (National Environmental Standards for
Air Quality) Regulations 2004. PM10 concentrations have decreased in New Zealand at many locations
over the most-recent decade for which complete data is available (2007–16) with improving trends
identified in 17 of 39 airsheds (18 of 45 monitoring sites) in winter, when home-heating emissions are
at their highest [20,25].Sustainability 2020, 12, 9393 13 of 23
Problems caused by human exposure to pollens ranked third (Table S2). This achieved high scores
as a result of their scale and adverse impacts on people, which range from mild inconvenience to
severe allergic reactions, anaphylaxis and fatality, particularly among asthmatics [26,27]. Although this
category was scored with pollens in mind, a better group term is environmental aeroallergens, because
mold spores are also implicated in the same spectrum of adverse health outcomes [27]. Allergy New
Zealand provides a seasonal pollen calendar that indicates peak months of pollen release for 22 trees,
5 weed species, 11 grasses, and fungal spores [28]. Some of these plants are native but most are exotic,
but for both categories it is evident that most problem pollens are downwind consequences of human
activities. Agency responses in New Zealand have extended to designating some plants (e.g., silver
birch: Betula pendula, privet: Ligustrum spp.) as noxious pest species and issuing factsheets, but control
measures are limited, e.g., the requirement for a landowner to remove privet relies on receipt of a valid
health-related complaint from a neighbor, with the privet causing the problem being within 50 m of
the property boundary [29].
3.1.2. Discharges to Soil
The top three highest scoring soil resource issues and their scores were:
1. SA2.1 Accumulation of cadmium in rural soils through use of phosphate fertilizers (100%)
2. SA2.2 Accumulation of fluorine in rural soils through use of phosphate fertilizers (97%)
3. SA12.1 Large abandoned mine tailings site (Tui Mine and environs) (88%)
The issues ranked first and second were entered in the model separately but are from the same
source—use of phosphate fertilizers on productive land. Approximately 346,000 t of superphosphate
fertilizer is applied to Waikato soils annually [12]. Cadmium and fluorine are naturally elevated in
phosphate rock used to manufacture these, and their progressive accumulation in pastoral soils has
the potential to cause a range of problems discussed elsewhere [30,31] and reflected in factor scores.
Both issues score highly for geographic scale, but some factors differ between the two contaminants
(Table S3). Increasing cadmium in soil has potential to cause issues with food standard compliance,
market access, and human health through increased dietary exposure. Increasing fluorine in soil has the
potential to cause chronic fluorosis in grazing animals with loss of productive capacity, and ultimately
render large areas of land unsuitable for pastoral farming. Although scored for the Waikato region,
these problems will apply globally, because phosphate fertilizers are applied globally [30]. At time
of writing, a national strategy to manage the presence of cadmium in New Zealand agriculture is in
its ninth year, having recently been reviewed [32,33]. No such strategy exists for fluorine although
a subgroup of the Cadmium Management Group has a watching brief as both are derived from the
same source.
The issue ranked third is a medium-scale heavy metal contaminated site situated on the western
slopes of Mt Te Aroha in the Waikato region, and known as the Tui Mine site. This had been
regarded as New Zealand’s most contaminated site [34]. The high score came about due to this site’s
environmental impact, the irreversible nature of contamination coupled with removal of land use
flexibility, and potential to cause harm to human health (Table S3). A key environmental impact was
acid mine drainage from the mine tailings dam to two streams, which caused extinction of aquatic
life for some distance downstream (factor score 5). Geotechnical assessment had also shown that
liquefaction of 90,000 m3 of mine waste might occur in a moderate seismic event or following extreme
weather, causing failure of the containment dam and landslide that would reach the town below [34].
Since this prioritization system was first developed, the Tui Mine workings and tailings dam have
been substantively remediated at a cost of over NZ$22 million [34].Sustainability 2020, 12, 9393 14 of 23
3.1.3. Discharges to Groundwater
For groundwater the top three issues were:
1. GA1.1 Discharge of nitrogen to rural groundwater (100%)
2. GA1.4 Discharge of microbial contaminants to rural groundwater (96%)
3. GA1.13 Progressive acidification of rural groundwater (62%)
Scores for the top two of these were very close. The discharge of microbial contaminants to rural
groundwater was given high factor scores for scale (regional) and the potential for adverse effects on
people or animals that drink contaminated bore-water (Table S3). Livestock waste can carry a variety
of bacterial and protozoan pathogens including fecal streptococci, enterococci, campylobacter, human
adenovirus, cryptosporidium, giardia and (in the case of poultry) salmonellae [35,36], and discharges
into rural surface and groundwater can cause infectious enteric diseases. Daughney and Randall
(2009) [37] reported that 23% of groundwater monitoring sites across New Zealand exceeded
health-based maximum acceptable value of 1 colony forming unit (cfu)/100 mL. New Zealand’s annual
incidence of campylobacteriosis is very high compared to the rate in other developed countries [38].
The issue of excess nitrogen in groundwater is similar in both source and scale. High nitrate (NO3 − ) in
groundwater carries a potential for methaemoglobinaemia or ‘blue baby syndrome’ in infants younger
than 3 months, through gastric bacterial reduction of nitrate to nitrite (NO2 − ) [39]. Intensive agriculture
has caused an increase in nitrate concentrations in many New Zealand groundwaters.
In this ranking system, discharge of nitrate to groundwater achieved a slightly higher score
than microbial discharges, despite the latter achieving a slightly higher score for impact on animal
welfare (Factor 7) (Table S3). This was because of a higher score for nitrogen’s accumulation in
groundwater (Factor 2). Whereas subsoil broadly inhibits the movement and persistence of microbes
in groundwater [40–42], nitrate is both persistent in soil and mobile in groundwater. Internationally,
research has shown that it can take decades for nitrate discharged into soil to reach groundwater and
surface water, meaning that full impacts of current and historic discharges are yet to be felt. This time
lag between discharge and ultimate impact of nitrogen filtering through the system has been referred
to as the ‘nitrate time bomb’ [43]. For Factor 2, nitrogen leaching was therefore allocated a higher score
(5) than microbial leaching (1) (Table S3).
The third ranking groundwater issue received a significantly lower overall score than the top two
issues. Acidification of rural groundwater may come about through nitrification, increased soil carbon
dioxide, and use of acidic fertilizers [44–46], countered to an unknown extent by additions of lime.
Potential impacts are not well defined, but this issue attracted positive scores for scale, accumulation
potential, relative irreversibility, and possible environment impact (Table S3). In the context of this
exercise, high rankings for issues that are not yet well characterized signaled that a higher priority
should be placed on research.
i. Discharges to aquatic ecosystems
For aquatic ecosystems, the top seven issues were:
1. WA3.1 and WA4.1 Entry of nitrogen, phosphorus and assimilable organic carbon to rural surface
waters from direct deposition, runoff or through groundwater (100%)
2. WA2.2 Acidification of oceanic water caused by absorption of global carbon dioxide emissions
(94%)
3. WA3.9 Entry of microbial contaminants to rural freshwaters (91%)
4. WA5.1 and WA7.1 Arsenic in Waikato River system—combined impact of natural inputs, Wairakei
Power Station discharge and presence of eight hydroelectric dams (90%)
5. WA7.2 Altered flow regimes (equivalent to contamination by pressure and volume) causing
destruction and loss of habitat (80%)Sustainability 2020, 12, 9393 15 of 23
6. WA3.6 Zinc in water and zinc accumulation in rural sediments caused by facial eczema treatments
(74%) and
7. WA1.1 Increased suspended sediment in streams, rivers and lakes as a result of human activity
(73%)
Seven issues are listed in this case because issues ranked 1, 3, 5 and 7 comprise a set of
inter-related problems caused by intensive agriculture and its land management practices [47–49].
Elevated concentrations of nitrogen, phosphorus and assimilable organic carbon can all result in
decreased dissolved oxygen concentrations in small rural streams, either by eutrophication and/or the
consumption of oxygen during oxidation of organic matter [50]. Fish and aquatic animals become
stressed when dissolved oxygen concentrations fall below 5 mg/L [51]. Agricultural land use practices
have a large impact on suspended solid concentrations in streams and rivers in the Waikato River [52].
High suspended solids in aquatic ecosystems can cause reduction of light penetration, impaired visual
feeding of fish, loss of macrophytes, smothering of macroinvertebrates, loss of habitats, reduction
in species abundance and diversity, and interference with fish migration [53,54]. Waikato regional
monitoring has shown that concentrations of nitrogen and phosphorus have increased in many of the
Waikato region’s rivers over two decades since monitoring began, with an overall pattern for the region
being deteriorations (progressive increases) in total nitrogen [55]. In parallel with this, bacterial counts
have been too high for safe swimming at nearly 70 per cent of sites sampled, and nearly 75 per cent of
cases the water was not suitable for farm animals to drink [56]. Factor scores for each of the four issues
ranked 1, 3, 5 and 7 for surface water reflected the scale and impacts presented by each component
(Table S3). Although these can also be considered together, this ranking suggests that in priority
order the sustainability issues posed to surface waters from intensive agriculture may follow the order
increased nutrients > microbial contamination > altered flows > increased suspended sediment.
Regional boundaries include coastal marine areas extending to 12 nautical miles.
The second-ranked issue for water (in relation to the Waikato region) is acidification of its coastal
oceans caused by increased absorption of carbon dioxide [57], or ‘the other CO2 problem’ [58,59].
Ocean acidification research is growing exponentially and extensively reviewed elsewhere but this issue
projected to impact all areas of the ocean, from the deep sea to coastal estuaries [60]. It is likely to cause
widespread, potentially catastrophic, changes to marine ecosystems [61,62]. This issue received high
scores for scale, accumulation, lack of reversibility, and environmental impact (Table S2). The resulting
high within-compartment ranking complements the high ranking for discharge of greenhouse gases to
air (see above).
3.2. Comparison with Other Work
Water quality issues in this research are similar to those identified within the US EPA National
Water Quality Inventory [63] but the issues are ranked slightly differently due to differences in
methodology. The US EPA approach is to review water quality and biological monitoring results to
assess the number of miles of waterways which have been impaired. The top ten causes of impairments
in US rivers and streams are given as pathogens, habitat alteration, organic enrichment or oxygen
depletion of waterways, unknown causes, nutrients, metals, sediment, mercury, flow alteration and
turbidity. Excluding oceanic acidification (not considered in the USEPA ranking), there is good
agreement about highest priority issues between the US EPA list and this regional-specific prioritization
exercise. Further down the regional list, high scores are also achieved for some regionally specific
features not seen in the US EPA list. Although these regional features do not score highly at the
national scale of the US EPA list or were not considered, they are significant issues at the regional scale.
An advantage of our proposed framework is it can be easily adapted for differing scales, as scale does
not dominate the scoring system.
These regionally specific features are not discussed further here but include (predominantly
natural) geothermal discharges of arsenic to freshwater ecosystems, and agricultural use of zinc as a
supplement for the prevention of facial eczema.Sustainability 2020, 12, 9393 16 of 23
Pollutants accumulated from diverse diffuse sources is a water quality management issue. As such,
there are other methods that have been developed including the Delphi method to forecast viable
solutions to problems where data was missing or incomplete by obtaining the most reliable consensus
of a group of experts [64]. This risk-based approach for ranking and prioritizing catchments was
used to identify and manage non-point source pollution in Korea [64]. Weaknesses of the Delphi
method include reliance on the opinion of the experts and a tendency to eliminate extreme positions
and so force a middle-of-the-road consensus. This can be quite time consuming. Our proposed
framework requires experts to independently follow a set of rules to score issues rather than come to a
consensus. This approach can be quick, allowing emerging issues or new knowledge to be assessed
alongside established issues. Extremely divergent positions can be reflected in scores and causes further
investigated as part of quality control. In our experience, divergent scores have usually highlighted
a knowledge gap within an issue with regulators often taking a more cautious approach compared
with academics, e.g., the emerging issue “Entry of microplastics to water” is to be included in the next
report update of diffuse contamination issues in the Waikato Region. The relative standard deviation
(RSD) for experts scores was 54%, whereas the RSD for established issues is typicallyYou can also read