Development of a LED-based PIV/PTV system: Characterization of the flow within a cylinder wall-array in a shallow flow
←
→
Page content transcription
If your browser does not render page correctly, please read the page content below
River Flow 2010 - Dittrich, Koll, Aberle & Geisenhainer (eds) - © 2010 Bundesanstalt für Wasserbau ISBN 978-3-939230-00-7

 Development of a LED-based PIV/PTV system: Characterization of
 the flow within a cylinder wall-array in a shallow flow
 D. Groß, W. Brevis & G. H. Jirka.
 Institute for Hydromechanics, Karlsruhe Institute of Technology, Karlsruhe, Germany

ABSTRACT: A Light Emitting Diode (LED)-based PIV system is introduced. The aim of this develop-
ment is to present a flexible and cost-effective alternative to the laser-based illumination systems normal-
ly used for fluid mechanics and hydraulics measurements. Industrial cameras, a computer with raid, soft-
ware for acquisition and control, a fully programmable digital sequencer and an array of high-power
LEDs, compose the system. The LEDs can be used as a continuous or as a pulsed light source, and in the
latter case can be fully synchronized with a mono or multi-camera system. This enables, in addition to
PIV and PTV, the realtime vectorization of flow fields by particle tracing. A demonstration of the system
capabilities is presented, when the flow structure within an array of emerged cylinders is investigated.
The LED light source was able to illuminate the whole horizontal measurement area, avoiding the genera-
tion of shadows, normally induced by the cylinder array when a single light source is used. The results
show a predominant diagonal movement towards the main channel, and almost no difference between the
parameters analyzed at two water depths, an indication of a potentially two-dimensional flow structure.

Keywords: PIV, PTV, LED, Shallow flow, Vegetated flow.

 1 INTRODUCTION                                                  principle of PIV is used by MTV, but instead of
                                                                 particles, uses a pattern of phosphorescent dye
 Image Velocimetry has become a standard tech-                   tagged by a laser light (Gendrich, 1997).
 nique for velocity measurements in fluid mechan-                    From a technical point of view, one common
 ics and Hydraulics. The idea is to seed the flow                characteristic of these techniques is the use of ex-
 with a tracer, particles or phosphorescent dye, and             pensive instrumentation to illuminate and record
 to record its movements by one or more cameras.                 the tracer motion. Normally, a system designed to
 Once the position of the tracer is detected in two              accomplish these measurement consists of a light-
 sequential images, or a single double exposure                  source and optics (normally laser and cylindrical
 image, the displacements at different spatial loca-             lens), a mono or multi-camera system, a sequencer
 tions are calculated (Adrian, 2005). Using the                  for synchronization, and a storage system. The use
 time between frames the velocity field can be de-               of a laser as illumination, involves many advan-
 termined. Depending on the technique used for the               tages, but also operative disadvantages. One of the
 determination of the velocity field, Image Velo-                disadvantages is their high price, the necessary
 cimetry can be mainly classified in Particle Image              safety-measurements surrounding their operation,
 Velocimetry (PIV), Particle Tracking Velocimetry                and the difficulties involved when they are used in
 (PTV) or Molecular Tagging Velocimetry (MTV).                   field measurements.
 The first one uses a Eulerian frame of reference,                   In this paper the development and application
 and allows the determination of two-dimensional                 of a Light Emitting Diode (LED) PIV/PTV system
 (2D) or three-dimensional (3D) velocity fields                  at the Institute for Hydromechanics, Karlsruhe In-
 based on the displacement of groups of tracers.                 stitute of Technology (KIT) is presented. The
 The second one uses a Lagrangian frame and al-                  main objective of this project is to introduce a
 lows also the determination of a 2D or 3D veloci-               flexible and cost-effective alternative to the laser-
 ty field, but based on the determination of the dis-            based illumination systems normally used in fluid
 placements of individual tracers. The same                      mechanics and hydraulics. Firstly, a detailed de-

                                                          1665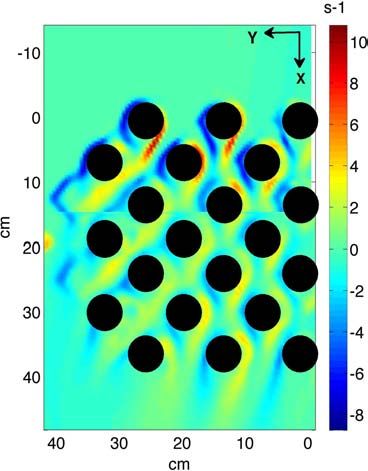
scription of its components, and a discussion of                lightsheet. For larger distance, between lens and
their associated technical restrictions, is presented.          object, and narrower diaphragm -aperture the light
Secondly, a demonstration of the system capabili-               divergence is smaller, however the luminous den-
ties is presented. For this, the flow structure with-           sity decreases. In the experiments described in this
in a cylinder array attached to a channel-side is               paper, over a distance of 0.7 m, the plane widened
measured at two horizontal positions. The paper                 from 3 mm, opening of the slit diaphragm, to 8
finalizes with some recommendations, and a dis-                 mm, i.e. a divergence of the lightsheet of 7 mrad.
cussion of future applications for LED based sys-               While this value is high compared with Lasers,
tems.                                                           typical values are 0.5 mrad for gaussian resonators
                                                                and 4 mrad for stable resonators, the width of the
                                                                non-intrusive light plane is still smaller in this
2 LED ILLUMINATION DESCRIPTION                                  case than the sample volume of common ADV-
                                                                sensors (Acoustic Doppler Velocimetry).
In order to produce a proper light source, instead
of the ND-YAG-Pulse-Lasers commonly used for
illumination in PIT/PTV, an array of Light Emit-
ting Diodes was built. Each array basically con-
sists of several high-power LEDs, current-
controllers and a cylindrical lens, used to paral-
lelize the light in its central zone. The LEDs are
aligned in a row and mounted on an aluminum                     Figure 2 Electronic and optic of the LED-array.
square pipe. The pipe is internally filled by flow-                 Volumetric illumination: When used for volu-
ing water and acts as the mechanical framework                  metric illumination as needed for three dimen-
of the whole construction and as the heat-                      sional measurements (Pereira et al, 2006), the
sink/chiller for the LEDs and the current control-              whole radiometric flux of the LED-arrays, which
lers (See Figure 1 and 2).                                      is more than 200W of light at 2,7KW electrical
                                                                input, is used, resulting in high luminous density
                                                                in the volume of measurement.
                                                                    Flexibility: Handling the LED-arrays is gener-
                                                                ally easier than handling a Laser as their weight is
                                                                low and they are much more shock-resistant.
                                                                Another advantage is the fact that no protections
                                                                against reflecting rays of light are necessary. Thus
                                                                modifications on the PIV/PTV-setup are done in a
Figure 1 Schematic composition of an LED-array                  fraction of the time.
                                                                    Economy: Currently it is not possible to give
    The peak of the emission spectrum of the LEDs               reliable information on what the retail price of in-
is at 470 nm, and their spectral half-width, which              dustrially manufactured systems would be, but it
is the spectral width at 50 % of its peak intensity,            is very likely that it will be a fraction of a Lasers
is 33 nm. This wavelength was chosen as it                      price.
proved to match the spectral range of the peak
sensitivity of the selected cameras and additional-
ly, is the range where the LEDs of the selected                 2.1 PIV/PTV system
manufacturer have their highest efficiency.                     In this section a brief description of the compo-
    Compared to Lasers the LEDs have compara-                   nents of the PIV/PTV system is presented. Several
tive advantages in the following areas:                         modes of operation of the system are possible, and
    Safety: The advantage in terms of safety results            they are defined using a software developed to
from the fact that the light generated by an LED-               configure a digital sequencer that is used to syn-
array is never concentrated into a thin ray as it is            chronize the operation of the components. The
with a Laser, instead a sheet of light is generated             signals emitted by the sequencer are received by
from the source, resulting in a small peak-power                the mono/multi camera equipment and by the
density.                                                        LED array. The pictures are streamed back to the
    Divergence of the lightsheet: In order to obtain            computer and stored in a built-in RAID system.
a narrow lightsheet a slit diaphragm is placed at               An overview of the system is presented in Figure
the required starting point of the lightsheet. The              3.
distance from the LED-array to the diaphragm and
the width of the diaphragm-aperture are the main
factors determining the divergence of the
                                                         1666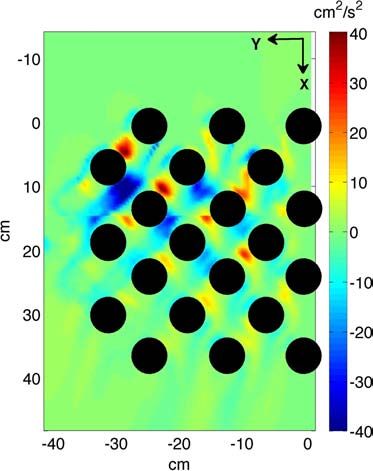
is done in a minute once the principle logic is un-
                                                                  derstood. The sequencer has a timing resolution of
                                                                  20 ns. Its electrical outputs can drive loads of up
                                                                  to 50 mA at 5 V, ensuring low signal-lag even
                                                                  when using long cables. Optionally they can be
                                                                  switched to operate at 12 V for greater flexibility.

                                                                  2.1.3 Software
Figure 3 Schematic representation of the PIV/PTV system.          For the chosen cameras there was no software
                                                                  available that allowed for the continuous acquisi-
2.1.1 Cameras                                                     tion and storage of images. Due to this a software
                                                                  was developed for this purpose.
The system uses two industrial grade cameras for                     The software is written in c++ and features a
image acquisition. While the manufacturer of the                  multithreaded architecture. The primary design
cameras offers a variety of models with different                 goals, besides stability and reliability, which are
resolutions and maximum frame rates, the ones                     obligatory, were low CPU-usage, a high respon-
chosen for the system described here feature a                    siveness and a high performance disc-IO.
one-inch CCD-sensor with 1600x1200 pixel (2                          The software is currently designed to operate
MP) and a greyscale-resolution of 8 or 12 bit. The                with one or two cameras. It features a zoomable
sensor has a pixel size of 7,4² μm² and a quantum                 realtime preview (live-view) for both cameras that
efficiency of 55 % at 470 nm.                                     requires little CPU-time. Due to its multithreaded
    The cameras connect to a PC via the standar-                  architecture and low CPU-usage, the live-view
dized Gigabit Ethernet Interface and deliver a sus-               has no influence on the process of recording im-
tained frame rate of 32 frames per second (FPS),                  ages and can stay active during the experiment.
at full format, and 54 FPS at VGA resolution. Sus-                This is especially useful for the observation of ex-
tained means, that the duration of a continuous re-               tended experiments where the probability of errors
cording is only limited by the size of the data sto-              (e.g. running out of seeding) is higher.
rage (~6 hours for the current system using a                        The ability to record a series of images from
single camera).                                                   two cameras synchronously was of particular im-
                                                                  portance. In order to guarantee that a pair of im-
2.1.2 Sequencer and synchronization                               ages (frames) acquired from the two cameras real-
A sequencer generally is found in PIV-Systems                     ly belongs to the same point in time, the software
and is needed for precise and uniform (with re-                   checks the timestamp of each frame, and automat-
gards to timing) acquisition of the images and                    ically re-synchronizes the two image-streams in
synchronous operation of the device used for il-                  case that an image was lost.
lumination (usually a Laser). Additionally, the ac-
quisition of data from further sensors (e.g. pres-                2.1.4 Computer / Storage System
sure) may be synchronized to the acquisition of                   A single computer controls the whole system.
the images in order to have a common time base                    This computer, based on a common quad-core
and thus to be able to relate measured phenomena.                 CPU (X86 compatible) running at 2,83 GHz, con-
The sequencer we developed is based on a FPGA                     tains a RAID-array of harddisks with a total ca-
(Field Programmable Gate Array, a programmable                    pacity of 1.2 TB expandable up to 4 TB. In the
logic-chip). Up to eight signals can be configured                experiments presented here the computer was
in three different modes of operation: It is possible             used to record the images streamed by two 2 MP
to have a signal running independently at a spe-                  cameras working at full resolution and 32 FPS.
cific frequency, to have it reacting once to another              The RAID-array built in the current system al-
signal with a certain delay and to have it running                lowed the recording of up to ~3 hours with the se-
while another signal is in a certain state. Addi-                 lected camera configuration.
tionally it is possible to combine signals with bi-
nary logic. This flexibility in configuring the sig-
nals allows using the sequencer for a wide variety
of tasks. Not only the different modes of operation
of the LED-based PIV-System can be controlled
but also all Laser based systems in single-, dou-
ble-frame and autocorrelation mode. Even curious
things like alternating image acquisition on two or
more cameras are possible and the configuration
                                                           1667
by comparing two subsequent images at a time
2.2 Modes of operation                                         (Westerweel, 1997). Thus the LEDs need to emit
The system can be operated in four different mod-              a single flash of light for each frame. The duration
es. The current controllers enable these different             of the flash must be short and accordingly, the
modes of operation. The electrical current driven              power of the LEDs (respectively ID) high in order
through the LEDs, ID, determines their radiome-                to keep motion-blur low. The timing-diagram
tric output power, the relation is roughly linear.             shown in Figure 4 illustrates this mode where the
Simply put : the higher the current, the higher the            LEDs operate in a pulsed fashion synchronous to
light-intensity. The current controllers are respon-           the camera(s).
sible for regulating ID and thus the brightness of
the LEDs. Depending on the mode of operation,
different temporal patterns of illumination are re-
quired. By means of the digital sequencer, that
connects to the current controllers, ID can be
switched between three possible values: off (ze-
ro), value1 and value2, where value1 and 2 can be
preselected in the range of 0 to 5000 mA. The cur-
rent controllers are precise and fast; the time it             Figure 4 Timing diagram for the acquisition of images to be
takes to switch to a new value is well below 1 μs.             analyzed by cross-correlation
Due to their rapidness it is possible to precisely
generate the illumination-patterns required for                   An example obtained by this illumination-
each mode of operation.                                        pattern is shown in Figure 5. The image simply
    The current controllers also allow for overdriv-           shows a snap-shot of the particles.
ing the LEDs for short periods of time. That is,
driving more current through the LEDs than per-
mitted for continuous operation (i.e. more than
1000 mA). This characteristic is useful for stro-
boscopic illumination where short illumination
times are required. Overdriving is possible be-
cause the primary factor limiting ID is the temper-
ature of the LED-die (the “die” is the “chip” in-
side the LED that actually generates the light). If
the duration of the pulses is kept short enough, the
LED-die will not heat above the maximum per-
mitted temperature.
    To protect the LEDs against incorrect opera-
                                                               Figure 5 Example image for cross-correlation. Shown is a
tion, there is an overload protection implemented              section of 238x244 pixel out of a 1600x1200 pixel image
in the current-controllers, to limit the pulse-
duration when overdriving the LEDs. The over-
load protection limits the integral of current over            2.2.2 Auto-correlation-mode
time to about 3 mAs and thus ensures a safe oper-              In contrast to cross-correlation, when auto-
ation.                                                         correlation is used, the displacement of the par-
    The last feature of the current controllers is to          ticles or a group of particles is determined within
provide feedback to the user regarding the mea-                a single image (Adrian, 1991). Accordingly the
surement of the real ID when operating the LEDs                particles need to be illuminated twice in each im-
in a pulsed fashion. Two analogue sample and                   age (double-exposure). Again, short illumination-
hold stages measure ID during the duty-cycle of                times are desired. Figure 6 shows the correspond-
the pulses when value1 respectively value2 is de-              ing timing-diagram. The images obtained by this
sired and transform the amplitude of the pulses                illumination-pattern show snap-shots of the parti-
into a continuous signal. This enables to check the            cles where each particle is pictured twice (Figure
currents at which the LEDs operate without hav-                7).
ing to use an oscilloscope.

2.2.1 Cross-correlation-mode
   When performing PTV/PIV based on cross-
correlation, the displacement of the particles
(PTV) or a group of particles (PIV) is determined

                                                        1668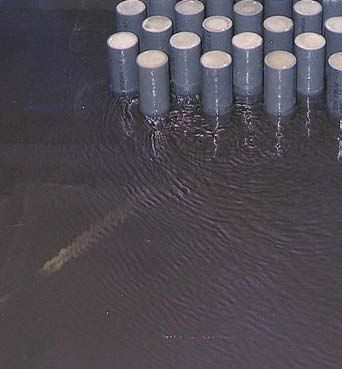
hard to accomplish with the devices traditionally
                                                                     used for illumination (Ruck, 1996).

Figure 6 Timing diagram for the acquisition of images to be
analyzed by auto-correlation

                                                                     Figure 9 example of particle tracing mode

                                                                            2.2.4 Continuous illumination-mode
                                                                     The fourth mode is simply continuous illumina-
                                                                     tion. Continuous illumination will in most cases
                                                                     not be used for any actual measurement. Instead it
                                                                     is useful for setting the PIV/PTV-system, e.g. for
Figure 7 Example image for auto-correlation                          the adjustment of the lightsheet or for viewing the
                                                                     fluid flow by eye as it avoids the disturbing flick-
                                                                     ering involved with the pulsed operation of the
                                                                     LEDs.
2.2.3 Particle tracing-mode                                             Of course the operation of the LEDs is not li-
Acquiring an image with a long exposure time                         mited to the four modes presented here. Instead,
where ID is low and then maximizing ID right be-                     with a suitable sequencer, any arbitrary pattern
fore the end of the exposure yields a picture where                  can be generated by switching between the three
the traces of the particles are visible and a brighter               possible states ID=0, value1 or value2.
dot marks end of each trace, thus making the
whole flow field -including directional informa-
tion- instantly visible The timing diagram is                        3 FLOW WITHIN A CYLINDER WALL-
shown in Figure 8, a resulting image is shown in                       ARRAY IN A SHALLOW FLOW.
Figure 9.
                                                                     To demonstrate the capabilities of the system, the
                                                                     flow within an array of cylinder in a shallow flow
                                                                     was measured. The experiments were conducted
                                                                     in a 17 m long and B = 1.8 m wide, rectangular
                                                                     tilting flume at the Institute for Hydromechanics,
                                                                     Karlsruhe Institute of Technology. The longitu-
                                                                     dinal slope for the experiments was fixed to ap-
                                                                     proximately S=0.001. The flume bottom consisted
Figure 8 Timing diagram for the acquisition of images in             of laminate plastic with small sand elements of di-
particle tracing-mode                                                ameter less than 0.002 m. The flume inflow was
                                                                     connected to a constant head tank and the flow
   Particle tracing provides two advantages and                      rate controlled by an inductive flow meter togeth-
complements perfectly with PIV/PTV. First, it                        er with a computer-controlled gate valve. In order
shows the flow structures with a unbeaten density                    to avoid the formation of upstream perturbations,
of information and second, the information is                        the flow was aligned by using a honeycomb dif-
available immediately, no computing-intensive                        fuser of about 0.2 m wide. The cylinder array was
processing is required. It is an excellent tool for                  modeled by placing single cylinders of d=6.3 cm
visualization and for checking/verifying the plau-                   of diameter. The array had a total width, W= 37.8
sibility of the results obtained by PIV/PTV as it                    cm and length L=44.1 cm, and it was placed at
reveals the structures that were missed or filtered                  one side of the flume. The discharge was constant
out by the PIV/PTV- and post-processing-                             and equal to 0.01 m³/s, with a uniform water depth
algorithms. Currently it is rarely used, as it was
                                                              1669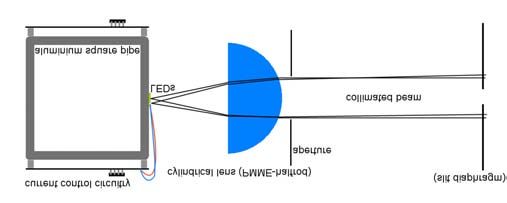
in the measurement area of H=4 cm and a cross- The horizontal measurement planes were lo-
sectional bulk velocity of about V=0.14 m/s. A cated at h=2 cm and h=3 cm, i.e. h/H=0.5 and
general view of the experimental geometry is pre- h/H=0.75, respectively.
sented in Figure 10. This geometry was selected Flow visualizations showed that most of the
due to the complexity associated to similar expe- flow within the cylinder array was deflected to-
riment when a single laser is used. In such cases, wards the main channel and that the velocity flow
the flow within the array is partially covered by downstream the array was significantly reduced.
shadows induced by the cylinders. A similar situa- Similar to the results presented by Zima &
tion can appear if one LED array is used, however Ackermann (2002), and Naudascher & Rockwell
the illumination system is modular, and can be di- (1994), a strong water surface oscillation induced
vided in individual arrays of 100 LEDs. In order by the vortex shedding phenomena generated by
to avoid the shadow formation, 2 of these LEDs the cylinder array was observed.
modules were located in such a way that the light
direction was able to enter in the cylinder array
without shadow formation (see Figure 10).
Flow separation
V
Figure 11 Flow separation at the downstream corner of the
cylinder array.
3.1 Mean velocity field
Figure 10 Schematic representation of the experimental se-
tup.
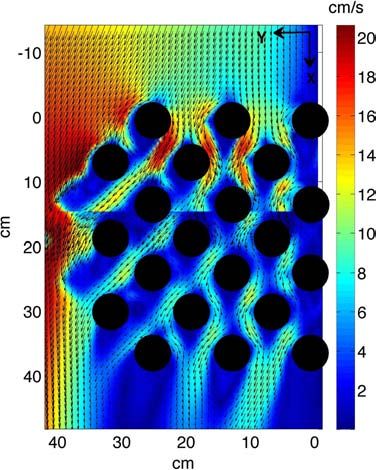
In Figure 12, the mean, two-dimensional, velocity
field, u(x) 2 + v(y) 2 for H/h=0.5 is shown. As
The flow was seeded with polyamide particles observed in the flow visualization, the mean flow
of 100 µm mean diameter (d50). Two synchro- was characterized by a strong deflection of the up-
nized cameras were vertically positioned to record stream flow towards the main channel. All di-
the particle motion, each one covering about half agonal channels, formed between cylinders,
of the cylinder array (see Figure 9). The cameras shown a predominant flow towards the main-
were operated at full resolution, 2 MP, with an channel, and due to this, several local cylinder-
acquisition frequency of 32 Hz. Two horizontal wakes are also showing a diagonal structure (see
planes were measured, each for 5 min, i.e. a total the mean vorticity field shown in Figure 13). The
of 9600 images frames were acquired per mea- comparison of the results between different
surement position. The acquired images were ana- depths, showed almost no difference, which is
lyzed using the GNU Particle Image Velocimetry evidence that the mean flow structure within the
software GPIV (Van der Graaf, 2010). A multi- array was essentially two-dimensional. However a
pass image deformation algorithm was used, detailed analysis of the image series showed an
where the final interrogation window had a size of important vertical motion in the intersection of the
32x32 pix. This interrogation window contained, a diagonal channels (see Figure 14). Due to the flow
mean value higher than 15 particles. separation, the velocity at the upstream–main
The resulting velocity fields were filtered using channel corner of the cylinder array was increased
an iterative Matlab-implementation of the norma- about a 40 % respect to V, while the maximum
lized median filter proposed by Westerweel and velocity in the dominant diagonal channels,
Scarano (2005), using an acceptable fluctuation of downstream the third row of cylinder, was ap-
the velocity due to cross-correlation of 0.3 and proximately 40 % less than V. The larger coherent
threshold for the normalized residuals of 3. structures observed, were generated by vortex
shedding at the downstream cylinder located at
1670(X=37.8,Y=25.2), their characteristic length scale
was of the order of d.
Figure 14 long-exposure images showing the complex flow
at the channel intersections. The flow is visualized by glow-
ing traces drawn by the particles
Figure 12 Mean velocity field at h/H=0.5
Figure 15 Reynolds stress u'v' at h/H=0.5
3.3 Pseudo – Turbulent Kinetic Energy
The pseudo turbulent kinetic energy u' 2 + v ' 2 is
presented in Figure 16. As expected, the higher
levels of kinetic energy are located in the diagonal
Figure 13 Mean vorticity field at h/H=0.5 channels, where the mean velocity is directed to-
wards the main channel. A comparison of this in-
formation and the Reynolds stress shown in Fig-
3.2 Reynolds Stress ure 15, clearly indicate that most of the turbulent
activity occurs in the region contained in the first
In figure 15, the cross-correlation between veloci- four rows, from upstream to downstream direc-
ty fluctuation in x and y direction, u(x,t)'v(x,t)' is tion, and that the energy dissipation of the frees-
presented. Even thought most of the random activ- tream flow must occur mainly in that region.
ity was observed, based on the flow visualiza- Similar to the mean velocity field, both, Reynolds
tions, at the channel intersection, the results reveal stress and pseudo kinetic energy present almost no
that most of the momentum fluxes occur at the variation when the two measured planes were
channels itself, with negative magnitudes in the compared.
dominant channels, i.e. those with flow from the Of course, the region where most turbulent ac-
wall towards the main channel, and positive mag- tivity occurs is a function of the geometry and po-
nitude in those with opposite flow direction. rosity; as a consequence these preliminary results
must be taken only as particular ones.
1671tive alternative to traditional Laser-based systems.
It is expected that further works on the develop-
ment of this system will provide a flexible tool not
only for laboratory, but also for field measure-
ments.
The experimental results provided here show
that even though a complex flow structure was
observed in some flow-channel intersections, the
structure at different horizontal positions re-
mained almost unchanged. Based on the latter ob-
servation it is possible to state that most of the
flow structure was essentially two-dimensional.
The mean turbulent statistics presented here indi-
cate that the momentum fluxes mainly occur in
the internal flow-channels, and that most of the
turbulent activity is localized within the four first
upstream cylinder–rows.
Figure 16 Pseudo Turbulent Kinetic Energy (TKE) at
h/H=0.5
ACKNOWLEDGEMENTS
The authors gratefully acknowledge the support
4 OTHER APPLICATIONS
provided by the German Science Foundation
(Deutsche Forschungsgemeinschaft, DFG), Grant
Due to the portability, shock resistance, and low
JI 18/18-1.
cost, one of the natural applications of the LED
system are field measurements in shallow water
bodies. Another application is the design, not only
REFERENCES
of a LED line, but its extension to a full matrix,
that can be used to scan a volume and to perform R. J. Adrian, "Particle Imaging Methods for Experimental
quasi-three dimensional PIV/PTV measurements. Fluid Mechanics" in Annual Reviews of Fluid Mechan-
All these applications can also involve the vi- ics, 1991, pp. 261-304 .
sualization of a fluorescent tracer such as Fluo- Adrian, R.J., (2005). Twenty years of particle image ve-
rescein, which has an absorption maximum at 494 locimetry. Experiments in Fluids, 39(2), 159-169.
Gendrich, C.P, Koochesfahani, M.N. & Nocera, D.G.
nm, very close to the 470 nm emitted by the LED (1997). Molecular tagging velocimetry and other novel
array presented here. The homogeneity of the light applications of a new phosphorescent supramolecule.
source makes its use particularly adequate for Experiments in Fluids, vol. 23 (5) pp. 361-372.
concentration measurements in small regions, Naudascher, E., and Rockwell, D. 1994. Flow induced vi-
where the natural divergence of the light could be brations—an engineering guide, A. A. Balkema, Rotter-
neglected. dam, The Netherlands.
Pereira, F., Stuer, H., Graff, E. & Gharib, M. (2006). Two-
Finally, it is necessary to point out that any di- frame 3D particle tracking. Measurement Science and
vergence existing in the light source is not longer Technology. Vol. 17(7), pp 1680-1692.
important if multi-camera, three-dimensional Ruck, B., 1996: “A New Flow Measuring Technique for
measurements are involved. In these cases the Velocity Vector Display”, Proc. of the Int. Seminar on
processing of the information allows the recover- Optical Methods and Data Processing in Heat and Fluid
Flow, City University, London.
ing of the cross-plane position of the calculated Van der Graaf, G. (2010) "Gpiv: An open Source project for
velocities. In this situation the error induced by PIV". http://gpiv.sourceforge.net.
the light divergence is complete avoided. J. Westerweel “Fundamentals of digital particle image ve-
locimetry” Meas. Sci. Technol. 8 (1997) 1379-1392.
Westerweel, J. & Scarano, F. (2005). Universal outlier de-
tection for PIV data. Experiments in Fluids . Vol 39(6),
5 CONCLUSIONS pp 1096-1100.
Zima, L. and Ackermann, N. (2002). Wave Generation in
In this work a novel LED based PIV/PTV system Open Channels by Vortex Shedding from Channel Ob-
was presented. Based on the preliminary tests, and structions. J. Hydr. Engrg. Volume 128, Issue 6, pp.
on the measurements presented here, it is possible 596-603
to point out that this system is a real, cost effec-
1672You can also read