Development of Decision-Model and Strategies for Allaying Biased Choices in Design and Development Processes
←
→
Page content transcription
If your browser does not render page correctly, please read the page content below
Journal of Open Innovation:
              Technology, Market, and Complexity

Article
Development of Decision–Model and Strategies for Allaying
Biased Choices in Design and Development Processes
Jafet G. Sanchez Ruelas *, Tarık Şahin and Thomas Vietor

                                          Institute for Engineering Design, Technische Universität Braunschweig, 38108 Braunschweig, Germany;
                                          tarik.sahin@tu-braunschweig.de (T.Ş.); t.vietor@tu-braunschweig.de (T.V.)
                                          * Correspondence: sanchez.jafet@gmail.com; Tel.: +41-77-536-9726

                                          Abstract: The design and development processes are full of decisions. Ranging from simple and
                                          straightforward to complex and elaborated. These decisions are taken by individuals that constantly
                                          rely on their intuition and heuristics to support their decision-making processes. Although heuristics
                                          tend to be very helpful, in many cases, they can lead to cognitive biases. This article postulates a
                                          method to recognize some of these biases and to apply dedicated strategies to diminish their effects.
                                          To do so, the study reviews different decision models in engineering design and consolidates them
                                          into one; here, called ABC decision model—ABC stands for Allaying Biased Choices. This model
                                          consists of four phases describing four different decision types. Subsequently, four matching strategy
                                          sets are prescribed to target some of the most prone biases on those phases. Then, to demonstrate
                                          the application opportunities of this method, the ABC decision model is applied to the process of
                                          Strategic Release Planning (SRP). Finally, to show the theory in real-world conditions, the results of a
                                          pilot industrial application are presented. This article offers promising opportunities for allaying
                                          biased choices in design and development processes.

                                   Keywords: product development; product design; release planning; decision making; heuristics; bias
Citation: Sanchez Ruelas, J.G.;
Şahin, T.; Vietor, T. Development of
Decision–Model and Strategies for
Allaying Biased Choices in Design         1. Introduction
and Development Processes. J. Open
                                               Design frameworks are defined in most companies by well-established processes.
Innov. Technol. Mark. Complex. 2021, 7,
                                          Depending on the company business model, some Design Processes (DPs) will incorporate
118. https://doi.org/10.3390/
                                          open innovation methods. Generally, DPs are described by blocks that represent activities
joitmc7020118
                                          like decisions, operations and tests. DPs—like VDI 2221 [1]—define and support their
                                          decision blocks—or decision stages—with standardized decision-making models and
Received: 20 February 2021
Accepted: 19 April 2021
                                          algorithms. On the one hand, algorithm inputs are composed of objective and subjective
Published: 24 April 2021
                                          variables, which simplify a complex reality by assuming what is relevant and what is
                                          not. On the other hand, the output of these models is interpreted according to the reality
Publisher’s Note: MDPI stays neutral
                                          surrounding the decision—for example, company’s long-term goals, latest market trends
with regard to jurisdictional claims in
                                          and open innovation strategy. Hence, decision-makers make constant use of intuition and
published maps and institutional affil-   heuristics to navigate through these well-established processes [2–7].
iations.                                       Heuristics are mental shortcuts that in most cases help individuals to cope with
                                          complex and/or uncertain scenarios—e.g., when diagnosing open business models [3].
                                          Although these shortcuts generally lead to fast and suitable results, they sometimes lead
                                          to biased conclusions [8]. A cognitive bias is a subjective judgment that deviates from
Copyright: © 2021 by the authors.
                                          those judgments made by objective observers. For example, designers looking for evidence
Licensee MDPI, Basel, Switzerland.
                                          to promote their own innovations will unconsciously tend to overweight the supporting
This article is an open access article
                                          evidence over the contradictory one; this is known as the confirmation bias. A study on
distributed under the terms and           reproducibility showed that more than half of the interviewed scientists admitted failing
conditions of the Creative Commons        to reproduce their own published results, but still trusted the publications on their fields
Attribution (CC BY) license (https://     of expertise [9]. For decades, psychologists and behavioral economists have studied bias-
creativecommons.org/licenses/by/          mitigation strategies and their allying effects, such as fostering constructive discussion on
4.0/).                                    contradictory evidence by playing the Devil’s Advocate to incentivize a more balanced

J. Open Innov. Technol. Mark. Complex. 2021, 7, 118. https://doi.org/10.3390/joitmc7020118                   https://www.mdpi.com/journal/joitmc
J. Open Innov. Technol. Mark. Complex. 2021, 7, 118 2 of 22
judgement [10]—other strategies are covered later in this article. However, not all decisions
are susceptible to the same biases, hence there is need for matching decisions to mitigation
strategies. This leads to the research question: How can DP decisions be matched to their
most persuasive bias-mitigation strategies?
Following Chesbrough’s principle of secondary market innovation [11], this article
takes the well-researched and widespread subject of cognitive biases from psychology
and behavioral economy and implements it in decisions along with the DP. By analyzing
decision-making models in engineering design, this article postulates a decision-making
method that clusters decisions along DPs into four categories: Clarification, Analysis–
realization, Analysis–evaluation and THAT-decision. Then, it matches common cognitive
biases to their most susceptible decision categories. Subsequently, it presents suitable bias-
mitigation strategies to apply to each of the four categories. Then, for evaluation purposes,
the introduced decision-making method is applied to the process of Strategic Release
Planning (SRP) by identifying the dominant decision categories along the SRP process, and
with it, allaying their vulnerability to certain biases. The used SRP process is based on the
work of Şahin et al. [12], where a methodology for value-oriented strategic product-release
planning is presented. Lastly, the postulated method and corresponding bias-mitigation
strategies are successfully tested on five engineers from a product development division of
an international corporation.
Arnot developed a decision support model based on a comprehensive list of biases [13];
however, his model does not match biases with different bias-mitigation strategies, instead,
it focuses on increasing bias awareness. Kinsey et al. offer a bias-mitigating approach to
fire engineering. Their approach covers biases, mitigation strategies and implementation
initiatives [14]; nevertheless, there is no generic application for DPs. Although the literature
on biases is vast, no literature could be found on a generic approach that offered bias-
mitigation strategies to support decision making along with the DP.
The significance of this article relies on the postulation of an interdisciplinary decision-
making method that can be used for categorizing decisions along with DPs and reduce the
effect of cognitive biases along the decision-making process.
2. Literature Review on Decision-Making Models in Engineering Design
Not all decisions are created equal. People come to decisions with different levels of
awareness; some decisions are made on the fly—almost unconscious and automatic—and
others are the conscious result of elaborated analysis. Some decisions are documented and
shared, and others are not. The uncertainty levels of the decision criteria also vary among
decisions. Some decisions are more exploratory and others more conclusive, some are more
complex, and others straightforward. On top of all these decision shades comes the fact that
people have different experiences and knowledge levels, and this prompts them to make
use of heuristics that will vary from case to case and from person to person. Therefore, in
order to support decision-makers, the first step opposed was to identify the different types
of decisions that design engineers face and then map them into a decision-making model.
In order to create a holistic decision-making model in the field of engineering de-
sign, this article considered decision-making models starting from the classic and well-
established model from Miller et al. to more recent ones like the decision-making model
from Hanse et al. [15–20]. The resulting model unifies the analyzed models into one
evolving cycle with four categories/phases.
2.1. Miller et al. TOTE Model (Test Operate Test Exit)
Miller et al. defined a decision model in the mid-90s that consist of two blocks—
called Test and Operate—plus an Exit. Figure 1 illustrates the Test Operate Test Exit
cycle, commonly known as the TOTE model [5,15]. This model describes a cycle that
enters through the test block, which analyses the status quo. This block acts as a Y
junction; if the analysis results unsatisfactory, then the Y junction leads to the operation
block. The operation runs actions/activities to provide a new—and hopefully satisfactory—Test and Operate—plus an Exit. Figure 1 illustrates the Test Operate Test Exit cycle, com-
monly known as the TOTE model [5,15]. This model describes a cycle that enters through
the test block, which analyses the status quo. This block acts as a Y junction; if the analysis
results unsatisfactory, then the Y junction leads to the operation block. The operation runs
actions/activities
J. Open Innov. Technol. Mark. Complex. 2021, 7, 118 to provide a new—and hopefully satisfactory—level, which is then 3 offor-
22
warded back to a new test. The Test–Operation cycle runs until a satisfactory state is
found, in which case, the Y junction leads to an end: exit.
To ease the comparison of blocks among models, the decision-making models from
level, which is then forwarded back to a new test. The Test–Operation cycle runs until a
Figures 1–3 were slightly modified to share the same semantics among them. Likewise,
satisfactory state is found, in which case, the Y junction leads to an end: exit.
the semantics are kept until Figure 5.
Figure 1.
Figure 1. Basic
Basic TOTE
TOTE model. Adaptedfrom
model. Adapted from
ref.ref. [15].
[15].
To
The ease the comparison
model above implies ofthe
blocks among
existence ofmodels, the decision-making
a set of criteria that predefinesmodels from
the satisfac-
J. Open Innov. Technol. Mark. Complex. 2021, 7, 1–3
Figures 118
werethe
slightly 4 of
the23
tory state. Yet, TOTEmodified to share
model does not the same
cover thesemantics
decision among
processthem. Likewise,
for defining those
semantics arefor
criteria, nor kept until Figure
defining actions5.needed during the Operate block to achieve satisfaction.
2.2. Höhne’s Model of Operations
In the 1990s, Galle and Kovács defined two types of decisions: HOW-decisions and
THAT-decisions. The former selects the strategies on how to approach the problem; the
latter defines decisions taken based on the results of the strategy chosen by the HOW-
decision [16].
Höhne proposes a model (Figure 2) that follows the TOTE flow but also adds the two
types of decisions from Galle. The first block in Höhne’s model is the HOW-decision that
determines the decision strategy/path. Then it follows two operations: Synthesis and
Analysis. The former operation collects all available and relevant information that is
needed in order to run the analysis. The analysis strategy used was defined in the HOW-
decision block. Finally, a THAT-decision is taken by evaluating the results of the analysis
in the context of external criteria. The result is a decision that changes the initial status
[19].
Figure 2. Höhne’s model of operations. Adapted from ref. [19].
Figure 2. Höhne’s model of operations. Adapted from ref. [19].
The model above implies the existence of a set of criteria that predefines the satisfactory
state. The
Yet, feedback
the TOTEloop
model doesnot
might notonly
coverbethe
partdecision process for
of the synthesis butdefining those
could also criteria,
change the
nor
way fortodefining
approach actions neededthus
the problem, during
thisthe Operate
article block that
postulates to achieve satisfaction.
the feedback should go back
to the HOW-decision instead of going to the synthesis block. Furthermore, Höhne places
2.2. Höhne’s Model of Operations
evaluate in the final decision block—THAT-decision—and leaves the analysis part outside
of it.InThis
the article
1990s,agrees
Galle that
and analysis
Kovács defined two decision
is not a final types of but
decisions: HOW-decisions
rather provides evidence
and THAT-decisions.
for it; The former
however, this article selects
recognizes thattheallstrategies
analyses on how
have an to approachphase.
evaluation the prob-
This
lem;
articlethedeclares
latter defines decisions
evaluation taken
as forming anbased
opinion onand
themaking
results an
of interpretation
the strategy chosen by
of the evi-
the HOW-decision [16].
dence produced by the analysis–execution phase. Therefore, all analyses have an execution
phase Höhne
and an proposes a model
evaluation phase, (Figure
and none 2)ofthat follows
these phasesthe TOTEtoflow
belong but decision
the final also addsblock.
the
two types of decisions from Galle. The first block in Höhne’s model is the
The following model favors the notion that evaluation is an activity block that precedes HOW-decision
that determines the decision strategy/path. Then it follows two operations: Synthe-
the THAT-decision.
sis and Analysis. The former operation collects all available and relevant information
2.3. Ahmed and Hansen’s Decision-Making Model
Ahmed and Hansen studied several decision-making models and processes for engi-
neering design and stated that “a complete cognitive theory of problem-solving in design
does not exist and research in this area is still in its early stages [18].” Then, they examinedJ. Open Innov. Technol. Mark. Complex. 2021, 7, 118 4 of 22
that is needed in order to run the analysis. The analysis strategy used was defined in
the HOW-decision block. Finally, a THAT-decision is taken by evaluating the results of
J. Open Innov. Technol. Mark. Complex. 2021, 7, 118 5 of 23
the analysis in the context of external criteria. The result is a decision that changes the
initial status [19].
Figure
Figure 3.
3. Decision-making
Decision-making model
model on
on individual
individual designer level. Adapted
designer level. fromref.
Adapted from ref. [18].
[18].
The
The feedback
strategiesloop might
in the not only be part
decision-making model of the synthesis
shown but 3could
in Figure also very
describe change the
similar
way to approach the problem, thus this article postulates that the feedback
characteristics to those of the HOW-decisions, clarifying the context framing the decision. should go
back tomodel,
In this the HOW-decision
the strategiesinstead
lead to of goingand
signals, to the
twosynthesis block. Furthermore,
of these signals—to unify andHöhne
to nav-
places evaluategreat
igate—show in the final decision
similarities block—THAT-decision—and
to synthesis and analysis from Höhne. leaves
Thethe analysis part
decision-making
outside of it. This
activities—to article
evaluate agrees
and that analysisboth
to validate—are is not a final
about decision
forming but rather
an opinion andprovides
making
evidence
an interpretation of the evidence produced by the signals. Following the notion phase.
for it; however, this article recognizes that all analyses have an evaluation of two
This article
analysis declares
phases, theevaluation as forming
signals would belongantoopinion and making an interpretation
the analysis–execution of the
phase and decision-
evidence produced by the analysis–execution phase. Therefore, all analyses
making activities to the analysis–evaluation phase. Lastly, in this model, the THAT-deci- have an execution
phase
sion isand an evaluation
clearly phase,the
about bringing andconsiderations
none of these phases belong to
to a resolution orthe final
to an enddecision block.
to pursue the
The following
worthiest option.model favors the notion that evaluation is an activity block that precedes
the THAT-decision.
Recapitulating, all models presented above consist of decisions and operations/activ-
ities. Galle and Kovács identified two types of decisions: HOW-decisions and THAT-de-
2.3. Ahmed and Hansen’s Decision-Making Model
cision. Respectively, most of the remaining blocks are operations that could be identified
Ahmed and Hansen
as analysis–execution studied
blocks several decision-making
or analysis–evaluation blocks.models
These and processes
results forofengi-
in a total four
neering design and stated that “a complete cognitive theory of problem-solving
blocks, two decision blocks and two operation blocks; these four blocks are the basis in design of
does not exist and
the subsequent model.research in this area is still in its early stages [18].” Then, they examined
the decision map and the decision node and interviewed designers on the topic of deci-
sion making. From
3. Development of their
the ABCstudy, the scientists
Decision Modelsuggested that the design
and Bias Allaying process contains
Strategies
the following decision activities: considering issues, being aware of tradeoffs, reviewing
The last section analyzed different decision models in engineering design. The liter-
options worth pursuing, keeping options open, specifying, unifying, navigating, evaluat-
ature review exposed four distinct blocks describing different types of decisions. These
ing, validating and deciding. They also determined that not all decision activities were
blocks become
decisions per se,the four
but phasesmost
instead, of the here postulated
activities were, in decision-making
essence, operationsmodel:
that preceded
• Clarification
decision [17,18]. phase—HOW-decision
• The Analysis–realization phase
strategies in the decision-making model shown in Figure 3 describe very similar
• Analysis–evaluation phase
characteristics to those of the HOW-decisions, clarifying the context framing the decision.
• this
In THAT–decision phase lead to signals, and two of these signals—to unify and to
model, the strategies
navigate—show
These phases are similarities
great arranging astoasynthesis
loop—as and analysis
in the TOTE from
model. Höhne. The decision-
This, however, does
making activities—to evaluate and to validate—are both about forming
not mean that the decision repeats but rather evolves iteratively. By every loop, an opinion and
the deci-
making an interpretation of the evidence produced by the signals. Following
sion cycle evolves from an introspective and almost unconscious decision cycle continu- the notion
of twotoanalysis
ously a more phases,
collectivethe
andsignals woulddemanding
cognitively belong to theone.analysis–execution phase and
Below, Figure 4 illustrates this
decision-making activities
evolving nature. Here again,to the
thedecision
analysis–evaluation phase. Lastly,
blocks keep consistent in this model, the
semantics.J. Open Innov. Technol. Mark. Complex. 2021, 7, 118 5 of 22
THAT-decision is clearly about bringing the considerations to a resolution or to an end to
pursue the worthiest option.
Recapitulating, all models presented above consist of decisions and operations/
activities. Galle and Kovács identified two types of decisions: HOW-decisions and THAT-
decision. Respectively, most of the remaining blocks are operations that could be identified
as analysis–execution blocks or analysis–evaluation blocks. These results in a total of four
blocks, two decision blocks and two operation blocks; these four blocks are the basis of the
subsequent model.
3. Development of the ABC Decision Model and Bias Allaying Strategies
The last section analyzed different decision models in engineering design. The liter-
ature review exposed four distinct blocks describing different types of decisions. These
blocks become the four phases of the here postulated decision-making model:
• Clarification phase—HOW-decision
• Analysis–realization phase
• Analysis–evaluation phase
• THAT–decision phase
These phases are arranging as a loop—as in the TOTE model. This, however, does not
mean that the decision repeats but rather evolves iteratively. By every loop, the decision
cycle evolves from an introspective and almost unconscious decision cycle continuously to
J. Open Innov. Technol. Mark. Complex. 2021, 7, 118 6 of 23
a more collective and cognitively demanding one. Below, Figure 4 illustrates this evolving
nature. Here again, the decision blocks keep consistent semantics.
Figure4.4.ABC
Figure ABCdecision
decisioncycles.
cycles.
ToTomake
makeclear
clearhow
howthethecycles
cyclesevolve,
evolve,after
aftereach
eachcycle,
cycle,this
thisstudy
studynames
namesblocks
blocksofofthe
the
same
samephase,
phase,and
andthus
thussame
samesemantics,
semantics, with
withnovel
novelnames
namesthat best
that represent
best thethe
represent evolution of
evolution
the given blocks. For example, Figure 5 illustrates how in the clarification phase,
of the given blocks. For example, Figure 5 illustrates how in the clarification phase, the the block
in the early
block in thephase
earlyisphase
calledisreflect—indicating a personal
called reflect—indicating mental process
a personal mentalofprocess
clarification. In
of clarifi-
the next In
cation. cycle,
the the
nextblock inthe
cycle, theblock
clarification phase is called
in the clarification convey—meaning
phase a clarificationa
is called convey—meaning
clarification to others. In the latter phase, the block is named publish—indicating an
agreed and public way of proceeding, like standard operating procedures (SOP). Figure 5
displays the evolving decision cycles arranged by phases.
Allaying Biased Choices (ABC) was the main driver of this study; therefore, the mod-J. Open Innov. Technol. Mark. Complex. 2021, 7, 118 6 of 22
to others. In the latter phase, the block is named publish—indicating an agreed and
J. Open Innov. Technol. Mark. Complex. 2021,
public7, 118
way 7 of the
of proceeding, like standard operating procedures (SOP). Figure 5 displays 23
evolving decision cycles arranged by phases.
Figure
Figure5.5.ABC
ABCdecision
decisionmodel.
model.
Allaying Biased
Clarifying Choices (ABC)
the acknowledged was the
context is main
aboutdriver of this study;
understanding thetherefore, the models
criteria responsible
in this
for section were named accordingly.
unsatisfaction.
•3.1. What could define
Four Evolving Phasesa of
satisfactory status?Model
the ABC Decision
• What factors are or absence of factors is responsible for the unsatisfactory status?
The ABC decision model is described in the following pages focusing on the four
• Who is responsible for the actual modus operandi?
phases but also alluding to the evolving blocks and how they relate to each other.
• Is there a cause-and-effect relationship?
•3.1.1.Where are these factors located?
Clarification
• Why are the factors producing unsatisfaction?
A cycle starts with the clarification phase. This, in turn, is triggered by a previous
• When does the unsatisfaction occur, and how often?
cycle, where a decision was taken. This decision was expressed as a goal, and the general
• How much is it needed to change to an acceptable status?
formulation of a decision-goal is: There is an unsatisfactory status, and actions should be
takenClarifying
to improve thetherequired
status. perspective is about considering action plans that have the
potential
Theto improve
first part ofthe thestatus.
goal—There is an unsatisfactory status—expresses an acknowl-
•edgedWhatcontext. Theare
actions second part—actions should be taken to improve the status—expresses
feasible?
•a required
Who will perspective.
be responsible for the new modus operandi?
• Clarifying
Who shouldthe beacknowledged
involved in thecontext
actions?is about understanding the criteria responsible
•for unsatisfaction.
Where should the actions take place?
•• WhenWhat andcouldindefine
what order should the
a satisfactory actions take place?
status?
•• Why will the actions address the unsatisfaction?
What factors are or absence of factors is responsible for the unsatisfactory status?
•• How Whoshould the actions
is responsible be executed?
for the actual modus operandi?
•• What are the costs/tradeoffs of those actions?
Is there a cause-and-effect relationship?
• At Where are these
the early decisionfactors located?
cycles, this clarification phase runs mentally. If the criteria are
•
known or are assumed to be known,unsatisfaction?
Why are the factors producing the decision is straightforward, implicit, and some-
•
times When does the unsatisfaction
even unconscious. occur,
As the cycles and how
evolve, this often?
phase becomes more interactive and
•
explicit. Regardless of the number of unknown criteriastatus?
How much is it needed to change to an acceptable and required actions, decision-
makers will select only a few of them, those perceived as the most imminent roadblocks
on the path towards the goal. This phase has two outcomes:
1. Awareness of the known criteria responsible for the unsatisfactory status
2. An action plan to reduce uncertainty by:
a. Gain knowledge on the unknown perceived as the decision roadblockJ. Open Innov. Technol. Mark. Complex. 2021, 7, 118 7 of 22
Clarifying the required perspective is about considering action plans that have the
potential to improve the status.
• What actions are feasible?
• Who will be responsible for the new modus operandi?
• Who should be involved in the actions?
• Where should the actions take place?
• When and in what order should the actions take place?
• Why will the actions address the unsatisfaction?
• How should the actions be executed?
• What are the costs/tradeoffs of those actions?
At the early decision cycles, this clarification phase runs mentally. If the criteria
are known or are assumed to be known, the decision is straightforward, implicit, and
sometimes even unconscious. As the cycles evolve, this phase becomes more interactive
and explicit. Regardless of the number of unknown criteria and required actions, decision-
makers will select only a few of them, those perceived as the most imminent roadblocks on
the path towards the goal. This phase has two outcomes:
1. Awareness of the known criteria responsible for the unsatisfactory status
2. An action plan to reduce uncertainty by:
a. Gain knowledge on the unknown perceived as the decision roadblock
b. Test the hypothesis that a given action will truly improve the status
The next two phases are about implementing the action plan aiming to reduce uncer-
tainty to a level that matches the risk–tolerance of the decision-maker.
3.1.2. Analysis–Realization
“To analyze: Examine something methodically and in detail, typically in order to
explain and interpret it. Identify and measure the chemical constituents of a substance
or specimen” [21].
Based on its definition, the verb to analyze can be seen as a two-step action: first, exe-
cutes/applies a defined method, and then evaluates/interprets the results. In this article, these
two steps will be referred to, respectively, as analysis–realization and analysis–evaluation.
The noun realization in this phase was also selected due to its double meaning: “the
achievement of something desired or anticipated” [22]. Additionally, “an act of becoming
fully aware of something as a fact” [22]. The analysis–realization phase is about gathering
data by means of executing an action plan, and it is also about doing so while observing
with curiosity. Combined, the execution and the observation yield data, and this data can
be later interpreted to generate knowledge.
At the early decision cycles, the action plan aims at discovering while doing, primarily
to gain knowledge; for example, searching for information or looking for options, solutions,
ideas, materials, resources, etc. At the final cycles, this phase tends to be more about
challenging hypotheses, primarily to gain certainty; for example, running a test and
looking if the concept behaves as expected. Realizing the action plan produces data such
as a pallet of ideas or test results, but ideas without screening are just ideas, and numbers
from a test bench are just numbers. Without evaluation, data has no meaning: are the ideas
and/or results good, bad or useful for reaching the goal? To create knowledge out of data,
the latter needs to get organized and ranked, and this takes place in the next decision phase.
In the same manner, Hammond and Summers divided the cognitive analysis into two
components: knowledge acquisition and deciding based on knowledge; and then named
these phases knowledge and control [23].
The analysis-realization phase is primarily bout knowledge acquisition by explo-
ration. During this exploration, constant decisions are made on where to focus the at-
tention. One example: when looking for materials, the focus could be on its look, feel,
mechanical properties, etc. Another example: when testing a machine, the focus could
be on the measured values, the stability of the system, unexpected noises, etc. The deci-J. Open Innov. Technol. Mark. Complex. 2021, 7, 118 8 of 22
sions in this phase determine what data is collected and neglected—generally, a person
will have higher chances of finding something when he/she is actively looking for it.
Based on the exploration, the next phase—analysis–evaluation—will determine the worth
of the collection.
3.1.3. Analysis–Evaluation
The last section defined analysis as a two-step process that: first applies a defined
method and then evaluates/interprets the results. Analysis–evaluation is that second step.
Evaluation is about ordering and labelling data, or options, based on present knowledge
and circumstances in order to obtain information that is useful for reaching the goal. Infor-
mation is not only structured data but useful data [24]. Analysis–evaluation is not about
yes and no judgments, but about categorizing data points among them as better–or worse
options—or else more– or less–valuable options—based on current knowledge and context.
Generally, the categorization of data points is based on multiple criteria/dimensions; some
are straightforward—e.g., cost—while others are less so—e.g., appeal. Furthermore, these
dimensions tend to be in conflict with each other, and decision-makers will seldomly have
mathematical models available describing the behavior of those conflicting correlations.
Thus, knowledge and experience are heavily used to allocate values to data, especially but
not exclusively in the early decision cycles, where evaluations rely primarily on personal
judgments and heuristics to manage implicit complexity. An intrinsic challenge of complex-
ity is that, depending on the level of detail used to reflect on, observe, assess, and manage
an artifact, this artifact can be perceived both as simple or complex; just like a simple pencil
requires a 12 pages essay to explain the complexity of the machinery that moves around
sourcing and producing a lead pencil [25].
When one or more criteria cannot be numerically represented or correlated, then a
good visualization of multi-criteria is necessary to support such evaluations [26]. As deci-
sion cycles progress, the correlations among dimensions become more transparent, and the
stakes become higher. Consequently, decision-makers make use of multi-criteria decision
analysis tools like analytic hierarchy processes and fuzzy sets [27,28]. This leads to semi-
automatic evaluations and reports that highlight the most promising data/options. This
article considers an automatic–evaluation as the act of reusing previous THAT-decisions;
more on that in the next section.
Analysis–evaluation results in hierarchically organized data, making useful informa-
tion out of the data collected on the analysis–realization phase. The top-ranked data can be
interpreted as the most promising option, or group of options, for the given criteria. This
information adds knowledge and reduces uncertainty to overcome the roadblocks found
in the clarification phase. All these prepare the ground to make a decision that will bring
the decision-maker closer to the goal.
3.1.4. THAT-Decision
THAT-decision is the phase that relates best with the popular understanding of
the word decision. Coming from the Latin decider, meaning cut-off, to decide means
to make up one’s mind on what is really needed to reach the goal, taking that, and cutting
off the rest.
The decision cycle started with the goal of improving satisfaction. The clarification
phase created awareness on the context, the path, and the roadblocks—like, knowledge
gaps and uncertainty—that needed to be addressed in preparation for taking action with a
tolerable confidence level. The analysis phases produced and collected the information
needed to overcome the roadblocks. Lastly, considering context, goal, knowns, unknowns
and ranked options, decision-makers resolve for that option or a group of options. A
THAT-decision promises the best possible result that maximizes satisfaction with the given
uncertainty within a descriptive decision theory framework [29].
There are four possible outcomes for a THAT-decision:J. Open Innov. Technol. Mark. Complex. 2021, 7, 118 9 of 22
• Yes: the top-ranked option shall be implemented. The option to follow is clear, but
the way to implement the option may not be that clear; thus, a new decision cycle
starts focusing on the implementation. In the latter decision cycles, the focus moves to
prove the effectiveness or repeatability of the selected option.
• No, next: the top-ranked option lays out of reach or scope after holistic scrutiny—e.g.,
missing infrastructure or competence, conflict of interest, no business case, you cannot
fire your boss, etc. It’s very challenging to run analysis–evaluations with all thinkable
criteria incorporated within the model; thus, criteria will be left out to be considered
only at the holistic scrutiny of the THAT-decision. Once the number one option is left
aside, the decision focuses on the number two.
• No, refine: when the uncertainty of options seems too high and/or the gained knowl-
edge seems too low, the decision can be to repeat the cycle again, this time looking for
more details. However, this is a decision against time, a tradeoff between deciding
and moving on vs. increasing knowledge and certainty on the available options.
• Else: often, decision cycles end with an else result. One reason could be that none of
the options obtained reached the minimum threshold or that the unexpected analysis
findings or recent external factors change the urgency of the goal or made it irrelevant.
All else cases terminate—or completely redirect—the pursue of the satisfactory status.
All four options are cutting-off slag. Yes leaves the option dilemma behind and moves
on. No and next discards the top-ranked option and moves to the next. No and refine loses
time. Lastly, else puts the decision aside—as a decision of not to decide—and moves on to
another decision or goal. Once a THAT-decision is made, there is no way back; this action
has irreversible consequences. On the one hand, this decision frees up resources that allow
for a leaner process. On the other hand, by cutting off, opportunities and options are left
behind, creating a sense of loss. Consequently, THAT-decisions have an implicit tradeoff
between losses and gains. Prospect theory states that decision-makers tend to overweight
options framed as gains over those framed as losses in a nonlinear manner that differs from
a normative linear behavior [7]. Thus generally, how a THAT-decision is framed will tend
to influence the outcome, and this is something that decision-makers need to be aware of.
The ABC decision model postulates four phases that represent four different types of
decisions, each with its unique challenges. Clarification is about recognizing and managing
uncertainty. Analysis–realization is about selecting the relevant data sources and their
processes while neglecting the rest—managing attention. Analysis–evaluation is about
making proper use of personal judgment and heuristics—managing complexity. Lastly,
THAT-decision is about balancing the way gains and losses are framed.
3.2. Decisions, Biases and Mitigation Strategies
As stated earlier, bias-mitigation strategies, such as the Devil’s Advocate [10], have
proven useful against biased decision making. However, not all decisions are created equal;
thus, certain biases influence some decisions stronger than others; hence, there is a need
for matching decisions to mitigation strategies. The ABC decision model described before
allows decision-makers to sort decisions into one of four types/phases. In addition, to
match these four phases with their strongest bias-mitigation strategies, this section takes
the following steps: First, it presents the results of a literature review done in the fields
of psychology and behavioral economics, with a focus on biased decision making. The
review selected studies where individuals were confronted with decisions that involved
uncertainty and/or complexity. These studies forecasted and proved that certain decisions
paired with certain circumstances could yield biased decision making. Next, this section
shows how mitigation strategies applied during the decision phase can reduce the effects
of cognitive biases. Ultimately, this section outlines a list of biases with their corresponding
mitigation strategies, all grouped within the four ABC decision phases.J. Open Innov. Technol. Mark. Complex. 2021, 7, 118 10 of 22
3.2.1. Biases Affecting Clarification
The Clarification phase—as described in Section 3.1.1—is about understanding and
recognizing what decision criteria are known and what is unknown but also about elabo-
ration and action plans to gain knowledge and reduce uncertainty. The literature review
showed a set of biases that directly affect these decisions and circumstances:
• Bias: Overconfidence
Societies and teams work best when expertise is spread among the group and in-
dividuals can focus on their own know-how while trusting the expertise and results of
others—e.g., the butcher buys bread from the baker and vice-versa. Moreover, knowledge
seems easy to obtain when explained by the expert or a quick YouTube tutorial. Unfortu-
nately, the YouTube audience usually finishes the tutorial assuming that they know the
topic as well as the one that gave the talk, and even in the same depth. On the first step of
a study conducted by Rozenblit and Keil, participants were asked if they knew in-depth
how a ball-pen or a zipper worked. Most people claimed to have deep knowledge. On a
second step, participants were asked to proceed with a deep explanation on that matter,
but then almost no one was able to do so [30]. Generally, individuals think that they know
more than what they really do. This leads decision-makers to neglect risk and gaps that
might be important for a decision.
# Strategy: Breaking it down
Rozenblit and Keil provided the remedy for overconfidence within the same exper-
iment. The second step of the experiment brought participants to realize how little they
really knew about the subject. Breaking the problem or system down into smaller pieces
helps to see the complexity, dangers, unknowns and risks hidden behind the detail. This
strategy is a straightforward approach to deep dive into the problem at hand and increases
awareness about the unknowns [30].
• Bias: Optimism and the planning fallacy
Individuals tend to overestimate the probability of outcomes turning in their favor.
Optimism lessens factual risk available in plain sight through wishful thinking—thoughts
such as this time will be different, or this time we know better. Yes, circumstances will be
different, but there is no certainty that they will be different in favor of the goal. Likewise,
the knowledge and experience gain in the past generally speeds up the tasks, but rarely by
the optimistic amount estimated [31].
# Strategy: Asking externals
While optimism acts strongly on personal expectations of success, it does not distort
what people expect about others outside their group. Thus, it is recommended to collect
the points of view of externals who have no stakes on the goal in hand but have experience
in similar matters. To avoid that those externals fall victims to the same fallacy, they should
provide or support their estimations based on similar past experiences and do not assume
that this time will be different [32].
3.2.2. Biases Affecting Analysis–Realization
Circumstances, experience, searching tools available, strategies and even the decision-
maker’s mood will affect what data is collected and neglected in this phase. Three biases
stood up in this topic.
• Bias: Bounded awareness
On a famous experiment ran by Simons and Chabris from Harvard University, partici-
pants were presented with a video. The video showed two basketball teams, one dressed in
black uniforms and the other in white ones. Each team had a ball, and they were passing the
ball among team members while moving randomly around the court. Before starting the
video, participants were asked to count the number of passes done by the white team. In
this video, a man with a gorilla custom walks into the middle of the scene, faces the camera,J. Open Innov. Technol. Mark. Complex. 2021, 7, 118 11 of 22
and crosses the court while the teams are passing the ball. Although many participants
get the passes-count right, only half noticed the gorilla. This experiment illustrates how
people focused on a task—counting passes of the white team—will automatically filter out
the noise—other individuals in black. A risk of this tunnel vision is that decision-makers
are unaware of that what they are missing, and this can lead to unconsciously ignoring
relevant information or requirements [33].
# Strategy: Looking at the bigger picture
When working in teams, a team member can be assigned to step back and assess the
decision-making process and the given circumstances like team dynamics, methodologies
implemented, news from outside, stakeholder perspectives, invisible gorillas, etc. Team
members can take breaks and change hats before making important decisions.
• Bias: Confirmation
As mentioned in the introduction, this bias manifests when decision-makers are look-
ing for evidence to confirm their own postulations. In those cases, they will unconsciously
tend to overweigh the supporting evidence over the contradictory one. The previously
mentioned study—published on Nature—demonstrates the biased behavior [9].
# Strategy: Devil’s Advocate
This is a well-known strategy used for hundreds of years, where a person in the team
is assigned to challenge the status quo, and the team believes. An article from Schwenk, in
this regard, postulates and effective use of the devil’s advocate strategy [10].
• Bias: Search type
As long as the results give suitable outcomes, decision-makers will not consider the
strategies used for the search to judge its reliability. When participants are asked if there
are more words in the English vocabulary of at least three letters, starting with the letter r,
or more words with r in the third position, most of them favor the former option. In fact,
there are more words with the letter r in the third position than in the first. Nevertheless, it
is just easier to recall words by vocalizing the first letter, making this the default searching
strategy. When the time does not allow to finding other strategies, the ineffectiveness to
recall words by the third letter gets neglected. The same goes true when looking for a
solution, options, information, etc.; people tend to use their default search strategy with
little or no consideration of its effectiveness and/or impartiality [34].
# Strategy: Searching different
Trying out different search methods and channels will not only test the impartiality of
the individual searches but will also enrich the gathered data. For the example of words
with the letter r: searching for words in this article’s paragraphs will quickly demonstrate
the abundance of words with the letter r in the third position.
3.2.3. Biases Affecting Analysis–Evaluation
This decision phase is primarily about ranking data/options by assigning values. In
principle, the values assigned should consider the complexity within the system but also
its surroundings—such as team dynamics, business context, sociopolitical issues, etc. To
manage this complexity, individuals make use of judgments and heuristics. The literature
review yielded three biases that strongly affect evaluations.
• Bias: Anchoring
When a value is unknown, the value appraised will gravitate to the last available
figure. This figure is sometimes formulated in the question, and others it’s just an unrelated
or random figure; regardless of its origin, this figure will affect the estimated value. Tversky
and Kahneman conducted an experiment in 1974 where participants were brought to spin
a wheel of fortune that had numbers going from 0 to 100. Unknown to the participants, this
wheel was tweaked to land only in 10 or 65. After the wheel stopped, they were asked twoJ. Open Innov. Technol. Mark. Complex. 2021, 7, 118 12 of 22
questions: first, to say if they believed that the percentage of African countries affiliated to
the United Nations was higher or lower than the figure given by the wheel. Subsequently,
they were asked to estimate an actual percentage. The average estimate for those who got
65 was 45%, and the average estimate for those who got 10 was 25% [8].
# Strategy: Applying contrafactual thinking
In this strategy, decision-makers reflect on the given answer with what-ifs: What if the
assessed value is wrong? What if the real value is completely on the opposite side of the
spectrum? What if the assumptions for the assessment are wrong? Answers to questions of
this sort deliver other anchors that help decision-makers to pull away from the original
one, allowing for a more distributed evaluation [29].
• Bias: Inconsistency
Hammond and Summers conducted a study on their two decision phases: knowledge
and control, named here analysis–realization and analysis–evaluation, respectively. There,
they analyzed participants making decisions in one or the other phase. Through multiple
regression analysis, they found that participants made more cognitive errors in the control
phase. Moreover, the errors were not biased to one or the other direction but spread in
both, meaning that all things being equal, participants will fail to give a constant value to
the same figure [23].
# Strategy: Calibrating by continual comparisons
The straightforward strategy to reduce inconsistency is to calibrate continuously.
Making use of some reference examples can help to keep values consistent. It is important
to highlight that this strategy does not improve the assertiveness of the values but only
their consistency. Nevertheless, having consistent values is a good first step towards
comparable results.
• Bias: Redundancy
This bias describes the false belief that adding interdependent/redundant inputs will
linearly increase system reliability [8]. Adding a second seatbelt to the same passenger—
or improving the first restrain system—will unlikely double the safety that the first
seatbelt provided.
# Strategy: Doing the math
Sometimes, decision-makers just need to sit down and crunch the numbers to prove
their assumptions before they invest more resources, especially when the stakes are high.
3.2.4. Bias Affecting THAT-Decision
This phase focuses on cutting off slag, keeping the important part, and letting go of
the rest. Letting go implies losing something on the one side, but on the other side, winning
something else. A pair of biases stood out during the literate review for dealing with wins
and losses in decision making.
• Bias: Framing and loss aversion
This bias is one of the main concepts presented by Kahneman and Tversky on a
theory called the prospect theory, published in 1979. On multiple studies, they tested how
individuals will experience a nonlinear behavior when confronted with decisions framed
as losses vs. decisions framed as wins. Their studies yield the following conclusions:
1. “A gain is more preferable than a loss of the same value.
2. A sure gain is more preferable that a probabilistic gain of greater value.
3. A probabilistic loss is more preferable than a sure–loss of lower value” [7].
Additionally, Kahneman and Tversky vary the experiments by incrementally increas-
ing the premium of the bet. Doing so, they could plot the nonlinear and unsymmetrical
sensitivity of people against a premium; they call the plot: hypothetical value function inJ. Open Innov. Technol. Mark. Complex. 2021, 7, 118 13 of 22
prospect theory. The part of the value function describing losses shows that the perceived
value of the loss is greater when the financial losses are small, but it gets even as the
financial losses grow. However, on the gains side of the value function, the perceived and
financial gains start even when the gains are small, and as the financial gains get bigger the
perceive value of the gain gets smaller.
# Strategy: Turning it around
This approach aims to bring all decisions to a similar level to avoid the winning or
losing dilemma. The strategy recommends finding the positive side of the losses and
framing all decisions by their gains [35].
• Bias: Sunk Cost fallacy
This bias appears when decision-makers consider their non-recoverable expenses—
sunk costs—as if they were of value for the next investment decision. For example, investing
time on a tour, game or activity that was purchased to bring joy but is not doing so, just to
get the money worth.
# Strategy: 100 times
This strategy can be applied to both biases in this phase. Since losses loom larger
than gains, decision-makers might be willing to sacrifice above their rational threshold
to avoid one loss. However, this willingness dissolves when asked to repeat the same
decisions 100 times in the future. This tactic magnifies the consequences of the upcoming
decision and moves the decision-maker away from the steep decline of the loss from the
hypothetical value function in prospect theory [7].
This article’s hypothesis postulates that bias decisions along the DP can be mitigated.
To do so, the decision phases need first to be identified along the process, and then the
corresponding bias-mitigation strategies can be applied. In the next section, the SRP
methodology was used to exercise the implementation of the above-mentioned hypotheses.
4. Implementation of the ABC Decisions and Strategies to the SRP Methodology
Customer purchase decisions are increasingly focusing on added features—or at least
improved ones—when comparing products within and between brands. The rising share
of software in previously mechanically based products enables products to be upgraded
not only by mechanically based technological changes but also by software-based features
and services. As a result, companies can develop novel innovative business models, but
at the same time, face increased complexity in upgrading their products. Accordingly,
companies are faced with the question of how to upgrade future products by introducing
new features. Here, decisions have to be made on which features are valuable or should
be postponed for future releases. This type of product evolution planning—by deciding
which and when new features and releases should be introduced—is part of SRP. This
planning can be seen as an optimization problem, more precisely, as an application of the
knapsack problem. This problem is experienced by anyone who is limited by a given size
of a knapsack and seeks to fill it with the most valuable items. With respect to release
planning, a similar problem can be characterized by selecting an optimal set of features of
the highest value for the next release, which must be developed with limited resources and
costs. Additionally, the planning decisions need to consider strategic goals, market timing,
feature feasibility/maturity and portfolio dependencies. The challenge for decision-makers
in SRP is the fine line between value creation and cost effects. On one side, companies
expect profits, and customers expect added value from new features. On the other side, the
introduction of new features means costs and risks. For this reason, SRP is considered an
optimization problem in the sense of the knapsack problem. As a result, decision-makers
in release planning are faced with the challenge of making several correlated decisions
while considering system complexity. SRP can therefore be seen as a very vulnerable
process for biases.J. Open Innov. Technol. Mark. Complex. 2021, 7, 118 14 of 22
4.1. SRP Methodology Steps
This section presents a methodology on value-oriented strategic release planning
based on the work of Şahin et al. [12] alongside. This methodology is examined through
the lens of the ABC decision model to identify opportunities to improve the decisions along
with the 13 SRP steps. Hence, the SRP methodology steps are described with a focus on
their relevant decision. The SRP methodology endeavors to illustrate how the ABC decision
model can be applied to any process within the DP, even when this process includes actors
from different disciplines. The way to implement the ABC model throughout the SRP
J. Open Innov. Technol. Mark. Complex.process
2021, 7, 118
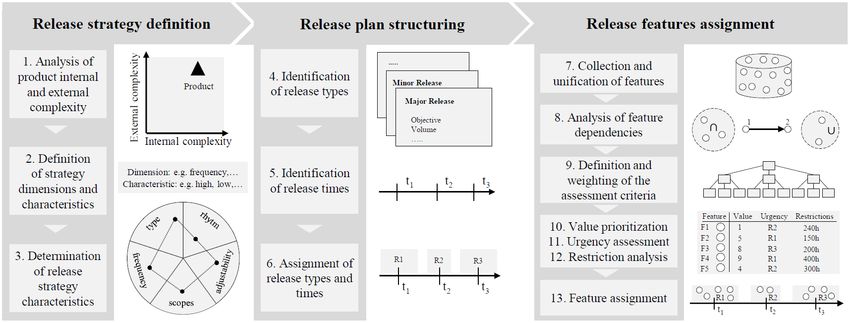
is clarified in Section 4.2. Figure 6 shows an overview of the SRP process, its15three
of 23
stages and 13 steps.
Figure
Figure6.6.Methodology
Methodologyfor
forvalue-oriented
value-orientedstrategical
strategicalrelease planning.Adapted
releaseplanning. fromref.
Adapted from ref.[12].
[12].
1. Analysis
1. Analysis of product
of product internal
internal andand external
external complexity
complexity
The SRP
The SRP begins with the
begins with the stage
stage of
of the
the release
release strategy
strategy definition.
definition. The
The release
release strategy
strategy
provides
provides aaguideline
guidelinefor forthe
theentire planning
entire planning process
processandand
contains fundamental
contains principles—
fundamental princi-
e.g., releaserelease
ples—e.g., frequency, planning
frequency, scope and
planning scopelevel
andoflevel
systematization—to be followed
of systematization—to when
be followed
updating the product. Defining a release strategy depends primarily on
when updating the product. Defining a release strategy depends primarily on the inter- the internal—e.g.,
architectural
nal—e.g., flexibility—and
architectural external complexities—e.g.,
flexibility—and market dynamics—that
external complexities—e.g., a product
market dynamics—
is subjected to, as well as the underlying product, portfolio and business
that a product is subjected to, as well as the underlying product, portfolio and business strategy. Thus,
the first step of SRP (1) is an analysis of the external and internal complexity of
strategy. Thus, the first step of SRP (1) is an analysis of the external and internal complex- a product.
ity
# ofAssessment:
a product. This step focuses on planning and attaining business clarity; hence, this
o step can be considered
Assessment: a clarification
This step focuses phase.and attaining business clarity; hence, this
on planning
2–3. step can beand
Definition considered a clarification
determination of strategy phase.
dimensions and characteristics
2–3. Definition and determination
The classification of strategy
of a product’s dimensions
complexity mayand
becharacteristics
done very roughly with no ref-
erenceThe classification
products of a product’s
and supporting complexity
criteria may be
to determine thedone very roughly
complexity, since in with no cases,
most refer-
the staff
ence involved
products andinsupporting
details of a criteria
product,totend to rate their
determine products assince
the complexity, beingincomplex—as
most cases,
previously shown in
the staff involved with the pencil
details example.
of a product, Based
tend on atheir
to rate product’s complexity
products as being classification,
complex—as
the according
previously release
shown with strategy dimensions—e.g.,
the pencil example. Basedrhythm—and
on a product’stheir characteristics—e.g.,
complexity classification,
cyclic,
the feature-based—can
according release strategybe defined (2) and consequently
dimensions—e.g., rhythm—and determined (3). The automotive
their characteristics—e.g.,
industry,
cyclic, for example, follows
feature-based—can be highly
defined fixed release
(2) and strategies with
consequently predefined
determined (3).release types—
The automo-
e.g., facelift—of low frequency and cyclically predefined releases [36].
tive industry, for example, follows highly fixed release strategies with predefined release As the example
indicates, thefacelift—of
types—e.g., release strategy forms theand
low frequency planning process.
cyclically Here, strategic
predefined rolesAs
releases [36]. andtheopin-
ex-
ions, asindicates,
ample well as soft
the factors, have a significant
release strategy forms the influence in this phase,
planning process. Here,making
strategicthis phase
roles and
highly subjective.
opinions, as well asSince
soft the overall
factors, havelong-term planning
a significant is based
influence on the
in this strategy,
phase, makingbiases
this
should be minimized in order to avoid the long-term consequences
phase highly subjective. Since the overall long-term planning is based on the strategy, of wrong decisions.
The
biasesdetermination of the release
should be minimized typesto
in order has enormous
avoid effects onconsequences
the long-term the entire product evolution
of wrong deci-
and should therefore be reviewed regularly.
sions. The determination of the release types has enormous effects on the entire product
evolution and should therefore be reviewed regularly.
o Assessment: Step two and three are mainly evaluating figures and ranking charac-
teristics while managing system complexity; hence, these steps can be considered
analysis–evaluation phases.You can also read