Diagnostic value of diffusion-weighted imaging with synthetic b-values in breast tumors: comparison with dynamic contrast-enhanced and ...
←
→
Page content transcription
If your browser does not render page correctly, please read the page content below
European Radiology (2021) 31:356–367
https://doi.org/10.1007/s00330-020-07094-z

    BREAST

Diagnostic value of diffusion-weighted imaging with synthetic
b-values in breast tumors: comparison with dynamic
contrast-enhanced and multiparametric MRI
Isaac Daimiel Naranjo 1 & Roberto Lo Gullo 1,2 & Carolina Saccarelli 1 & Sunitha B. Thakur 1,3 & Almir Bitencourt 1,4 &
Elizabeth A. Morris 1 & Maxine S. Jochelson 1 & Varadan Sevilimedu 5 & Danny F. Martinez 1 & Katja Pinker-Domenig 1,6

Received: 23 January 2020 / Revised: 22 May 2020 / Accepted: 21 July 2020 / Published online: 11 August 2020
# The Author(s) 2020

Abstract
Objectives To assess DWI for tumor visibility and breast cancer detection by the addition of different synthetic b-values.
Methods Eighty-four consecutive women who underwent a breast-multiparametric-MRI (mpMRI) with enhancing lesions on
DCE-MRI (BI-RADS 2–5) were included in this IRB-approved retrospective study from September 2018 to March 2019. Three
readers evaluated DW acquired b-800 and synthetic b-1000, b-1200, b-1500, and b-1800 s/mm2 images for lesion visibility and
preferred b-value based on lesion conspicuity. Image quality (1–3 scores) and breast composition (BI-RADS) were also recorded.
Diagnostic parameters for DWI were determined using a 1–5 malignancy score based on qualitative imaging parameters
(acquired + preferred synthetic b-values) and ADC values. BI-RADS classification was used for DCE-MRI and quantitative
ADC values + BI-RADS were used for mpMRI.
Results Sixty-four malignant (average = 23 mm) and 39 benign (average = 8 mm) lesions were found in 80 women. Although b-
800 achieved the best image quality score, synthetic b-values 1200–1500 s/mm2 were preferred for lesion conspicuity, especially
in dense breast. b-800 and synthetic b-1000/b-1200 s/mm2 values allowed the visualization of 84–90% of cancers visible with
DCE-MRI performing better than b-1500/b-1800 s/mm2. DWI was more specific (86.3% vs 65.7%, p < 0.001) but less sensitive
(62.8% vs 90%, p < 0.001) and accurate (71% vs 80.7%, p = 0.003) than DCE-MRI for breast cancer detection, where mpMRI
was the most accurate modality accounting for less false positive cases.
Conclusion The addition of synthetic b-values enhances tumor conspicuity and could potentially improve tumor visualization
particularly in dense breast. However, its supportive role for DWI breast cancer detection is still not definite.
Key Points
• The addition of synthetic b-values (1200–1500 s/mm2) to acquired DWI afforded a better lesion conspicuity without increasing
  acquisition time and was particularly useful in dense breasts.
• Despite the use of synthetic b-values, DWI was less sensitive and accurate than DCE-MRI for breast cancer detection.
• A multiparametric MRI modality still remains the best approach having the highest accuracy for breast cancer detection and
  thus reducing the number of unnecessary biopsies.

Electronic supplementary material The online version of this article
(https://doi.org/10.1007/s00330-020-07094-z) contains supplementary
material, which is available to authorized users.

* Katja Pinker-Domenig                                                       4
                                                                                 Department of Imaging, A.C.Camargo Cancer Center, SP São
  pinkerdk@mskcc.org; katja.pinker-domenig@meduniwien.ac.at                      Paulo, Brazil
                                                                             5
1
                                                                                 Department of Epidemiology and Biostatistics, Memorial Sloan
     Department of Radiology, Breast Imaging Service, Memorial Sloan             Kettering Cancer Center, 1275 York Ave, New York, NY 10065,
     Kettering Cancer Center, 300 E 66th Street, New York, NY 10065,             USA
     USA                                                                     6
2
                                                                                 Department of Biomedical Imaging and Image-guided Therapy
     Department of Radiology, Breast Imaging Division, Istituto Europeo          Division of Molecular and Gender Imaging, Medical University of
     di Oncologia, Via Giuseppe Ripamonti, 435, 20141 Milano, Italy              Vienna, Waehringer Guertel 18-20, 1090 Vienna, Austria
3
     Department of Medical Physics, Memorial Sloan Kettering Cancer
     Center, 1275 York Ave, New York, NY 10065, USA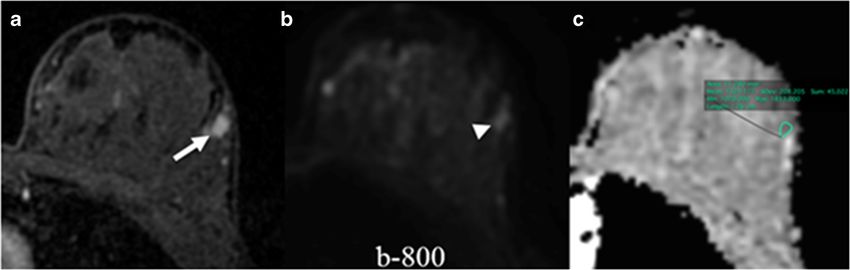
Eur Radiol (2021) 31:356–367                                                                                                      357

Keywords Breast tumors . Image analysis . Diagnostic imaging . Diffusion magnetic resonance imaging . Echo-planar imaging

Abbreviations                                                      without increasing the scan time or reducing the image quality
ADC     Apparent diffusion                                         (in fact, synthetic b-values present a higher image quality than
        coefficient                                                the acquired b-values) [22] and therefore have the potential to
AUC     Area under the ROC curve                                   improve the sensitivity of breast cancer detection.
CI      Confidence interval                                           The aim of our study was to assess lesion visibility and the
DCIS Ductal carcinomas in situ                                     diagnostic performance of DWI for breast cancer detection by
DWI     Diffusion-weighted                                         the addition of different synthetic b-values.
        imaging
EPI     Echo-planar imaging
FGT     Fibroglandular tissue                                      Materials and methods
IDC     Invasive ductal carcinoma
ILC     Invasive lobular                                           Patients
        carcinoma
NME Non-mass enhancing                                             This single-institution study and retrospective data analysis
NPV     Negative predictive value                                  was approved by the Institutional Review Board and was con-
PPV     Positive predictive value                                  ducted in compliance with the Health Insurance Portability
ROC     Receiver operating curve                                   and Accountability Act.
ROI     Region of interest                                             Between September 2018 and March 2019, 84 consecutive
STIR Short TI                                                      women who underwent a breast MRI examination (including
        inversion-recovery                                         DCE-MRI and DWI) at our institution and fulfilled the inclu-
                                                                   sion criterion of presenting with an enhancing lesion on DCE-
                                                                   MRI (categories 2–5 of the Breast Imaging Reporting and Data
Introduction                                                       System (BI-RADS)) were included in this study. Indications for
                                                                   an MRI examination in these women included screening
Diffusion-weighted imaging (DWI) is increasingly incorpo-          (46.2%), extent of the disease and surgical planning (33.8%),
rated into breast MRI protocols worldwide [1–3]. DWI using         inconclusive findings in other imaging modalities (6.2%), MRI
apparent diffusion coefficient (ADC) mapping has reported          follow-up examinations for previous findings (5%), evaluation
sensitivities of up to 96% and specificities of up to 100% for     of recurrent tumor (6.3%), and nipple discharge (2.5%). Patients
breast cancer detection [4, 5]. Currently, the prime focus of      undergoing chemotherapy; pregnant women; and those under-
DWI is to differentiate between benign and malignant lesions       going examinations without DWI series, a biopsy-proven his-
to prevent unnecessary breast biopsies. With the recent con-       tology, or at least lesion stability for 24 months were excluded.
cerns regarding the safety of gadolinium-based contrast agents         Due to technical failure of the DWI sequence and the presence
(GBCAs) [6–8], DWI has been proposed as a promising al-            of a clip/biopsy change generating obvious image distortion, four
ternative to dynamic contrast-enhanced magnetic resonance          patients were excluded, resulting in a final study population of 80
imaging (DCE-MRI) to detect early breast cancer without            women (mean age 48.1 ± 12.5 years; range 26–76 years) with
the costs and safety concerns associated with GBCAs [9–14].        103 breast lesions. Forty-five of these patients were pre-
   Several studies have demonstrated that the sensitivity of       menopausal (56.25%) and 35 were post-menopausal (43.75%).
unenhanced MRI with DWI was equal to or superior to mam-
mography [4, 15]; however, there is still room for improvement     MRI examination
[16]. Diffusion sensitivity, better known as “b-value,” has im-
portant implications for tumor conspicuity and can be con-         All the examinations were performed using a 3-T MRI scan-
trolled by modifying the magnitude and duration of the diffu-      ner (Discovery MR750; GE Healthcare) with a dedicated 16-
sion gradients. Higher b-values seem to improve lesion conspi-     channel phased-array breast coil (Sentinelle Coil, Hologic).
cuity by suppressing the normal breast tissue and decreasing the   All the women underwent a state-of-the-art multiparametric
T2 shine-through effect [17]. Nevertheless, they require long      MRI (mpMRI) protocol with T2-weighted imaging, DCE-
examination times and the image quality may be compromised         MRI, and DWI. DW images were always acquired before
due to a low signal-to-noise ratio [18]. Synthetic b-values may    contrast agent injection using a single-shot echo-planar imag-
overcome these limitations. Synthetic b-values are generated       ing (EPI) sequence with 0 and 800 s/mm 2 b-values
through a mathematical computation technique from at least         (Supplemental Table 1, Supplemental Digital Content 1).
two different lower b-values in a voxelwise manner [19–21]         Synthetic DWI b-values 1000, 1200, 1500, and 1800 s/mm2
358 Eur Radiol (2021) 31:356–367
were automatically generated from the acquired b-values DCE-MRI
using a built-in software. Synthetic b-values were selected
based on previous literature [23, 24]. After a wash-out period of at least 21 days, DCE-MRI alone
was read. Readers classified lesions according to BI-RADS
classification [26]. Lesions categorized as BI-RADS 2/3
Image analysis were considered non-suspicious, whereas categories BI-
RADS 4/5 were considered suspicious for malignancy.
Three dedicated breast radiologists (I.D., R.L., and C.S.) with Consequently, the results for both readings were reviewed
4–5 years of experience in interpretation of multiparametric in consensus for missed lesions on DWI or a lesion mis-match
breast MRI evaluated images independently using OsiriX between DCE-MRI and DWI. In the case of mis-matched or
v.9.0 software (OsiriX). Readers were aware of the presence missed lesions on DWI by one or two of the readers, they were
of lesions in all the examinations but were blinded to any asked to obtain ADC values for lesion categorization. Lesions
clinical information and conventional and prior imaging. missed by all the readers were excluded for categorization.
The mean ADC values for all the lesions across readers were
then determined (Supplemental Table 2, Supplemental Digital
DWI Content 1). Categories for breast composition of
fibroglandular tissue (FGT) were recorded for each examina-
Readers first assessed DW images (b-800, b-1000, b-1200, b- tion based on its report (A-almost entirely fat, B-scattered
1500, and b-1800 s/mm2) and ADC maps blinded to the DCE- FGT, C-heterogeneous FGT, and D-extreme FGT).
MRI. For all the lesions, visibility using each b-value (yes/no),
location, and laterality were recorded. If more than one lesion Multiparametric MRI
was visible, all lesions were recorded. A visual grading image
quality score (1 = bad quality, 2 = average, 3 = good quality) was mpMRI with DWI and DCE-MRI was evaluated using an
assigned by each reader for all the b-values based on artifacts and ADC cutoff value of 1.3 × 10⁻³ mm2/s as recommended by
fat suppression. In addition, a preferred b-value was selected by the European Society of Breast Imaging [15]. A final lesion
each reader based on lesion conspicuity defined as the visual classification was given as follows: If a BI-RADS 4 or 5 was
difference in lesion contrast with the surrounding parenchyma. assigned on DCE-MRI, an ADC > 1.3 × 10⁻³ mm2/s was re-
One 2D region of interest (ROI) per lesion and reader quired to assign a final classification as non-suspicious. If a BI-
was drawn manually on ADC maps derived from acquired RADS 2 or 3 was assigned, an ADC ≤ 1.3 × 10⁻³ mm2/s was
b-values using the OsiriX v.9.0 software (OsiriX). The ROI required to assign a final classification as suspicious.
was placed in a slice containing the tumor maximum diam-
eter and within the area with the lowest ADC values. Histopathology
Each reader assigned a 1–5 malignancy score to DW images
(from 1 = non-suspicious to 5 = highly suspicious) using ac- The final diagnosis was established by histopathology
quired and preferred synthetic b-values for each visible lesion. using image-guided needle biopsy for the majority of the
The criteria for this score included qualitative parameters based lesions (n = 98). In the event of discordant findings between
upon the previous literature [15, 25] as well as quantitative histopathology and imaging, the final diagnosis was
ADC values extracted from ADC maps as shown in Table 1. established surgically (n = 2). Benignity was confirmed in
Scores 4 and 5 were considered suspicious for malignancy, three lesions by imaging follow-up of up to 24 months.
whereas scores 1, 2, and 3 were considered non-suspicious.
Statistical analysis
All calculations were performed using SPSS 25.0 (IBM) and
SAS 9.4 (SAS Institute) in a per-lesion analysis. Median and
Table 1 Criteria for DWI malignancy score
mean ranks were calculated for image quality and preferred b-
Descriptor DWI + ADC map values. Sensitivity, specificity accuracy, and their 95% confi-
dence intervals (CI) were calculated for the imaging methods
Suspicious Not suspicious and averaged over the three readers [27]. Likewise, diagnostic
Internal signal Heterogeneous Homogeneous parameters for breast cancer detection were obtained for each
Shape Irregular/angulated Round/oval
imaging modality for lesions stratified by size (small lesions
ADC ≤ 1.3 × 10⁻³ mm2/s > 1.3 × 10⁻³ mm2/s
≤ 10 mm and lesions > 1 mm). Receiver operating curves
(ROC) were obtained using the PROC GLIMMIX statement
DWI, diffusion-weighted image; ADC, apparent diffusion coefficient in SAS 9.4 (SAS Institute) by treating each reader’s assessmentEur Radiol (2021) 31:356–367 359
as a fixed effect and estimating a robust (sandwich) measure of Overall lesion visibility with DWI
variance to account for the correlation between multiple readers
[28]. The epidemiological parameters and the areas under the No mis-matched lesions with DCE-MRI were identified.
ROC curves (AUC) were compared between the three diagnos- The percentage of enhancing lesions identified on DWI
tic modalities by using chi-square tests [29]. Bonferroni’s cor- was 82.5% for reader 1 (r1), 78.6% for reader 2 (r2), and
rection was made for multiple pairwise comparisons (α = 0.016). 81.5% for reader 3 (r3). DWI visualized 84–90% of the
Cohen’s κ and concordance correlation coefficient statis- malignant enhancing lesions. Results of missed lesions by
tics were used to determine the concordance between imaging reader are summarized in Table 3. Readers missed the same
methods and readers [30]. The inter-reader agreement be- number of malignant lesions in acquired b-800 s/mm2 and
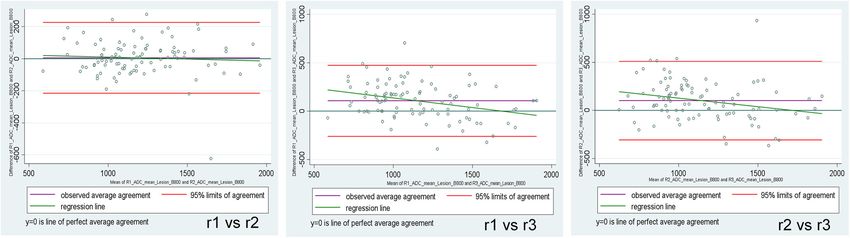
tween ADC measurements was documented using Bland– synthetic b-1000/b-1200 s/mm2 images (r1: 8, r2: 10, r3: 6).
Altman plots where the ADC mean was used. Fewer tumors were visualized at higher b-values b-1500
(r1: 10, r2: 12, r3: 6) and b-1800 s/mm2 (r1: 11, r2: 14, r3:
11).
DWI performed poorly for lesion visibility of small tu-
Results mors (< 10 mm) and benign lesions, especially synthetic b-
1800 s/mm2 values. Results for missed lesions stratified by
One hundred and three lesions (91 enhancing masses and 12 reader and b-values are summarized in Supplemental
non-mass lesions (NMLE)) from 80 women were assessed Table 4 in the Electronic Supplementary Material.
including 64 malignant tumors (mean size 23 mm; range 5– Figure 1 shows an example of a benign lesion not seen by
100 mm) and 39 benign lesions (mean size 8 mm; range 5– extremely high b-values.
22 mm). Histological results are shown in Table 2. Breast Among the lesions missed by all the readers (10 enhanc-
composition of these women included 37 (46.2%) women ing lesions representing 9.7%), one 8-mm malignant
within categories A/B and 43 (53.8%) women within cate- NMLE was not visible on DWI due to being included in
gories C/D. the gap between slices in DWI. The remaining nine lesions
included 4 NMLE (mean size 11.7 mm; range 6–20 mm), of
which two were < 10 mm and 5 masses < 10 mm (mean size
Visual grading image quality score 5.6 mm; range 5–8 mm) with an overall mean lesion size of
8.3 mm. Histology of missed tumors was benign in five
Acquired b-800 s/mm2 was the best rated by all the readers in cases (one benign breast parenchyma (NMLE), one papil-
terms of image quality, whereas synthetic b-1800 s/mm2 was loma (mass), two fibroadenomas (masses), and one un-
the worst rated. Mean image quality scores for the different b- changed lesion on follow-up (mass)) and malignant in four
values are summarized in Supplemental Table 3 in the cases (two ductal carcinomas in situ (DCIS) (NMLE), one
Electronic Supplementary Material. invasive ductal carcinoma (IDC) grade I (mass), and one
Table 2 Histopathology of all lesions stratified by benignity and malignancy
Benign lesions (n = 39) (37.9%) Malignant lesions (n = 64) (62.1%)
Fibroadenoma 16 (15.6%) IDC Total 53 (51.5%)
Fibrocystic changes 4 (3.9%) Low grade 4 (3.9%)
Benign breast parenchyma 2 (1.9%) Intermediate grade 25 (24.3%)
High grade 24 (23.3%)
DCIS associated 12 (22.6%)
ALH 1 (0.9%) ILC 5 (4.8%)
PASH 5 (4.9%)
Papilloma 2 (1.9%)
ADH 1 (0.9%) DCIS 6 (5.8%)
Hamartoma 1 (0.9%)
Benign unchanged (at least 2-year follow-up) 3 (2.9%)
Stromal fibrosis and adenosis 3 (2.9%)
LCIS 1 (0.9%)
ALH, atypical lobular hyperplasia; PASH, pseudoangiomatous hyperplasia; ADH, atypical ductal hyperplasia; IDC, invasive ductal carcinoma; ILC,
invasive lobular carcinoma; DCIS, ductal carcinoma in situ; LCIS, lobular carcinoma in situ360 Eur Radiol (2021) 31:356–367
Table 3 Lesions not visible with DWI for all readers
Histology Reader 1 Reader 2 Reader 3 Lesions missed by all readers
Benign 10 12 13 5
Malignant 8 10 6 5
Total of missed lesions 18 (17.5%) 22 (21.4%) 19 (18.5%) 10 (9.7%)
Mean lesion size (range) 7.7 mm (5–20 mm) 8.7 mm (5–22 mm) 7.9 mm (5–20 mm) 8.3 mm (5–20 mm)
% of lesions visualized with DWI 82.5% 78.6% 81.5%
invasive lobular carcinoma (ILC) (NMLE)). Figure 2 shows composition categories C/D. In this subgroup, readers pre-
an example of a missed lesion by all the readers. ferred higher b-values (r1: b-1500; r2: b-1200; and r3:
b-1500 s/mm2).
Preferred synthetic b-value
Breast cancer detection
2
Synthetic b-values 1200–1500 s/mm provided the best lesion
Diagnostic parameters for DWI, DCE-MRI, and mpMRI are
conspicuity across all readers. Reader 1 preferred b-1500
summarized in Table 4.
s/mm 2, while readers 2 and 3 preferred b-1200 s/mm 2.
Benign lesions were more conspicuous at lower b-values,
while malignant tumors appeared brighter than the surround- DWI and DCE-MRI
ing parenchyma at high b-values (Fig. 3). Readers preferred
lower b-values for benign lesions (r1: b-1000; r2: b-800; and DWI was significantly less sensitive than DCE-MRI
r3: b-1200 s/mm2) and higher b-values for malignant tumors (62.8% vs 90%, p < 0.0001). However, DWI was signifi-
(r1: b-1500; r2: b-1200; and r3: b-1500 s/mm2). This was cantly more specific than DCE-MRI (86.3% vs 65.7%,
particularly relevant in relation to the amount of FGT. p < 0.0001). DWI detected fewer cancers than DCE-
Twenty-nine malignant lesions were found within breast MRI, with 21 (reader 1) and 23 (readers 2 and 3) false
Fig. 1 Axial contrast-enhanced (a), acquired DWI (b), and synthetic 10−6 mm2/s. This lesion was correctly categorized as non-suspicious in
DWI (c) images of a patient with a 10-mm biopsy-proven both DWI and DCE-MRI. DWI, diffusion-weighted imaging; ADC,
fibroadenoma in the third posterior depth of the right breast. This apparent diffusion coefficient; DCE-MRI, dynamic contrast-enhanced
benign lesion is less conspicuous at higher b-values being barely visible magnetic resonance imaging
at b-1500 and b-1800 s/mm2. ADC mean value for this lesion was 1850 ×Eur Radiol (2021) 31:356–367 361 Fig. 2 Axial images of a biopsy-proven DCIS in a patient with dense indistinguishable either in the acquire DWI b-800 (b) or the synthetic b- breast. Contrast-enhanced image (a) shows a 14-mm non-mass values (c). DCIS, ductal carcinoma in situ; DWI, diffusion-weighted enhancement in the posterior third of the right breast (arrow) in the imaging middle third. All readers missed this lesion on DWI which was negative cases on DWI (Supplemental Table 5, Electronic Multiparametric MRI Supplementary Material). Figure 4 shows a case of a false negative on DWI. DWI had a significantly lower diagnos- mpMRI using DCE-MRI and DWI significantly maximized tic accuracy for breast cancer detection (71% vs 80.7%, the sensitivity compared with using DWI alone (95.5% vs p = 0.003). When comparing the diagnostic performance 62.8%, p < 0.0001) but was not significantly different than of DWI and DCE-MRI, DWI achieved a lower AUC (0.82 DCE-MRI (95.5% vs 90%, p = 0.02). mpMRI maintained a vs 0.89, p = 0.14). high specificity compared with DWI alone (75.5% vs 86.3%, Fig. 3 Axial images of a 47-year-old woman with dense breasts. value for this lesion was 1266 × 10−6 mm2/s. This lesion was correctly Contrast-enhanced image (a) shows a 52-mm NMLE in the outer categorized as suspicious in both DWI and DCE-MRI. NMLE, non-mass quadrants of the right breast. Biopsy proved a high-grade invasive lesion; DWI, diffusion-weighted imaging; ADC, apparent diffusion ductal carcinoma. DWI acquired image (b) and synthetic images (c) are coefficient; DCE-MRI, dynamic contrast-enhanced magnetic resonance depicted. An increased lesion-to-normal-tissue contrast at synthetic high imaging b-values due to suppression of the glandular signal is noticed. ADC mean
362 Eur Radiol (2021) 31:356–367
DCE-MRI vs mpMRI
DWI, diffusion-weighted image; ADC, apparent diffusion coefficient; DCE-MRI, contrast-enhanced magnetic resonance image; mpMRI, multiparametric magnetic resonance image; CI, confidence interval
p = 0.02). mpMRI was significantly more accurate than DWI
(88.2% vs 71%, p < 0.0001) and DCE-MRI (88.2% vs 80.7%,
p = 0.010) across all readers. When comparing the diagnostic
performance of mpMRI with DWI and DCE-MRI, mpMRI
0.022
0.065
0.010
0.500
0.507
0.226
1.000
0.625
0.687
achieved a better AUC than DWI (0.92 vs 0.82, p = 0.05) and
DCE-MRI (0.92 vs 0.89, p = 0.64), although these differences
were not significant. Figure 5 shows ROC curves comparing
DWI, DCE-MRI, and mpMRI.
DWI vs mpMRI
When stratifying lesions by size, DWI was less accurate for
lesions ≤ 10 mm than for lesions over 10 mm (64.2% vs 73%).
Although mpMRI showed better accuracy than DCE-MRI in
0.000
0.025
0.000
0.001
0.625
0.057
0.000
1.000
0.001
both subgroups, a significant difference was achieved only
when both groups were considered. The number of false pos-
itives with mpMRI was consistently lower than with DCE-
MRI in both groups, with a higher reduction in the group of
DWI vs DCE-MRI
lesions ≤ 10 mm. Results are shown in Supplemental Table 6
in the Electronic Supplementary Material. All misclassified
benign lesions on DCE-MRI which were correctly classified
p values
0.000
0.000
0.003
0.007
0.179
0.629
0.000
0.500
0.012
by the addition of ADC values were BI-RADS 4 except two
cases classified as BI-RADS 5 by reader 2 (one 13 mm
fibroadenoma and one 7 mm NMLE pseudoangiomatous hy-
perplasia in a patient with a contralateral cancer).
95.5% (91.4–99.6)
75.5% (66.9–84.1)
88.2% (81.7–94.7)
92.8% (66.2–99.8)
78.5% (58.9–91.7)
97.9% (88.4–99.8)
83.4% (35.9–99.6)
96.1% (86.7–99.4)
83.4% (68.6–93)
Average % (CI)
Inter-reader agreement
mpMRI
DWI inter-reader agreement was moderate to high for lesion
visibility (κ = 0.41–0.63), preferred b-value (κ = 0.47–0.56),
Average values of the diagnostic parameters for DWI, DCE, and multiparametric MRI
DWI malignancy score (κ = 0.63–0.76), and DCE-MRI
assigned BI-RADS (κ = 0.61–0.65). Inter-reader agreement
65.7% (56.2–75.2)
80.7% (72.8–88.6)
78.5% (49.3–95.2)
71.5% (55.4–84.2)
97.9% (88.4–99.8)
49.9% (11.9–88.2)
92.4% (81.4–97.9)
for image quality ranged from fair to high (κ = 0.30–0.86)
67.7% (47.7–84)
Average % (CI)
across all b-values. The highest level of inter-reader agree-
90% (84–96)
DCE-MRI
ment was for b-800 s/mm2 (average κ = 0.65), whereas the
lowest κ value was for b-1800 s/mm2 (average κ = 0.52).
Inter-reader agreement for image quality of the intermediate
b-values was similar across all readers (average κ = 0.58).
Details for inter-reader agreement are shown in Table 5.
62.8% (53.1–72.5)
86.3% (79.4–93.2)
21.34% (4.6–50.8)
85.8% (67.3–95.9)
64.2% (47.9–78.5)
83.4% (35.9–99.6)
ADC achieved a high to almost perfect agreement between
71.7% (56.5–84)
71% (61.9–80.1)
73% (58.9–84.4)
Average % (CI)
readers (rho_c = 0.90–0.73) (shown in Fig. 6).
DWI
Discussion
DWI has been proposed as an unenhanced option for breast
Specificity
Specificity
Specificity
Sensitivity
Sensitivity
Sensitivity
cancer screening by MRI. Synthetic b-values may improve
Accuracy
Accuracy
Accuracy
lesion visibility without increasing the acquisition time while
avoiding the disadvantages of performing DWI at very high b-
values (i.e., eddy current distortions). In this study, we
assessed DWI for tumor visibility and breast cancer detection
by a combination of acquired b-values (800 s/mm2), its ADC
Lesions > 10 mm
Lesions ≤ 10 mm
maps, and different synthetic b-values (1000, 1200, 1500, and
1800 s/mm2). Acquired b-800 and synthetic b-1000/1200
Table 4
Overall
s/mm2 values allowed the visualization of 84–90% of the ma-
lignant enhancing tumors in this study. Image quality scoreEur Radiol (2021) 31:356–367 363 Fig. 4 A case of a false negative in DWI. Axial images of a biopsy- location which yields an ADC mean value of 1324 × 10−6 mm2/s. This proven DCIS. Contrast-enhanced image (a) shows a 7-mm oval lesion was correctly categorized as malignant in DCE-MRI but irregular enhancing lesion (arrow) in the left breast. Acquired DWI b- categorized as benign in DWI. DWI, diffusion-weighted imaging; 800 (b) shows an oval apparently restricting lesion (arrowhead). The DCIS, ductal carcinoma in situ; ADC, apparent diffusion coefficient; ADC map (c) shows a region of interest drawn in the corresponding DCE-MRI, dynamic contrast-enhanced magnetic resonance imaging was lower for b-1500/1800 s/mm2 values; these values (espe- missed with DWI were either small or NMLE [16, 31, 32]. cially the latter value) missed a higher number of lesions. This is potentially problematic if one of the future roles of Synthetic b-values of 1200–1500 s/mm2 provided the best DWI is to be a reliable tool in breast cancer detection and lesion conspicuity. Benign lesions were more conspicuous at not only in the characterization of lesions found in other im- lower b-values, while malignant tumors appeared brighter aging modalities. An improvement in the resolution of DWI than the surrounding parenchyma at higher b-values, especial- sequence would be desirable to enhance cancer detection. ly in breast composition categories C/D. Despite the use of Regarding synthetic b-values, readers were able to identify synthetic b-values, DWI was less sensitive and accurate than the same number of cancers using synthetic b-values of DCE-MRI for breast cancer detection. mpMRI maintained an 1000/1200 s/mm2 and the acquired b-value of 800 s/mm2. In excellent sensitivity and a high specificity compared with contrast, synthetic b-values of 1500 and 1800 s/mm2 missed DCE-MRI and DWI alone and, therefore, significantly in- more lesions, probably due to a reduction in image quality. creased the accuracy compared with both modalities Most of the studies have almost exclusively focused on the separately. visibility of breast cancer [20, 22, 33–36]; therefore, there is In this study, we showed that 78–82% of the lesions visible limited information on the conspicuity of benign breast lesions with DCE-MRI were visualized with DWI alone including at high or synthetic b-values. While Chen et al [37] found no both benign and malignant breast lesions. Among those le- significant differences in conspicuity grades using b-values of sions missed, the majority of them were either small (≤ 10 600, 800, and 1000 s/mm2, our results point to a difference in mm) or NMLE. This is in agreement with prior studies inves- conspicuity. Benign lesions were more conspicuous at lower tigating DWI with ADC mapping that showed that lesions b-values, while malignant tumors appeared brighter than the Fig. 5 Results of pairwise comparisons between the receiver operating curves (ROCs) and the area under the curve (AUC) for each diagnostic modality
364                                                                                                                    Eur Radiol (2021) 31:356–367

Table 5 Inter-reader agreement (weighted κ values) for diffusion-weighted images (DWI) and dynamic contrast-enhanced MR images (DCE-MRI)
parameters

                                                                              r1 vs r2             r1 vs r3            r2 vs r3           Average

DWI                    b-800 s/mm2                Lesion visibility           0.42                 0.62                0.46               0.50
                                                  Image quality               0.86                 0.60                0.48               0.65
                       b-1000 s/mm2               Lesion visibility           0.41                 0.62                0.50               0.51
                                                  Image quality               0.76                 0.52                0.46               0.58
                       b-1200 s/mm2               Lesion visibility           0.42                 0.66                0.48               0.52
                                                  Image quality               0.76                 0.52                0.46               0.58
                       b-1500 s/mm2               Lesion visibility           0.56                 0.5                 0.52               0.53
                                                  Image quality               0.76                 0.52                0.46               0.58
                       b-1800 s/mm2               Lesion visibility           0.63                 0.51                0.60               0.58
                                                  Image quality               0.79                 0.46                0.30               0.52
                       Preferred b-value                                      0.47                 0.56                0.47               0.50
                       Malignancy score                                       0.76                 0.63                0.74               0.71
                       *ADC mean                                              0.90                 0.77                0.73               0.80
DCE-MRI                BI-RADS                                                0.65                 0.63                0.61               0.63

*Apparent diffusion coefficient (ADC) values for reader’s agreement are expressed using the rho concordant correlation coefficient

surrounding parenchyma at high b-values. The increased con-                     Nevertheless, it is worth mentioning that ADC (maps and
spicuity of breast cancer at high b-values has been demonstrat-             values) can only be derived from acquired DW images.
ed by other studies with a wider range of b-values than Chen                Synthetic high b-value images are obtained by extrapolating
et al [17, 38].                                                             signals acquired at lower b-values (e.g., 0 and 800 s/mm2),
    An improved conspicuity of malignant tumors at high b-                  assuming a Gaussian model. However, diffusion in tissues is
values could be particularly helpful in dense breasts, where                not Gaussian [2]. The calculation of synthetic high b-values is
lesions can be mammographically masked by the large                         just a strategy to enhance contrast already present in lower b-
amount of FGT. In addition, an improvement of tumor visi-                   value images and is potentially useful to detect and depict
bility without contrast injection could improve the cost-                   lesions but lacks the power of non-Gaussian diffusion to char-
effectiveness of MRI [39]. However, extremely high b-values,                acterize tissues [40].
i.e., b-1800 s/mm2, have a low signal which can cause lesions                   Although synthetic b-values over 1000 s/mm2 have demon-
located on the fat tissue to be overlooked, especially if fat is            strated an improvement in tumor visualization and image qual-
poorly suppressed [33]. In light of our results, b-1200 s/mm2               ity [19, 20, 22, 34, 35, 40–43], DCE-MRI outperforms DWI for
could be the best option for an optimal lesion visualization                breast cancer visualization and detection with a higher sensitiv-
with the best conspicuity, which could enhance lesion charac-               ity across all readers. This is in accordance with the current
terization by a better correlation on ADC maps and more                     literature: DCE-MRI outperforms unenhanced MRI with or
accurate ADC values.                                                        without supportive sequences for cancer visualization [9, 16].

Fig. 6 Bland–Altman plots for ADC mean inter-reader agreement.              agreement. The coefficient’s proximity to 1 indicates better agreement
Deviation of the observed data from the line of perfect concordance         between two readers for that imaging parameter. ADC, apparent
(line at 45° on a square scatterplot) was used as a measure of              diffusion coefficient; r, reader
Eur Radiol (2021) 31:356–367 365
In particular, tumors such as DCIS or NMLE exhibit a lower In conclusion, the addition of synthetic high b-values (e.g.,
signal intensity in DWI and, therefore, are prone to be 1200s/mm2) improves tumor conspicuity without increasing
overlooked with unenhanced MRI, especially at high b-values the time of scan, which is particularly helpful in dense breasts.
[44]. These limitations are to be addressed to enable Nevertheless, the role of DWI for the visualization of NMLE
unenhanced MRI in a screening setting, where tumors tend to and small lesions and its performance in breast cancer detec-
be smaller and NMLE lesions are clinically undetectable. In tion are still not definite. mpMRI remains the best modality for
addition, these types of lesions account for false negative cases lesion detection with the best accuracy which is particularly
in DWI. In our study, a high number of IDC cases exhibited helpful in MRI screening patients and obviates unnecessary
associated DCIS which could explain a slightly lower sensitiv- biopsies in benign lesions.
ity for DWI compared with other studies [4]. Based on our
results, DWI alone would currently have no role in the work- Funding information Open access funding provided by Medical
University of Vienna. This study received funding from the NIH/NCI
up of indeterminate lesions (e.g., BI-RADS IVa and IVb le-
Cancer Center Support Grant (P30 CA008748), the Breast Cancer
sions), especially in small ones where its accuracy was lower Research Foundation, Susan G. Komen, Spanish Foundation Alfonso
mainly at the expense of a decrease in sensitivity. In this sub- Martin Escudero, and the European School of Radiology.
group, the sensitivity and accuracy for DCE-MRI were also
reduced since there is a difficulty in distinguishing morpholog- Compliance with ethical standards
ical features. In these cases, mpMRI continued showing the best
accuracy although no significant differences with DCE-MRI Guarantor The scientific guarantor of this publication is Katja Pinker,
were found. Nevertheless, there was an additional value in the MD, PhD.
combination of DWI and DCE-MRI: a decrease in the number
Conflict of interest The authors of this manuscript declare no relation-
of false positives. This was particularly relevant in the group of ships with any companies, whose products or services may be related to
small lesions ≤ 10 mm which included most of the benign the subject matter of the article.
lesions in our study sample. This is important to prevent unnec-
essary follow-up examinations in indeterminate lesions as well Statistics and biometry One of the authors (Varadan Sevilimedu,
as benign breast biopsies, which increase costs and patient MBBS, DrPH) has significant statistical expertise.
anxiety.
Informed consent Written informed consent was waived by the
These results match previous publications investigating a Institutional Review Board.
combined DWI and DCE-MRI approach for breast cancer
detection [16, 45–47]. Ethical approval Institutional Review Board approval was obtained.
Overall, inter-reader agreement was moderate to high for
all the parameters assessed. Lesion visibility at b-800 s/mm2 Methodology
achieved the lowest agreement, which could point to a more • retrospective
• observational
consistent performance of synthetic b-values for lesion visi- • performed at one institution
bility. Inter-reader agreement was moderate for b-values ren-
dering the best tumor conspicuity (1200–1500 s/mm2). This Open Access This article is licensed under a Creative Commons
Attribution 4.0 International License, which permits use, sharing,
can be explained by the fact that readers preferred a range of b-
adaptation, distribution and reproduction in any medium or format, as
values rather than a specific value. Images at b-1800 s/mm2 long as you give appropriate credit to the original author(s) and the
were rated worst by all readers with respect to both lesion source, provide a link to the Creative Commons licence, and indicate if
conspicuity and image quality. changes were made. The images or other third party material in this article
are included in the article's Creative Commons licence, unless indicated
We acknowledge several limitations in our study. Firstly, no
otherwise in a credit line to the material. If material is not included in the
comparison was done with acquired high b-values to maintain article's Creative Commons licence and your intended use is not
clinical acquisition times. Secondly, the larger size of malignant permitted by statutory regulation or exceeds the permitted use, you will
lesions compared with the benign ones and the small number of need to obtain permission directly from the copyright holder. To view a
copy of this licence, visit http://creativecommons.org/licenses/by/4.0/.
pure DCIS, ILC, and NMLE compared with invasive carcino-
mas presenting with a mass may affect the results and their
generalization. Nevertheless, this population reflected the clin-
ical practice in our screening and tertiary assessment center
under the established inclusion criteria. Thirdly, synthetic b-
References
values generated from different DWI sequences may yield dif- 1. Partridge SC, Nissan N, Rahbar H, Kitsch AE, Sigmund EE (2017)
ferent visual and image quality results. In our study, a single- Diffusion-weighted breast MRI: Clinical applications and emerging
shot EPI DWI with a short TI inversion-recovery (STIR) fat techniques. J Magn Reson Imaging 45:337–355
suppression sequence was used, and therefore, our results may 2. Iima M, Honda M, Sigmund EE, Ohno Kishimoto A, Kataoka M,
Togashi K (2019) Diffusion MRI of the breast: current status and
not be extrapolated to other sequences.366 Eur Radiol (2021) 31:356–367
future directions. J Magn Reson Imaging. https://doi.org/10.1002/ 18. Burdette JH, Elster AD (2002) Diffusion-weighted imaging of ce-
jmri.26908 rebral infarctions: are higher B values better? J Comput Assist
3. Partridge SC, Newitt DC, Chenevert TL, Rosen MA, Hylton NM Tomogr 26:622–627
(2019) Diffusion-weighted MRI in multicenter trials of breast can- 19. Blackledge MD, Leach MO, Collins DJ, Koh DM (2011)
cer. Radiology 291:546 Computed diffusion-weighted MR imaging may improve tumor
4. Amornsiripanitch N, Bickelhaupt S, Shin HJ et al (2019) Diffusion- detection. Radiology 261:573–581
weighted MRI for unenhanced breast cancer screening. Radiology 20. Zhou J, Chen E, Xu H et al (2019) Feasibility and diagnostic per-
293:504–520 formance of voxelwise computed diffusion-weighted imaging in
5. Chen X, Li WL, Zhang YL, Wu Q, Guo YM, Bai ZL (2010) Meta- breast cancer. J Magn Reson Imaging 49:1610–1616
analysis of quantitative diffusion-weighted MR imaging in the dif- 21. Gatidis S, Schmidt H, Martirosian P, Nikolaou K, Schwenzer NF
ferential diagnosis of breast lesions. BMC Cancer 10:693 (2016) Apparent diffusion coefficient-dependent voxelwise com-
6. Runge VM (2017) Critical questions regarding gadolinium deposi- puted diffusion-weighted imaging: an approach for improving
tion in the brain and body after injections of the gadolinium-based SNR and reducing T2 shine-through effects. J Magn Reson
contrast agents, safety, and clinical recommendations in consider- Imaging 43:824–832
ation of the EMA’s Pharmacovigilance and Risk Assessment 22. O’Flynn EA, Blackledge M, Collins D et al (2016) Evaluating the
Committee recommendation for suspension of the marketing autho- diagnostic sensitivity of computed diffusion-weighted MR imag-
rizations for 4 linear agents. Invest Radiol 52:317–323 ing in the detection of breast cancer. J Magn Reson Imaging 44:
7. Dekkers IA, Roos R, van der Molen AJ (2018) Gadolinium reten- 130–137
tion after administration of contrast agents based on linear chelators 23. Thomassin-Naggara I, De Bazelaire C, Chopier J, Bazot M,
and the recommendations of the European Medicines Agency. Eur Marsault C, Trop I (2013) Diffusion-weighted MR imaging of the
Radiol 28:1579–1584 breast: advantages and pitfalls. Eur J Radiol 82:435–443
8. Gulani V, Calamante F, Shellock FG, Kanal E, Reeder SB (2017) 24. Dorrius MD, Dijkstra H, Oudkerk M, Sijens PE (2014) Effect of b
Gadolinium deposition in the brain: summary of evidence and rec- value and pre-admission of contrast on diagnostic accuracy of 1.5-T
ommendations. Lancet Neurol 16:564–570 breast DWI: a systematic review and meta-analysis. Eur Radiol 24:
2835–2847
9. Baltzer PAT, Bickel H, Spick C et al (2018) Potential of
25. Kul S, Metin Y, Kul M, Metin N, Eyuboglu I, Ozdemir O (2018)
noncontrast magnetic resonance imaging with diffusion-weighted
Assessment of breast mass morphology with diffusion-weighted
imaging in characterization of breast lesions: intraindividual com-
MRI: Beyond apparent diffusion coefficient. J Magn Reson
parison with dynamic contrast-enhanced magnetic resonance imag-
Imaging 48:1668–1677
ing. Invest Radiol 53:229–235
26. D’Orsi C, Sickles EA, Mendelson EB, Morris EA (2013) Breast
10. Trimboli RM, Verardi N, Cartia F, Carbonaro LA, Sardanelli F
imaging reporting and data system: ACR BI-RADS breast imaging
(2014) Breast cancer detection using double reading of unenhanced
atlas, 5th edn. American College of Radiology, Reston, Va
MRI including T1-weighted, T2-weighted STIR, and diffusion-
27. Hricak H, Gatsonis C, Coakley FV et al (2007) Early invasive
weighted imaging: a proof of concept study. AJR Am J
cervical cancer: CT and MR imaging in preoperative evaluation -
Roentgenol 203:674–681
ACRIN/GOG comparative study of diagnostic performance and
11. McDonald ES, Hammersley JA, Chou SH et al (2016) Performance interobserver variability. Radiology 245:491–498
of DWI as a rapid unenhanced technique for detecting 28. Xiao-Hua Zhou NAO, McClish DK (2011) Statistical methods in
mammographically occult breast cancer in elevated-risk women diagnostic medicine, 2nd edn. Wiley
with dense breasts. AJR Am J Roentgenol 207:205–216 29. Gonen M (2011) Analyzing receiver operating characteristic curves
12. Shin HJ, Chae EY, Choi WJ et al (2016) Diagnostic performance of with SAS. SAS Institute, Cary, NC
fused diffusion-weighted imaging using unenhanced or 30. Landis JR, Koch GG (1977) The measurement of observer agree-
postcontrast T1-weighted MR imaging in patients with breast can- ment for categorical data. Biometrics 33:159–174
cer. Medicine (Baltimore) 95:e3502 31. Partridge SC, Demartini WB, Kurland BF, Eby PR, White SW,
13. Bickelhaupt S, Laun FB, Tesdorff J et al (2016) Fast and noninva- Lehman CD (2010) Differential diagnosis of mammographically
sive characterization of suspicious lesions detected at breast cancer and clinically occult breast lesions on diffusion-weighted MRI. J
x-ray screening: capability of diffusion-weighted MR imaging with Magn Reson Imaging 31:562–570
MIPs. Radiology 278:689–697 32. Avendano D, Marino MA, Leithner D et al (2019) Limited role of
14. Baltzer PA, Benndorf M, Dietzel M, Gajda M, Camara O, Kaiser DWI with apparent diffusion coefficient mapping in breast lesions
WA (2010) Sensitivity and specificity of unenhanced MR mam- presenting as non-mass enhancement on dynamic contrast-
mography (DWI combined with T2-weighted TSE imaging, enhanced MRI. Breast Cancer Res 21:136
ueMRM) for the differentiation of mass lesions. Eur Radiol 20: 33. Tamura T, Takasu M, Higaki T et al (2019) How to improve the
1101–1110 conspicuity of breast tumors on computed high b-value diffusion-
15. Baltzer P, Mann RM, Iima M et al (2019) Diffusion-weighted weighted imaging. Magn Reson Med Sci 18:119–125
imaging of the breast-a consensus and mission statement from 34. Park JH, Yun B, Jang M et al (2019) Comparison of the diagnostic
the EUSOBI International Breast Diffusion-Weighted Imaging performance of synthetic versus acquired high b-value (1500
working group. Eur Radiol. https://doi.org/10.1007/s00330-019- s/mm(2)) diffusion-weighted MRI in women with breast cancers.
06510-3 J Magn Reson Imaging 49:857–863
16. Pinker K, Moy L, Sutton EJ et al (2018) Diffusion-weighted imag- 35. Cheng Q, Ye S, Fu C et al (2019) Quantitative evaluation of com-
ing with apparent diffusion coefficient mapping for breast cancer puted and voxelwise computed diffusion-weighted imaging in
detection as a stand-alone parameter: comparison with dynamic breast cancer. Br J Radiol 92:20180978
contrast-enhanced and multiparametric magnetic resonance imag- 36. Bickel H, Polanec SH, Wengert G et al (2019) Diffusion-weighted
ing. Invest Radiol 53:587–595 MRI of breast cancer: improved lesion visibility and image quality
17. Tamura T, Murakami S, Naito K, Yamada T, Fujimoto T, Kikkawa using synthetic b-values. J Magn Reson Imaging 50:1754–1761
T (2014) Investigation of the optimal b-value to detect breast tu- 37. Chen X, He XJ, Jin R et al (2012) Conspicuity of breast lesions at
mors with diffusion weighted imaging by 1.5-T MRI. Cancer different b values on diffusion-weighted imaging. BMC Cancer
Imaging 14:11 12:334Eur Radiol (2021) 31:356–367 367
38. Han X, Li J, Wang X (2017) Comparison and optimization of 3.0 t 44. Woodhams R, Inoue Y, Ramadan S, Hata H, Ozaki M (2013)
breast images quality of diffusion-weighted imaging with multiple Diffusion-weighted imaging of the breast: comparison of b-
b-values. Acad Radiol 24:418–425 values 1000 s/mm(2) and 1500 s/mm(2). Magn Reson Med Sci
39. Mann RM, Kuhl CK, Moy L (2019) Contrast-enhanced MRI for 12:229–234
breast cancer screening. J Magn Reson Imaging 50(2):377–390 45. Partridge SC, DeMartini WB, Kurland BF, Eby PR, White SW,
40. Rosenkrantz AB, Hindman N, Lim RP et al (2013) Diffusion- Lehman CD (2009) Quantitative diffusion-weighted imaging as
weighted imaging of the prostate: comparison of b1000 and an adjunct to conventional breast MRI for improved positive pre-
b2000 image sets for index lesion detection. J Magn Reson dictive value. AJR Am J Roentgenol 193:1716–1722
Imaging 38:694–700 46. Ei Khouli RH, Jacobs MA, Mezban SD et al (2010) Diffusion-
41. Maas MC, Futterer JJ, Scheenen TW (2013) Quantitative evalua- weighted imaging improves the diagnostic accuracy of convention-
tion of computed high B value diffusion-weighted magnetic reso- al 3.0-T breast MR imaging. Radiology 256:64–73
nance imaging of the prostate. Invest Radiol 48:779–786 47. Baltzer A, Dietzel M, Kaiser CG, Baltzer PA (2016) Combined
42. Moribata Y, Kido A, Fujimoto K et al (2017) Feasibility of com- reading of contrast enhanced and diffusion weighted magnetic
puted diffusion weighted imaging and optimization of b-value in resonance imaging by using a simple sum score. Eur Radiol 26:
cervical cancer. Magn Reson Med Sci 16:66–72 884–891
43. Fukukura Y, Kumagae Y, Hakamada H et al (2017) Computed
diffusion-weighted MR imaging for visualization of pancreatic ad-
enocarcinoma: comparison with acquired diffusion-weighted imag- Publisher’s note Springer Nature remains neutral with regard to jurisdic-
ing. Eur J Radiol 95:39–45 tional claims in published maps and institutional affiliations.You can also read