Diffusion weighted and dynamic contrast enhanced magnetic resonance imaging after radiation therapy for bone metastases in patients with ...
←
→
Page content transcription
If your browser does not render page correctly, please read the page content below
www.nature.com/scientificreports
OPEN Diffusion‑weighted and dynamic
contrast‑enhanced magnetic
resonance imaging after radiation
therapy for bone metastases
in patients with hepatocellular
carcinoma
Ji Hyun Lee1,3, Gyu Sang Yoo2,3, Young Cheol Yoon1*, Hee Chul Park2* & Hyun Su Kim1
The objectives of this study were to assess changes in apparent diffusion coefficient (ADC) and
dynamic contrast-enhanced (DCE) magnetic resonance imaging (MRI) parameters after radiation
therapy (RT) for bone metastases from hepatocellular carcinoma (HCC) and to evaluate their
prognostic value. This prospective study was approved by the Institutional Review Board. Fourteen
patients with HCC underwent RT (30 Gy in 10 fractions once daily) for bone metastases. The ADC
and DCE-MRI parameters and the volume of the target lesions were measured before (baseline) and
one month after RT (post-RT). The Wilcoxon signed-rank test was used to compare the parameters
between the baseline and post-RT MRI. The parameters were compared between patients with
or without disease progression in RT fields using the Mann–Whitney test. Intraclass correlation
coefficients were used to evaluate the interobserver agreement. The medians of the ADC, rate
constant [kep], and volume fraction of the extravascular extracellular matrix [ve] in the baseline and
post-RT MRI were 0.67 (range 0.61–0.72) and 0.75 (range 0.63–1.43) (× 10–3 mm2/s) (P = 0.027), 836.33
(range 301.41–1082.32) and 335.80 (range 21.86–741.87) (× 10–3/min) (P = 0.002), and 161.54 (range
128.38–410.13) and 273.99 (range 181.39–1216.95) (× 10–3) (P = 0.027), respectively. The medians
of the percent change in the ADC of post-RT MRI in patients with progressive disease and patients
without progressive disease were − 1.35 (range − 6.16 to 6.79) and + 46.71 (range 7.71–112.81)
(%) (P = 0.011), respectively. The interobserver agreements for all MRI parameters were excellent
(intraclass correlation coefficients > 0.8). In conclusion, the ADC, kep, and ve of bone metastases
changed significantly after RT. The percentage change in the ADC was closely related to local tumor
progression.
Abbreviations
ADC Apparent diffusion coefficient
DCE Dynamic contrast-enhanced
RT Radiation therapy
HCC Hepatocellular carcinoma
Ktrans Volume transfer constant
kep Rate constant
ve Volume fraction of the extravascular extracellular matrix
vp Blood plasma volume
1
Department of Radiology, Samsung Medical Center, Sungkyunkwan University School of Medicine, 81 Irwon‑ro,
Gangnam‑gu, Seoul 06351, South Korea. 2Department of Radiation Oncology, Samsung Medical Center,
Sungkyunkwan University School of Medicine, 81 Irwon‑ro, Gangnam‑gu, Seoul 06351, South Korea. 3These
authors contributed equally: Ji Hyun Lee and Gyu Sang Yoo. *email: youngcheol.yoon@gmail.com; rophc@
skku.edu
Scientific Reports | (2021) 11:10459 | https://doi.org/10.1038/s41598-021-90065-1 1
Vol.:(0123456789)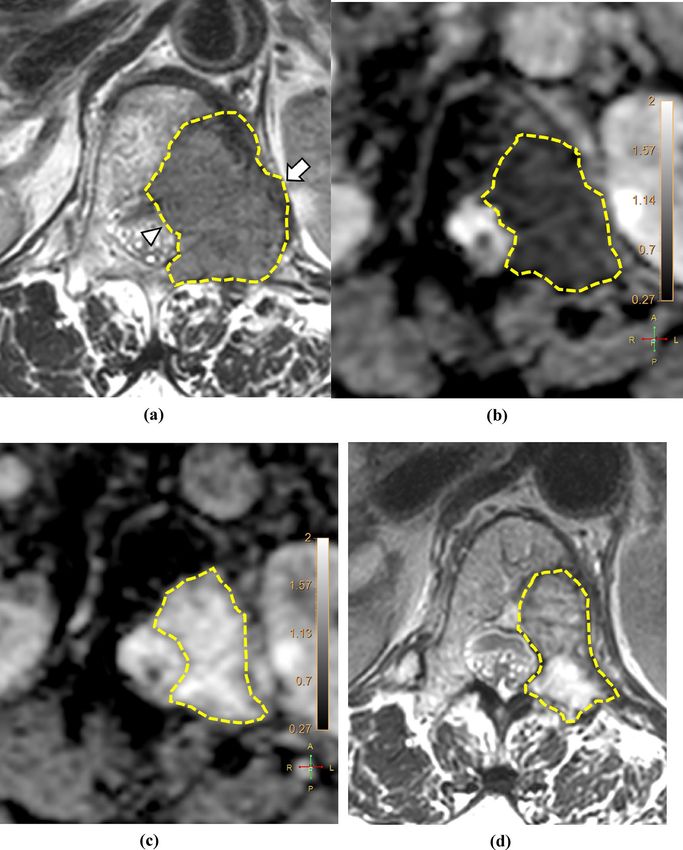
www.nature.com/scientificreports/
DW Diffusion weighted
T1WI T1-weighted image
T2WI T2-weighted image
ROI Regions of interest
CR Complete response
PR Partial response
PD Progressive disease
SD Stable disease
NRS Numeric rating scale
OMED Oral morphine equivalent dose
ROC Receiver operating characteristic
AUC Area under ROC curve
ICC Interclass correlation coefficient
Hepatocellular carcinoma (HCC) is the sixth most common cancer diagnosed worldwide and is the third leading
cause of cancer-related m ortality1. Despite advances in diagnostic imaging modalities and treatment strategies,
some patients present with tumor progression in the form of skeletal metastasis2, most commonly in the spine3.
This may result in skeletal-related events, including pathologic fracture, spinal cord compression, and neurologic
deficits, causing significant deterioration in patients’ quality of life2. Therefore, in addition to the control of the
primary tumor, appropriate management of bone metastases is considered mandatory in patients with HCC.
Although the standard treatment for metastatic HCC is systemic therapy with drugs such as sorafenib and
lenvatinib, the tumor responses are not s atisfactory4–6. In HCC patients with bone metastases, radiation therapy
(RT) is widely used for local palliation or the prevention of disease a ggravation7. However, patients experience
diverse tumor responses, and there is a significant rate of retreatment after conventional RT, which can be
attributed to local tumor progression8–10. Hence, a radiological tool predicting tumor progression after RT for
bone metastasis in HCC patients can aid in the selection of patients who may require supplementary therapy
after conventional RT.
Among various advanced MRI techniques, diffusion-weighted (DW) and dynamic contrast-enhanced (DCE)
MRI, which reflect the diffusion and perfusion properties of the tissues, respectively, have shown potential in
providing noninvasive quantitative information about tumor cellularity, biological aggressiveness, microenvi-
ronment, and angiogenesis11–13. In musculoskeletal imaging, DW imaging has been reported to be useful for
tumor characterization14–16 and treatment response evaluation17–20. DCE-MRI evaluates tumor perfusion and
vascularity21,22. In particular, quantitative estimations of the parameters using pharmacokinetic models have
shown promising results in terms of their correlation with the histologic features of tumors and the clinical
parameters in the musculoskeletal r egion23,24.
Radiation causes endothelial damage or alters angiogenic pathways, leading to the disruption of the vascular
structure and changing the blood flow of t umors25,26. Therefore, we hypothesized that RT alters the hemodynam-
ics and vascular characteristics as well as the tumor cellularity of bone metastases from HCC, which may be
detected using DW- and DCE-MRI. In this context, this study aimed to evaluate changes in DW- and DCE-MRI
parameters of bone metastases in patients with HCC after RT. Their prognostic value in predicting local tumor
progression was also assessed.
Materials and methods
This prospective study was approved by the Institutional Review Board (Samsung Medical Center, IRB File No.
2018-07-159), registered at cris.nih.go.kr (KCT0004861), and was conducted from February 2019 to July 2020.
Written informed consent was obtained from all patients and the study was conducted in accordance with the
declaration of Helsinki.
Patients. According to a previous study27, the volume transfer constant (Ktrans) after RT was expected to
decrease by 33.5% (standard deviation 28.9%). Using paired t-tests, the required sample size was calculated to be
10 in order to have a 90% chance of finding an average of 33.5% difference at a significance level of 5% (α = 0.05,
β = 0.10) (MedCalc Statistical Software version 19.1.5; MedCalc Software Ltd.). Therefore, assuming a dropout
rate of 25%, a total of 14 patients were required.
Patients with HCC who were scheduled to undergo RT for bone metastases were included if they (a) were
older than 18 years, (b) had a histopathological or imaging diagnosis of HCC, and (c) had metastases in the tho-
racic or lumbosacral spine or pelvic bone; patients with metastatic lesions in other locations were not included to
minimize unwanted contributions from any potential region-dependent biases. The criteria for considering bone
metastases from HCC included newly developed or progressed bone lesions noted during computed tomography
(CT) surveillance or histopathological confirmations by bone biopsies, where available. The exclusion criteria
were as follows: (a) another primary malignancy, (b) history of surgery, RT, or metallic instrumentation at the
above metastatic sites; (c) contraindication to gadolinium-based contrast agents or MRI examinations, or (d)
pregnant or nursing female patients. We collected clinical information, including sex, age, etiology of HCC,
Child–Pugh score, serum α-fetoprotein level, status of liver cirrhosis, concurrent systemic therapy, and survival.
Radiation therapy. All patients underwent RT with 30 Gy in ten fractions with once daily schedule. The
simulation with contrast-enhanced CT using a 2.5–5-mm slice thickness was performed within three days
before starting RT, on the same day as baseline MRI, following which RT was initiated. The gross tumor volume
was delineated according to baseline MRI. The clinical target volume included the gross tumor volume and the
Scientific Reports | (2021) 11:10459 | https://doi.org/10.1038/s41598-021-90065-1 2
Vol:.(1234567890)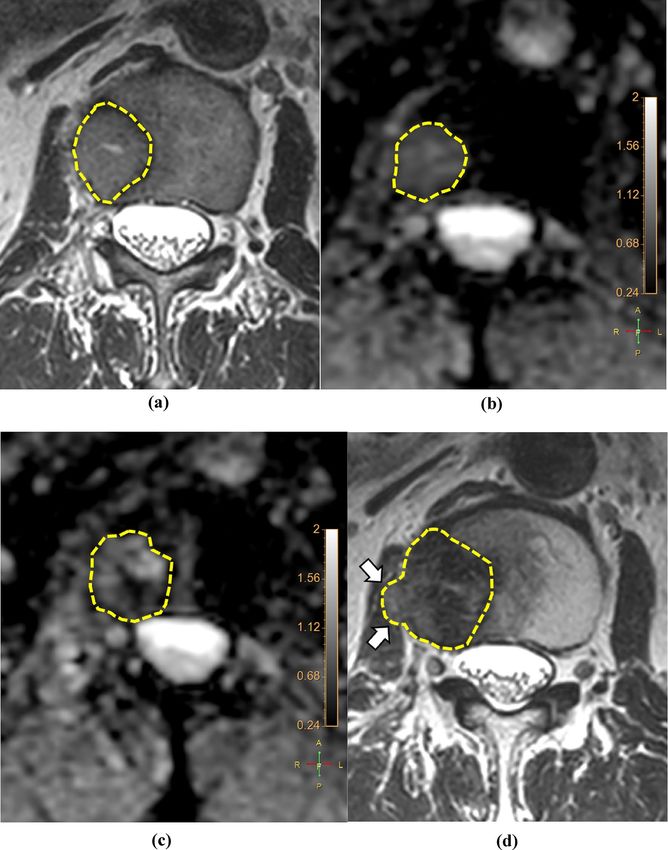
www.nature.com/scientificreports/
Postcontrast
Sagittal Coronal Axial DCE Postcontrast coronal Postcontrast
Axial T1WI Axial T2WI Sagittal T2WI T1WIa T1WIb Axial DWI image sagittal T1WI T1WIb
a
axial T1WI
TR (ms) 480.1–736.6 7042–16,361 3000–3159 609–830 540.8 2677.7–5710.4 13 468.2 451 609
TE (ms) 7.4–10 120 80–128 10 15 78 1.76 15 15 10
Acquisition 380 × 268– 379 × 223– 500 × 251– 500 × 251– 500 × 251– 380 × 268–
780 × 384 140 × 196 128 × 239 780 × 384
matrix 452 × 446 452 × 446 951 × 472 951 × 472 951 × 472 452 × 446
FOV (cm) 36–38 36–38 28–36 28–36 35 35 35 28–36 35 36–38
Thickness
2.5 2.5 4 4 5 5–8 10 4 5 2.5
(mm)
Acquisition 1 min 53 s–4 3 min 32 s–5 1 min 49 s–3 3 min 9 s–5
5 min 12 s 3 min 49 s 2 min 45 s 5 min 34 s 2 min 15 s 5 min 11 s
time min 30 s min 16 s min 55 s min 58 s
b values 0, 400, 1400
Table 1. Parameters of the magnetic resonance sequences. TR repetition time, TE echo time, FOV field of
view, T1WI T1-weighted image, T2WI T2-weighted image, DWI diffusion-weighted image, DCE dynamic
contrast-enhanced. a Thoracic or lumbosacral spine. b Pelvic bone.
adjacent segments of the spine. The planning target volume was defined as an isotropic extension of 5 mm from
the clinical target volume. Both X-ray and proton beam therapies were used in this study. The registration of the
simulation CT, target volume delineation, and calculation of dosimetry were performed using Pinnacle version
9.10 (Philips Radiation Oncology Systems) for X-ray RT and RayStation (RaySearch Laboratories) for proton
beam therapy. An orthogonal X-ray image was obtained in the treatment room for image verification before RT.
MRI examinations. All examinations were performed using a 3.0-T MRI scanner (Ingenia; Philips Medi-
cal Systems). MRI was performed before (baseline) and one month after completing RT (first post-RT; range
15–45 days). Conventional MRI sequences consisted of turbo spin-echo axial T1-weighted imaging (T1WI),
T2-weighted image (T2WI), sagittal T2WI, and sagittal (spine) or coronal (pelvic bone) T1WI. Axial plane
DW-MRI was obtained using a single-shot echoplanar sequence as follows: fat suppression method, chemical
shift selective saturation; phase encoding direction, anteroposterior; number of averages, 3; parallel imaging,
SENSE with a reduction factor of 2; water-fat shift, 10.84 pixels; interpolated voxel size, 1.367 mm; slice gap,
0 mm; breath-hold or triggering, none; diffusion time (Δ), 26.5 ms; length of the gradient pulse (δ), 16.06 ms.
Sensitizing diffusion gradients were applied sequentially in the x, y, and z directions using b values of 0, 400, and
140028,29. ADC maps were generated automatically on the main MRI console with a mono-exponential fitting
of the three selected b values. DCE-MRI was performed using a three-dimensional fast field-echo sequence in
the axial plane. Before injecting the contrast material, the pre-contrast T1-weighted fast field-echo sequences
(flip angles, 5° and 10°) were applied according to the same geometry to calculate the baseline T1 maps with the
same axial three-dimensional fast field-echo sequence. DCE-MRI was performed immediately after injecting a
bolus of gadoterate meglumine ( Dotarem®; Guerbet) at a rate of 3 mL/s and a dose of 0.1 mmol/kg, followed by
a 15-mL flush of normal saline. DCE-MRI included 1050 dynamic images with a temporal resolution of 4.3 s
obtained over 5 min (flip angle, 15°; parallel imaging, SENSE with a reduction factor of 2; breath-hold or trig-
gering, none; fat suppression, none). Contrast-enhanced T1WIs were collected after DCE imaging in the axial
and sagittal planes of the thoracic or lumbosacral spine and in the axial and coronal planes of the pelvic bone
(Table 1). Three months after completing RT, follow-up MRI was performed using conventional sequences (sec-
ond post-RT; range 70–100 days).
Image analysis. DCE-MRI maps were generated using image-processing software (IntelliSpace Portal ver-
sion 10.0; Philips). The signal intensity on MRI was converted into an equivalent concentration of contrast mate-
rial using the variable flip angle m ethod30. DCE parameters (Ktrans, rate constant [kep], volume fraction of the
extravascular extracellular matrix [ve], and blood plasma volume [vp]) were estimated using the extended Tofts
model31 with the population-averaged arterial input function (AIF)32.
Two independent radiologists (readers I and II with 15 and 5 years of experience in musculoskeletal MRI,
respectively) who were blinded to clinical information performed the tumor segmentation on anatomic reference
images; the axial T1WI, T2WI, and postcontrast T1WI, in which tumor margins were most clearly delineated,
were selected. The reference image, ADC, and DCE parameter maps were loaded into a multimodality tumor
tracking application (IntelliSpace Portal version 10.0; Philips). After selecting the regions of interest (ROI) using
the “smart ROI” tool with edge detection, the ROIs were automatically propagated in the craniocaudal direction
(Fig. 1). Manual adjustments were performed to ensure accuracy in encompassing the whole tumor volume,
including both intraosseous and extraosseous components. Adjacent vertebral endplates or intervertebral discs
were carefully avoided. ROIs drawn on anatomic reference images were simultaneously and automatically drawn
on the corresponding location on ADC and DCE parameter maps. The mean values of ADC, Ktrans, kep, ve, vp,
and volume from the volumetric ROI were recorded.
Evaluation of treatment response. The local tumor response was evaluated according to the MD
Anderson criteria (complete response [CR], partial response [PR], progressive disease [PD], and stable disease
Scientific Reports | (2021) 11:10459 | https://doi.org/10.1038/s41598-021-90065-1 3
Vol.:(0123456789)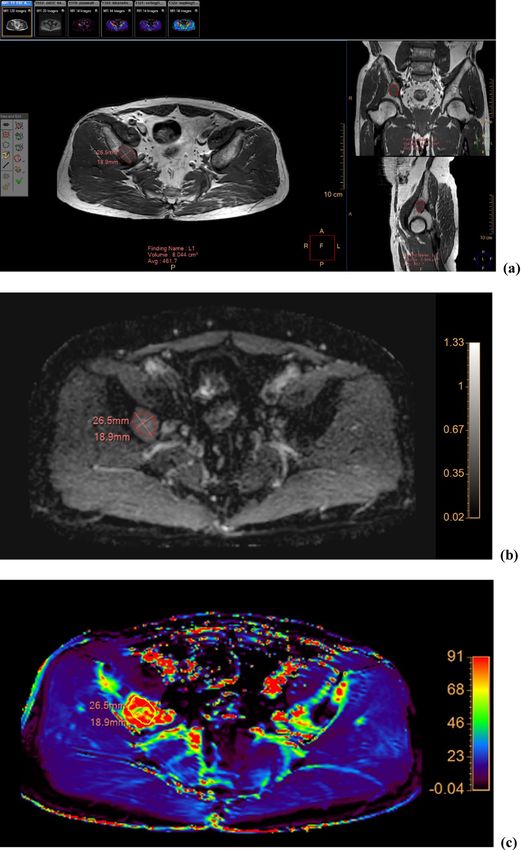
www.nature.com/scientificreports/

                                            Figure 1.  Images of a 64-year-old man with hepatocellular carcinoma showing metastasis to the right iliac
                                            bone. (a) The ROI was drawn within the lesion encompassing the whole tumor volume on axial T1-weighted
                                            images and reformatted coronal (right upper panel) and sagittal (right lower panel) images. The corresponding
                                            ADC map (b) and color-encoded overlay maps of the Ktrans (c), kep (d), ve (e), and vp (f) are shown with ROIs
                                            and scale bars. ADC, apparent diffusion coefficient; Ktrans, volume transfer constant; kep, rate constant; ve, volume
                                            fraction of the extravascular extracellular matrix; vp, blood plasma volume; ROI, region of interest.

          Scientific Reports |   (2021) 11:10459 |               https://doi.org/10.1038/s41598-021-90065-1                                                     4

Vol:.(1234567890)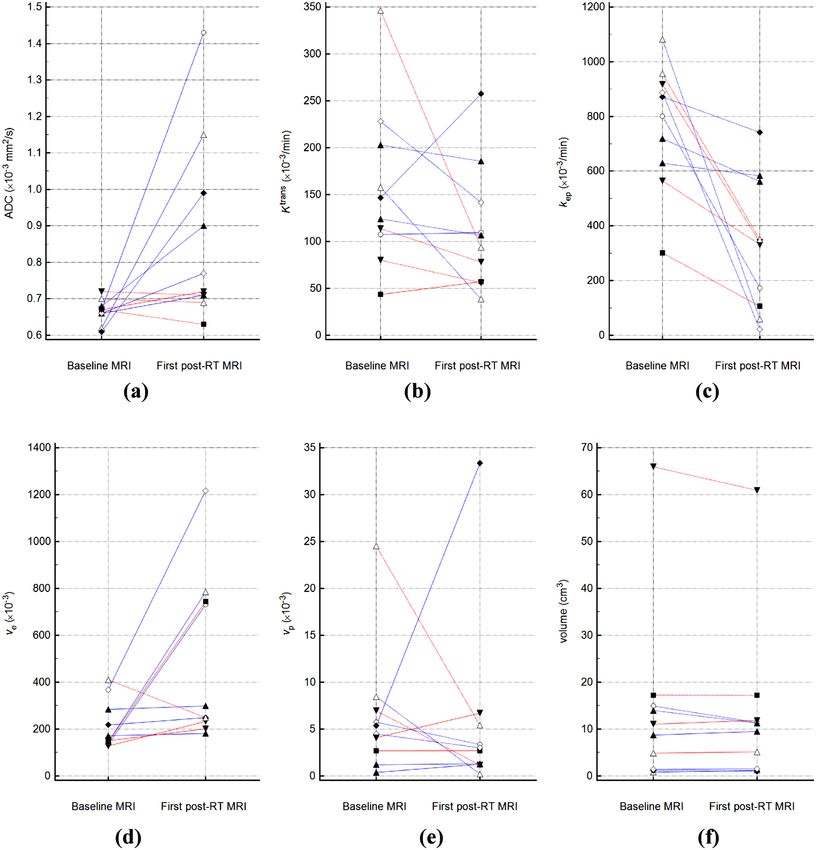
www.nature.com/scientificreports/
Figure 1. (continued)
[SD])33. The patients were categorized into CR, PR, PD, or SD as follows: CR, normalization of signal intensity;
PR, ≥ 50% decrease in size; PD, ≥ 25% increase in size; and SD, < 25% increase or < 50% decrease in size. The
measurements were based on the sum of the perpendicular bi-dimensional measurements of the greatest diam-
eters of each lesion in the baseline and second post-RT MRIs analyzed by reader II. Patients with CR, PR, and
SD were regarded as the non-PD group, and those with PD were regarded as the PD group.
Pain status was assessed using the numeric rating scale (NRS) score three days before initiating RT, during
the course of RT, and one and three months after completing RT. To evaluate the pain response after RT, the
categories of the International Bone Metastases Consensus Group were used to adjust the confounding effects of
analgesics34. To apply these categories, we calculated the oral morphine equivalent dose (OMED) of all analgesics
administered to patients before and after RT. Neurological symptoms were graded according to the neurologi-
cal grading system for spinal cord compression by metastatic t umor35. Toxicities related to the treatment were
evaluated according to the Common Terminology Criteria for Adverse Events version 5.0.
Scientific Reports | (2021) 11:10459 | https://doi.org/10.1038/s41598-021-90065-1 5
Vol.:(0123456789)www.nature.com/scientificreports/
Non-PD group (%) PD group (%) P value
Sex 1.000
Male 5 (83.3) 4 (100.0)
Female 1 (16.7) 0 (0.0)
Etiology of HCC 0.679
Hepatitis B 4 (66.7) 3 (75.0)
Hepatitis C 1 (16.7) 1 (25.0)
Others 1 (16.7) 0 (0.0)
Accompanying liver cirrhosis 1.000
Yes 3 (50.0) 2 (50.0)
No 3 (50.0) 2 (50.0)
Child–Pugh class 0.400
A5 6 (100.0) 3 (75.0)
A6 0 (0.0) 1 (25.0)
Location of target lesion 0.172
Thoracic spine 3 (50.0) 0 (0.0)
Lumbar spine 3 (50.0) 2 (50.0)
Sacrum 0 (0.0) 1 (25.0)
Ilium 0 (0.0) 1 (25.0)
Radiation therapy modality 0.400
X-ray therapy 6 (0.0) 3 (75.0)
Proton therapy 0 (0.0) 1 (25.0)
Concurrent systemic treatment 0.400
Yes 0 (0.0) 1 (25.0)
No 6 (100.0) 3 (75.0)
Median αFP (ng/mL)a 10 (5.3–41,306.2) 4056.6 (3.4–156,059) 1.000
Table 2. Comparison of clinical variables between the non-PD and PD groups. PD progressive disease, HCC
hepatocellular carcinoma, αFP alpha-fetoprotein. a Numbers in parentheses are ranges.
Statistical analysis. The Wilcoxon signed-rank test was used to determine whether MRI parameters in the
first post-RT MRI were different from those in the baseline MRI. Changes in ADC, Ktrans, kep, ve, vp, and volume
in the first post-RT MRI, defined as the percentage change from baseline values, were calculated (ΔADC%,
ΔKtrans%, Δkep%, Δve%, Δvp%, and Δvolume%, respectively). Patient characteristics were compared between the
non-PD and PD groups; the continuous and categorical variables were analyzed using the Mann–Whitney test
and Fisher’s exact test, respectively. For continuous variables with P values < 0.20, a receiver operating charac-
teristic (ROC) curve was constructed, and the area under the curve (AUC) was calculated. The optimal cutoff
points were based on the maximum Youden index.
The interobserver agreement between readers I and II was assessed using the intraclass correlation coeffi-
cient (ICC). An ICC of 1.0 was considered to represent perfect agreement; 0.81–0.99, almost perfect agreement;
0.61–0.80, substantial agreement; 0.41–0.60, moderate agreement; 0.21–0.40, fair agreement; and 0.20 or less,
slight agreement36.
All statistical analyses were performed using MedCalc Statistical Software version 19.4.0, and P values < 0.05
were considered statistically significant.
Results
Among 14 patients, four were excluded for the following reasons: withdrawal of consent (n = 2), inability to
undergo MRI examination owing to a deterioration in his/her general condition (n = 1), and inappropriate MRI
acquisition (n = 1). Ten patients were finally included. Proton beam therapy was performed in only one patient
among the ten patients. The median age and follow-up duration were 63 years (range 43–73 years) and 6 months
(range 3–7 months), respectively. The median time interval between completing RT and the first post-RT MRI
was 30 days (range 23–34 days). Four patients experienced PD of the target lesions in the second post-RT MRI
and two died of disease progression. There was no significant difference in clinical variables between the PD
and non-PD groups (Table 2).
The interobserver agreements were as follows: ADC ICC = 0.912, 95% confidence interval [CI] 0.794–0.964;
Ktrans ICC = 0.977, 95% CI 0.943–0.991; kep ICC = 0.976, 95% CI 0.942–0.991; ve ICC = 0.992, 95% CI 0.979–0.997;
vp ICC = 0.999, 95% CI 0.996–0.999; volume ICC = 0.999, 95% CI 0.996–0.999. Because the measurements of all
MRI parameters showed almost perfect interobserver agreement, the average of both readers’ measurements
was used (Fig. 2).
ADC, kep, and ve in the first post-RT MRI were significantly different from those in the baseline MRI, with
changes of + 31.65% ± 41.52%, -54.70 ± 32.21%, and + 161.93 ± 198.47% [mean ± standard deviation], respectively
Scientific Reports | (2021) 11:10459 | https://doi.org/10.1038/s41598-021-90065-1 6
Vol:.(1234567890)www.nature.com/scientificreports/
Figure 2. Bland–Altman plots of (a) ADC, (b) Ktrans, (c) kep, (d) ve, (e) vp, and (f) tumor volume demonstrating
agreement between the values measured by the two readers. The difference (y-axis) between the measurements
obtained by the two readers is plotted against the mean value (x-axis) of the measurements obtained by them.
The solid line and the top and bottom dashed lines indicate the mean difference and the upper and lower
margins of 95% limits of agreement, respectively. ADC, apparent diffusion coefficient; Ktrans, volume transfer
constant; kep, rate constant; ve, volume fraction of the extravascular extracellular matrix; vp, blood plasma
volume; SD, standard deviation.
Baseline MRI First post-RT MRI P value
ADC (× 10–3 mm2/s) 0.67 (0.61–0.72) 0.75 (0.63–1.43) 0.027
Ktrans (× 10–3/min) 135.38 (43.51–346.04) 100.08 (38.62–257.49) 0.106
kep (× 10–3/min) 836.33 (301.41–1082.32) 335.80 (21.86–741.87) 0.002
ve (× 10–3) 161.54 (128.38–410.13) 273.99 (181.39–1216.95) 0.027
vp (× 10–3) 4.93 (0.38–24.52) 2.86 (0.21–33.35) 0.625
Volume (cm3) 9.90 (0.80–65.93) 10.40 (1.01–60.93) 0.770
Table 3. MRI parameters before and after RT. Numbers are medians and ranges in parentheses. MRI,
magnetic resonance imaging; ADC, apparent diffusion coefficient; Ktrans, volume transfer constant; kep, rate
constant; RT, radiation therapy; ve, volume fraction of the extravascular extracellular matrix; vp, blood plasma
volume.
Scientific Reports | (2021) 11:10459 | https://doi.org/10.1038/s41598-021-90065-1 7
Vol.:(0123456789)www.nature.com/scientificreports/
Figure 3. Graphs showing changes in (a) ADC, (b) Ktrans, (c) kep, (d) ve, (e) vp, and (f) tumor volume following
RT for each patient. The increasing values are represented by solid lines and the decreasing ones by dashed
lines. The data of the non-PD and PD groups are represented by blue and red lines, respectively. ADC, apparent
diffusion coefficient; Ktrans, volume transfer constant; kep, rate constant; PD, progressive disease; RT, radiation
therapy; ve, volume fraction of the extravascular extracellular matrix; and vp, blood plasma volume.
(Table 3, Figs. 3, 4, 5). While Ktrans, v p, and volume changed by − 16.16 ± 45.60%, + 49.74 ± 191.81%, and
+ 2.03 ± 21.98%, respectively, these changes were not statistically significant.
The PD group showed a significantly lower ΔADC% than the non-PD group (Table 4, Fig. 6). The baseline
ADC and baseline volumes were not significantly different between the two groups. The AUCs of ΔADC%,
baseline ADC, and baseline volume for differentiating between the non-PD and PD groups were 1.000 (95%
CI 0.692–1.000), 0.875 (95% CI 0.525–0.994), and 0.792 (95% CI 0.435–0.972), respectively. The cutoffs for
ΔADC%, baseline ADC, and baseline volume were 6.79% (sensitivity, 100.0%; specificity, 100.0%), 0.66 × 10⁻³
mm2/s (sensitivity, 100.0%; specificity, 66.7%), and 1.39 c m3 (sensitivity, 100.0%; specificity, 50.0%), respectively.
Only three (30%) patients complained of pain, with NRS scores of four (n = 1) and three (n = 2), while the
other seven patients did not have any pain relevant to the target lesions and were not administered any analgesics.
Scientific Reports | (2021) 11:10459 | https://doi.org/10.1038/s41598-021-90065-1 8
Vol:.(1234567890)www.nature.com/scientificreports/
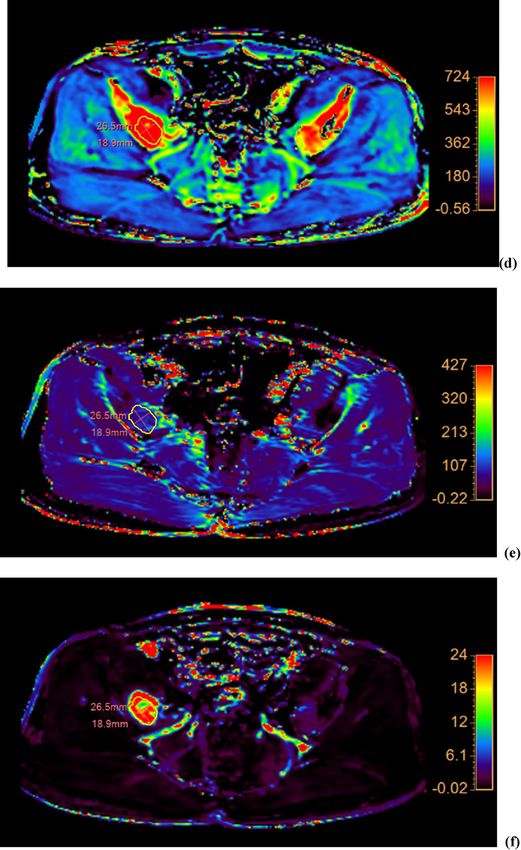
Figure 4. Images of a 71-year-old woman with metastasis to the T12 vertebra from a hepatocellular
carcinoma. The tumor margin is delineated by yellow dotted lines. (a) The T2WI of the baseline MRI shows a
2.6 × 3.7-cm-sized metastatic lesion with an extraosseous extension to the left paravertebral (arrow) and epidural
spaces (arrowhead). Compared with (b) the baseline MRI, the average mean ADC value measured by readers
I and II in the (c) first post-RT MRI increased from 0.68 to 1.39 (× 10–3 mm2/s). (d) The T2WI of the second
post-RT MRI shows that the size of the lesion decreased to 1.6 × 3.4 cm, representing a partial response. ADC
apparent diffusion coefficient, MRI magnetic resonance imaging, RT radiation therapy, T2WI T2-weighted
image.
The median OMED of the three patients with relevant pain was 24 mg (range 7.5–30 mg). After completing RT,
two patients had complete remission of pain and one had partial remission. Among the seven patients without
any relevant pain before RT, two developed post-RT pain that was related to the PD of the target lesion. Only one
Scientific Reports | (2021) 11:10459 | https://doi.org/10.1038/s41598-021-90065-1 9
Vol.:(0123456789)www.nature.com/scientificreports/
Figure 5. Images of a 72-year-old man with metastasis to the L2 vertebra from a hepatocellular carcinoma. The
tumor margin is delineated by yellow dotted lines. (a) The T2WI of the baseline MRI shows a 1.8 × 2.3-cm-sized
metastatic lesion. The average mean ADC values measured by readers I and II in (b) the baseline MRI and (c)
the first post-RT MRI were 0.72 and 0.71 (× 10–3 mm2/s), respectively. (d) The T2WI of the second post-RT MRI
shows an increase in the size of the lesion to 2.6 × 2.7 cm with extraosseous extension (arrows), representing PD.
ADC apparent diffusion coefficient, MRI magnetic resonance imaging, RT radiation therapy, T2WI T2-weighted
image, PD progressive disease.
patient had neurological symptoms graded as b, showing radiculopathy, which was relevant to the target lesion.
The neurological symptoms were relieved one month after RT; however, relapse was observed owing to PD of
the target lesion. No grade 3 or 4 toxicities were observed during the follow-up (Table 5).
Scientific Reports | (2021) 11:10459 | https://doi.org/10.1038/s41598-021-90065-1 10
Vol:.(1234567890)www.nature.com/scientificreports/
Non-PD group (n = 6) PD group (n = 4) P value
ADC (× 10−3 mm2/s)a 0.66 (0.61–0.68) 0.69 (0.67–0.72) 0.051
Ktrans (× 10−3/min)a 152.20 (107.47–228.01) 96.94 (43.51–346.04) 0.286
kep (× 10−3/min)a 836.33 (628.82–1082.32) 741.29 (301.41–956.28) 0.670
ve (× 10−3)a 195.00 (135.30–368.89) 148.30 (128.38–410.13) 0.522
vp (× 10−3)a 4.93 (0.38–8.46) 5.53 (2.38–24.52) 0.522
Volume (cm3)a 5.06 (0.80–14.93) 14.16 (4.88–65.93) 0.136
ΔADC% 46.71 (7.71–112.81) − 1.35 (− 6.16 to 6.79) 0.011
ΔKtrans% − 11.31 (− 75.51 to 75.54) − 30.74 (− 72.97 to 31.48) 0.670
Δkep% − 50.11 (− 97.54 to − 7.29) − 63.20 (− 64.85 to − 41.27) 1.000
Δve% 122.14 (5.17–440.48) 57.46 (− 39.27 to 410.41) 0.670
Δvp% − 11.51 (− 97.55 to 520.64) − 38.44 (− 83.39 to 64.20) 0.522
ΔVolume% -3.26 (− 23.63 to 53.20) 2.61 (− 7.58 to 7.36) 1.000
Table 4. Comparison of MRI parameters between the non-PD and PD groups. Numbers are medians
and ranges in parentheses. MRI, magnetic resonance imaging; ADC, apparent diffusion coefficient, Ktrans,
volume transfer constant; kep, rate constant; PD, progressive disease; ve, volume fraction of the extravascular
extracellular matrix; vp, blood plasma volume. a Data from baseline MRI.
Figure 6. Boxplots for (a) ΔADC%, (b) baseline ADC, and (c) baseline volume in the non-PD and PD groups.
The top and bottom of the box denote the 25th and 75th percentiles, respectively. The mid lines and bars
indicate the medians and 5th–95th percentiles, respectively. ADC apparent diffusion coefficient, PD progressive
disease.
Toxicities Grade 1 (%) Grade 2 (%) Total (%)
Anorexia 1 (10.0) 1 (10.0) 2 (20.0)
Nausea 1 (10.0) 0 (0.0) 1 (10.0)
Diarrhea 2 (0.0) 0 (0.0) 2 (20.0)
Table 5. Toxicity profiles related to radiation therapy.
Discussion
We evaluated changes in DW- and DCE-MRI parameters of bone metastases from HCC after RT and assessed
their prognostic significance. Significant post-RT changes were noted in ADC, kep, and ve. In addition, the percent
change in ADC one month after RT was significantly different between the PD and non-PD groups, suggesting
that it may help predict treatment response, which is considered to be unique to our study.
Scientific Reports | (2021) 11:10459 | https://doi.org/10.1038/s41598-021-90065-1 11
Vol.:(0123456789)www.nature.com/scientificreports/
Several studies have suggested that pre- and posttreatment ADC could serve as a prognostic factor in various
malignant tumors20,37–39, including HCC40,41. Our results were comparable to those of previous studies20,25,37–41,
showing lower ΔADC% in the PD group. Furthermore, the ΔADC% could help differentiate between the PD
and non-PD groups with 100% sensitivity and specificity using a cutoff of 6.79%, suggesting its potential as a
predictor for early local tumor recurrence. Indeed, we acknowledge that validation of this cutoff value should
be mandatory in future investigations, considering the repeatability of ADC m easurements18 and intervendor
42
differences , which could be regarded as a limitation of DWI, and the small sample size of the present study;
whether MRI can predict treatment response even earlier (e.g., within one month post-RT or during RT) or
whether artificial intelligence and machine learning can predict treatment response are topics for future research.
Regarding RT, there have been controversies regarding the optimal RT regimen for HCC bone metastasis9,43 and
the dose–response relationship in HCC44. However, the high rates of up to 50% of retreatment following the
use of conventional doses of R T7 have suggested the need for high-dose i rradiation9,10. In this study, the crude
rate of early local tumor progression 3 months after conventional RT was 40%. A subsequent boost with RT or
early surgical interventions in patients showing a low ΔADC% at 1 month after the initial RT may improve local
tumor control, and further studies are necessary to define optimal patient selection.
Similar to a previous study45, the baseline ADC of HCC bone metastases was relatively low in both the PD
and non-PD groups, considering that the ADC of various pathologic bone marrow lesions generally ranged
between 0.7 and 1.0 (× 10–3 mm2/s)46–48. With HCC being a hypervascular tumor, we considered that intratumoral
hemorrhages within metastatic bone lesions may have contributed to the low ADC12. Unexpectedly, baseline
ADC tended to be higher in the PD group, in contrast to previous studies that reported lower baseline ADC to
be a risk factor for early recurrences or incomplete responses49,50. However, studies with contrasting results have
also been reported, with higher baseline ADC values showing poor responses to chemotherapy or R T38,51,52. As
52
necrotic tumors are less sensitive to chemotherapy or RT , poor responses with higher baseline ADCs are likely
to result from tumor necrosis. Although pseudo-diffusion could be another possible e xplanation12, its contri-
bution is unlikely, as no significant differences were noted between DCE-MRI parameters of the two groups53.
It has been suggested that DCE-MRI parameters have potential as biomarkers for predicting prognoses and
detecting treatment r esponses54–57. Regarding bone lesions, the vp and Ktrans decreased after RT, with vp being
the most strong predictor of treatment responses27,58,59. In contrast, we observed a significant decrease in kep
and an increase in ve after treatment; Ktrans showed no significant change, possibly because kep and ve changed
in opposite directions. Furthermore, none of the DCE-MRI parameters could differentiate between the PD and
non-PD groups, contrary to our expectation that they may also serve as prognostic factors for metastatic bone
lesions from HCC. Although irrelevant to clinical outcomes, their significant changes implied that they can
reflect pathophysiological changes after RT. As tumor cellularity and volume of extravascular extracellular space
are inversely c orrelated60,61, it was reasonable that ve decreased and ADC increased after RT. Meanwhile, the
discrepancy observed between ADC and ve in terms of their predictive values may be explained by the different
extravascular extracellular space-related tumor e nvironments23,62. In addition, we speculated that the method of
ROI placement in our study could be one of the contributing factors for the negative results regarding DCE-MRI
parameters, considering that previous studies placed ROIs mostly around hot spots representing a higher overall
perfusion58,59. While the desirable placement of a ROI for tumor analysis remains debatable, tumor vascularity
may have been underestimated in our study by the whole tumor assessment that did not exclude non-enhanced
necrotic areas63. Nonetheless, we believe that our method using a multimodal tumor tracking application is
one of the strengths of this study as it is less biased by the ROI choice and ensures the same ROI placement
among different MRI sequences. Scanner, software, or operator-dependent variabilities, which are limitations in
DCE-MRI64, or inhomogeneous responses between the intraosseous and extraosseous components65 can also be
potential factors for the negative results that are contradictory to those of previous studies27,58,59.
Although there was no significant difference in volume when the whole study sample was assessed, some
tumors showed an apparent increase in volume in the first post-RT MRI. Among the five patients who showed an
increased post-RT tumor volume, only two were categorized into the PD group, which is partially comparable to
the phenomenon termed “pseudo-progression”66. Pseudo-progression, first described in brain gliomas after RT
and chemotherapy, is defined as treatment-related transient tumor g rowth67. Although there have been reports
regarding pseudo-progression of bone lesions after high-dose stereotactic radiosurgery66, our results may imply
that pseudo-progression can occur even after conventional dose regimens for bone metastasis from HCC. Further
large-scale studies are necessary to validate these results.
Our study had several limitations. First, the sample size was limited to only ten patients, which may have
influenced the reliability of the results, and the lack of multivariable analyses owing to the small sample size
prohibited the determination of whether the predictive value of ΔADC% was independent of other MRI and
clinical variables. Second, we used average DW- and DCE-MRI parameters calculated by two readers. However,
owing to the high interobserver agreement, there was partial justification for the adoption of this method. Third,
the physiology of individual patients may not have been appropriately reflected in the DCE-MRI parameters
that were calculated based on a population-averaged AIF; although this method may have been advantageous
in terms of reproducibility32. Fourth, the use of 0 s/mm2 as the first b value instead of 50 s/mm2 may have led
to perfusion-related contributions to the ADC m easurement12. Fifth, there may have been a mismatch of ROI
between sequences. In particular, different slice thicknesses may have potentially resulted in discrepancies at
the periphery of the lesions. Finally, the inclusion of both the enhanced and non-enhanced areas may have
influenced the study results.
In conclusion, ADC and quantitative DCE-MRI parameters of metastatic bone lesions from HCC changed
significantly in post-RT MRI. The percent change in ADC in early post-RT MRI can be used to evaluate treat-
ment responses and may also predict local tumor progression. Future studies with larger patient populations
and long-term clinical outcome evaluations are necessary to validate these findings.
Scientific Reports | (2021) 11:10459 | https://doi.org/10.1038/s41598-021-90065-1 12
Vol:.(1234567890)www.nature.com/scientificreports/
Received: 30 December 2020; Accepted: 4 May 2021
References
1. El-Serag, H. B. Epidemiology of viral hepatitis and hepatocellular carcinoma. Gastroenterology 142, 1264-1273.e1261. https://doi.
org/10.1053/j.gastro.2011.12.061 (2012).
2. Longo, V. et al. Bone metastases in hepatocellular carcinoma: an emerging issue. Cancer Metastasis Rev. 33, 333–342. https://doi.
org/10.1007/s10555-013-9454-4 (2014).
3. Kanda, M. et al. Extrahepatic metastasis of hepatocellular carcinoma: Incidence and risk factors. Liver Int. 28, 1256–1263. https://
doi.org/10.1111/j.1478-3231.2008.01864.x (2008).
4. Kudo, M. et al. Lenvatinib versus sorafenib in first-line treatment of patients with unresectable hepatocellular carcinoma: A ran-
domised phase 3 non-inferiority trial. Lancet 391, 1163–1173. https://doi.org/10.1016/S0140-6736(18)30207-1 (2018).
5. Llovet, J. M. et al. Sorafenib in advanced hepatocellular carcinoma. N. Engl. J. Med. 359, 378–390. https://doi.org/10.1056/NEJMo
a0708857 (2008).
6. Cheng, A. L. et al. Efficacy and safety of sorafenib in patients in the Asia-Pacific region with advanced hepatocellular carcinoma:
A phase III randomised, double-blind, placebo-controlled trial. Lancet Oncol. 10, 25–34. https://doi.org/10.1016/S1470-2045(08)
70285-7 (2009).
7. He, J. et al. Clinical features and prognostic factors in patients with bone metastases from hepatocellular carcinoma receiving
external beam radiotherapy. Cancer 115, 2710–2720. https://doi.org/10.1002/cncr.24300 (2009).
8. Hayashi, S., Tanaka, H. & Hoshi, H. External beam radiotherapy for painful bone metastases from hepatocellular carcinoma:
Multiple fractions compared with an 8-Gy single fraction. Nagoya J. Med. Sci. 76, 91–99 (2014).
9. Yoo, G. S. et al. Stereotactic ablative body radiotherapy for spinal metastasis from hepatocellular carcinoma: its oncologic outcomes
and risk of vertebral compression fracture. Oncotarget 8, 72860–72871. https://doi.org/10.18632/oncotarget.20529 (2017).
10. Shin, J. et al. Initial study on in vivo conductivity mapping of breast cancer using MRI. J. Magn. Reson. Imaging 42, 371–378. https://
doi.org/10.1002/jmri.24803 (2015).
11. Breault, S. R. et al. Quantitative dynamic contrast-enhanced MRI of pelvic and lumbar bone marrow: Effect of age and marrow
fat content on pharmacokinetic parameter values. AJR Am. J. Roentgenol. 200, W297–W303. https://doi.org/10.2214/AJR.12.9080
(2013).
12. Subhawong, T. K., Jacobs, M. A. & Fayad, L. M. Diffusion-weighted MR imaging for characterizing musculoskeletal lesions.
Radiographics 34, 1163–1177. https://doi.org/10.1148/rg.345140190 (2014).
13. Tofts, P. S. Modeling tracer kinetics in dynamic Gd-DTPA MR imaging. J. Magn. Reson. Imaging 7, 91–101. https://doi.org/10.
1002/jmri.1880070113 (1997).
14. Pekcevik, Y., Kahya, M. O. & Kaya, A. Characterization of soft tissue tumors by diffusion-weighted imaging. Iran J. Radiol. 12,
e15478. https://doi.org/10.5812/iranjradiol.15478v2 (2015).
15. Razek, A., Nada, N., Ghaniem, M. & Elkhamary, S. Assessment of soft tissue tumours of the extremities with diffusion echoplanar
MR imaging. Radiol. Med. (Torino) 117, 96–101 (2012).
16. Surov, A. et al. Comparison of ADC values in different malignancies of the skeletal musculature: A multicentric analysis. Skeletal
Radiol. 44, 995–1000 (2015).
17. Blackledge, M. D. et al. Assessment of treatment response by total tumor volume and global apparent diffusion coefficient using
diffusion-weighted MRI in patients with metastatic bone disease: A feasibility study. PLoS ONE 9, e91779 (2014).
18. Blackledge, M. D. et al. Inter-and intra-observer repeatability of quantitative whole-body, diffusion-weighted imaging (WBDWI)
in metastatic bone disease. PLoS ONE 11, e0153840 (2016).
19. Blackledge, M. D. et al. Visualizing whole-body treatment response heterogeneity using multi-parametric magnetic resonance
imaging. J. Algorithms Comput. Technol. 10, 290–301 (2016).
20. Perez-Lopez, R. et al. Diffusion-weighted imaging as a treatment response biomarker for evaluating bone metastases in prostate
cancer: A pilot study. Radiology 283, 168–177 (2017).
21. Kelm, B. M., Menze, B. H., Nix, O., Zechmann, C. M. & Hamprecht, F. A. Estimating kinetic parameter maps from dynamic
contrast-enhanced MRI using spatial prior knowledge. IEEE Trans. Med. Imaging 28, 1534–1547 (2009).
22. Choyke, P. L., Dwyer, A. J. & Knopp, M. V. Functional tumor imaging with dynamic contrast-enhanced magnetic resonance imag-
ing. J. Magnet. Resonance Imaging Off. J. Int. Soc. Magnetic Resonance Med. 17, 509–520 (2003).
23. Lee, J. H., Yoon, Y. C., Seo, S. W., Choi, Y. L. & Kim, H. S. Soft tissue sarcoma: DWI and DCE-MRI parameters correlate with Ki-67
labeling index. Eur. Radiol. 30, 914–924. https://doi.org/10.1007/s00330-019-06445-9 (2020).
24. Xia, W., Yan, Z. & Gao, X. Volume fractions of DCE-MRI parameter as early predictor of histologic response in soft tissue sarcoma:
A feasibility study. Eur. J. Radiol. 95, 228–235 (2017).
25. Venkatesulu, B. P. et al. Radiation-induced endothelial vascular injury: A review of possible mechanisms. JACC Basic Transl. Sci.
3, 563–572. https://doi.org/10.1016/j.jacbts.2018.01.014 (2018).
26. Oh, D. et al. Changes in arterioportal shunts in hepatocellular carcinoma patients with portal vein thrombosis who were treated
with chemoembolization followed by radiotherapy. Cancer Res. Treat. 47, 251–258. https://doi.org/10.4143/crt.2014.011 (2015).
27. Santos, P. et al. T1-weighted dynamic contrast-enhanced MR perfusion imaging characterizes tumor response to radiation therapy
in chordoma. AJNR Am. J. Neuroradiol. 38, 2210–2216. https://doi.org/10.3174/ajnr.A5383 (2017).
28. Messiou, C., Collins, D. J., Morgan, V. A. & Desouza, N. M. Optimising diffusion weighted MRI for imaging metastatic and
myeloma bone disease and assessing reproducibility. Eur. Radiol. 21, 1713–1718. https://d oi.o
rg/1 0.1 007/s 00330-0 11-2 116-4 (2011).
29. Kim, H. S. et al. Dynamic contrast-enhanced MR imaging parameters in bone metastases from non-small cell lung cancer: Com-
parison between lesions with and lesions without epidermal growth factor receptor mutation in primary lung cancer. Radiology
284, 815–823 (2017).
30. Fram, E. K. et al. Rapid calculation of T1 using variable flip angle gradient refocused imaging. Magn. Reson. Imaging 5, 201–208.
https://doi.org/10.1016/0730-725x(87)90021-x (1987).
31. Tofts, P. S. et al. Estimating kinetic parameters from dynamic contrast-enhanced T(1)-weighted MRI of a diffusable tracer: Stand-
ardized quantities and symbols. J. Magn. Reson. Imaging 10, 223–232. https://doi.org/10.1002/(sici)1522-2586(199909)10:3%
3c223::aid-jmri2%3e3.0.co;2-s (1999).
32. Parker, G. J. et al. Experimentally-derived functional form for a population-averaged high-temporal-resolution arterial input
function for dynamic contrast-enhanced MRI. Magn. Reson. Med. 56, 993–1000. https://doi.org/10.1002/mrm.21066 (2006).
33. Costelloe, C. M., Chuang, H. H., Madewell, J. E. & Ueno, N. T. Cancer response criteria and bone metastases: RECIST 1.1, MDA
and PERCIST. J. Cancer 1, 80–92. https://doi.org/10.7150/jca.1.80 (2010).
34. Chow, E. et al. Update of the international consensus on palliative radiotherapy endpoints for future clinical trials in bone metas-
tases. Int. J. Radiat. Oncol. Biol. Phys. 82, 1730–1737. https://doi.org/10.1016/j.ijrobp.2011.02.008 (2012).
35. Ryu, S. et al. Contemporary treatment with radiosurgery for spine metastasis and spinal cord compression in 2015. Radiat. Oncol.
J. 33, 1–11. https://doi.org/10.3857/roj.2015.33.1.1 (2015).
36. Landis, J. R. & Koch, G. G. The measurement of observer agreement for categorical data. Biometrics 33, 159–174 (1977).
Scientific Reports | (2021) 11:10459 | https://doi.org/10.1038/s41598-021-90065-1 13
Vol.:(0123456789)www.nature.com/scientificreports/
37. Zhang, Y., Zhang, Q., Wang, X. X., Deng, X. F. & Zhu, Y. Z. Value of pretherapeutic DWI in evaluating prognosis and therapeu-
tic effect in immunocompetent patients with primary central nervous system lymphoma given high-dose methotrexate-based
chemotherapy: ADC-based assessment. Clin. Radiol. 71, 1018–1029. https://doi.org/10.1016/j.crad.2016.05.017 (2016).
38. Ohno, Y. et al. Diffusion-weighted MRI versus 18F-FDG PET/CT: Performance as predictors of tumor treatment response and
patient survival in patients with non-small cell lung cancer receiving chemoradiotherapy. AJR Am. J. Roentgenol. 198, 75–82.
https://doi.org/10.2214/AJR.11.6525 (2012).
39. Somoye, G. et al. Early diffusion weighted magnetic resonance imaging can predict survival in women with locally advanced cancer
of the cervix treated with combined chemo-radiation. Eur. Radiol. 22, 2319–2327. https://doi.org/10.1007/s00330-012-2496-0
(2012).
40. Vandecaveye, V. et al. Chemoembolization for hepatocellular carcinoma: 1-month response determined with apparent diffusion
coefficient is an independent predictor of outcome. Radiology 270, 747–757. https://doi.org/10.1148/radiol.13130591 (2014).
41. Corona-Villalobos, C. P. et al. Functional magnetic resonance imaging response of targeted tumor burden and its impact on survival
in patients with hepatocellular carcinoma. Invest. Radiol. 50, 283–289. https://doi.org/10.1097/RLI.0000000000000112 (2015).
42. Donati, O. F. et al. Diffusion-weighted MR imaging of upper abdominal organs: Field strength and intervendor variability of
apparent diffusion coefficients. Radiology 270, 454–463 (2014).
43. Hennequin, C., Quero, L. & Rivera, S. Radiosensitivity of hepatocellular carcinoma. Cancer Radiother. 15, 39–42. https://doi.org/
10.1016/j.canrad.2010.11.004 (2011).
44. Park, H. C. et al. Dose–response relationship in local radiotherapy for hepatocellular carcinoma. Int. J. Radiat. Oncol. Biol. Phys.
54, 150–155. https://doi.org/10.1016/s0360-3016(02)02864-x (2002).
45. Cha, M. J. & Yoon, Y. C. Clinical relevance of the apparent diffusion coefficient value of metastatic bone tumours on diffusion-
weighted MRI images: Differences according to the types of primary tumour, the affected bones, and clinical factors. Clin. Radiol.
70, 1116–1121. https://doi.org/10.1016/j.crad.2015.05.015 (2015).
46. Dietrich, O., Biffar, A., Reiser, M. F. & Baur-Melnyk, A. Diffusion-weighted imaging of bone marrow. Semin. Musculoskelet. Radiol.
13, 134–144. https://doi.org/10.1055/s-0029-1220884 (2009).
47. Balliu, E. et al. Diagnostic value of apparent diffusion coefficients to differentiate benign from malignant vertebral bone marrow
lesions. Eur. J. Radiol. 69, 560–566 (2009).
48. Lee, J. H. & Park, S. Differentiation of Schmorl nodes from bone metastases of the spine: Use of apparent diffusion coefficient
derived from DWI and fat fraction derived from a Dixon sequence. Am. J. Roentgenol. 213, W228–W235 (2019).
49. Nakanishi, M. et al. Relationship between diffusion-weighted magnetic resonance imaging and histological tumor grading of
hepatocellular carcinoma. Ann. Surg. Oncol. 19, 1302–1309. https://doi.org/10.1245/s10434-011-2066-8 (2012).
50. Mannelli, L., Kim, S., Hajdu, C. H., Babb, J. S. & Taouli, B. Serial diffusion-weighted MRI in patients with hepatocellular carcinoma:
Prediction and assessment of response to transarterial chemoembolization. Preliminary experience. Eur. J. Radiol. 82, 577–582.
https://doi.org/10.1016/j.ejrad.2012.11.026 (2013).
51. Dzik-Jurasz, A. et al. Diffusion MRI for prediction of response of rectal cancer to chemoradiation. Lancet 360, 307–308. https://
doi.org/10.1016/S0140-6736(02)09520-X (2002).
52. Koh, D. M. et al. Predicting response of colorectal hepatic metastasis: Value of pretreatment apparent diffusion coefficients. AJR
Am. J. Roentgenol. 188, 1001–1008. https://doi.org/10.2214/AJR.06.0601 (2007).
53. Sun, H. L. et al. Correlation between intravoxel incoherent motion and dynamic contrast-enhanced magnetic resonance imaging
parameters in rectal cancer. Acad. Radiol. 26, e134–e140. https://doi.org/10.1016/j.acra.2018.08.012 (2019).
54. Hahn, O. M. et al. Dynamic contrast-enhanced magnetic resonance imaging pharmacodynamic biomarker study of sorafenib in
metastatic renal carcinoma. J. Clin. Oncol. 26, 4572–4578. https://doi.org/10.1200/JCO.2007.15.5655 (2008).
55. Hsu, C. Y. et al. Dynamic contrast-enhanced magnetic resonance imaging biomarkers predict survival and response in hepatocel-
lular carcinoma patients treated with sorafenib and metronomic tegafur/uracil. J. Hepatol. 55, 858–865. https://doi.org/10.1016/j.
jhep.2011.01.032 (2011).
56. Li, S. P. et al. Use of dynamic contrast-enhanced MR imaging to predict survival in patients with primary breast cancer undergoing
neoadjuvant chemotherapy. Radiology 260, 68–78. https://doi.org/10.1148/radiol.11102493 (2011).
57. Guo, J. et al. Dynamic contrast-enhanced magnetic resonance imaging as a prognostic factor in predicting event-free and overall
survival in pediatric patients with osteosarcoma. Cancer 118, 3776–3785. https://doi.org/10.1002/cncr.26701 (2012).
58. Kumar, K. A. et al. A pilot study evaluating the use of dynamic contrast-enhanced perfusion MRI to predict local recurrence after
radiosurgery on spinal metastases. Technol. Cancer Res. Treat. 16, 857–865. https://doi.org/10.1177/1533034617705715 (2017).
59. Chu, S. et al. Measurement of blood perfusion in spinal metastases with dynamic contrast-enhanced magnetic resonance imaging:
Evaluation of tumor response to radiation therapy. Spine (Phila Pa 1976) 38, E1418–E1424. https://doi.org/10.1097/BRS.0b013
e3182a40838 (2013).
60. Aryal, M. P. et al. Dynamic contrast enhanced MRI parameters and tumor cellularity in a rat model of cerebral glioma at 7 T. Magn.
Reson. Med. 71, 2206–2214. https://doi.org/10.1002/mrm.24873 (2014).
61. Langer, D. L. et al. Prostate tissue composition and MR measurements: Investigating the relationships between ADC, T2, K trans,
Ve, and corresponding histologic features. Radiology 255, 485–494. https://doi.org/10.1148/radiol.10091343 (2010).
62. Mills, S. J. et al. Candidate biomarkers of extravascular extracellular space: A direct comparison of apparent diffusion coefficient
and dynamic contrast-enhanced MR imaging-derived measurement of the volume of the extravascular extracellular space in
glioblastoma multiforme. AJNR Am. J. Neuroradiol. 31, 549–553. https://doi.org/10.3174/ajnr.A1844 (2010).
63. Jackson, A., O’Connor, J. P., Parker, G. J. & Jayson, G. C. Imaging tumor vascular heterogeneity and angiogenesis using dynamic
contrast-enhanced magnetic resonance imaging. Clin. Cancer Res. 13, 3449–3459. https://d oi.o
rg/1 0.1 158/1 078-0 432.C
CR-0 7-0 238
(2007).
64. Kim, H. Variability in quantitative DCE-MRI: Sources and solutions. J. Nat. Sci. 4, e484 (2018).
65. Kim, M. S. et al. Tumor necrosis rate adjusted by tumor volume change is a better predictor of survival of localized osteosarcoma
patients. Ann. Surg. Oncol. 15, 906–914 (2008).
66. Thibault, I. et al. Response assessment after stereotactic body radiotherapy for spinal metastasis: A report from the SPIne response
assessment in Neuro-Oncology (SPINO) group. Lancet Oncol. 16, e595-603. https://doi.org/10.1016/S1470-2045(15)00166-7
(2015).
67. da Cruz, L. C. H. Jr., Rodriguez, I., Domingues, R. C., Gasparetto, E. L. & Sorensen, A. G. Pseudoprogression and pseudoresponse:
Imaging challenges in the assessment of posttreatment glioma. AJNR Am. J. Neuroradiol. 32, 1978–1985. https://doi.org/10.3174/
ajnr.A2397 (2011).
Author contributions
Y.C.Y. and H.C.P. conceived and supervised the study. J.H.L. and G.S.Y. collected and analyzed the data. All the
authors discussed the results, and J.H.L. and G.S.Y. wrote the main body of the manuscript. Y.C.Y., H.C.P., and
H.S.K. contributed to the critical review and final version of the manuscript.
Scientific Reports | (2021) 11:10459 | https://doi.org/10.1038/s41598-021-90065-1 14
Vol:.(1234567890)www.nature.com/scientificreports/
Funding
This work was supported by research funding from Guerbet Korea, Ltd. (No. PHO0183951).
Competing interests
The authors declare no competing interests.
Additional information
Correspondence and requests for materials should be addressed to Y.C.Y. or H.C.P.
Reprints and permissions information is available at www.nature.com/reprints.
Publisher’s note Springer Nature remains neutral with regard to jurisdictional claims in published maps and
institutional affiliations.
Open Access This article is licensed under a Creative Commons Attribution 4.0 International
License, which permits use, sharing, adaptation, distribution and reproduction in any medium or
format, as long as you give appropriate credit to the original author(s) and the source, provide a link to the
Creative Commons licence, and indicate if changes were made. The images or other third party material in this
article are included in the article’s Creative Commons licence, unless indicated otherwise in a credit line to the
material. If material is not included in the article’s Creative Commons licence and your intended use is not
permitted by statutory regulation or exceeds the permitted use, you will need to obtain permission directly from
the copyright holder. To view a copy of this licence, visit http://creativecommons.org/licenses/by/4.0/.
© The Author(s) 2021
Scientific Reports | (2021) 11:10459 | https://doi.org/10.1038/s41598-021-90065-1 15
Vol.:(0123456789)You can also read