DISSOLUTION OF PT AND ITS TEMPERATURE DEPENDENCE IN ANHYDROUS ACETONITRILE- AND METHANOL-BASED ELECTROLYTES - JUSER
←
→
Page content transcription
If your browser does not render page correctly, please read the page content below
Journal of The Electrochemical
Society

OPEN ACCESS

Dissolution of Pt and Its Temperature Dependence in Anhydrous
Acetonitrile- and Methanol-Based Electrolytes
To cite this article: Johanna Ranninger et al 2020 J. Electrochem. Soc. 167 121507

View the article online for updates and enhancements.

                             This content was downloaded from IP address 134.94.122.187 on 04/09/2020 at 09:34
Journal of The Electrochemical Society, 2020 167 121507
Dissolution of Pt and Its Temperature Dependence in Anhydrous
Acetonitrile- and Methanol-Based Electrolytes
Johanna Ranninger,1,2,z Pavlo Nikolaienko,1 Susanne J. Wachs,1,2 Jonas Möller,1 Karl
J. J. Mayrhofer,1,2,* and Balázs B. Berkes1,*,z
1
Forschungszentrum Jülich GmbH, Helmholtz Institute Erlangen-Nürnberg for Renewable Energy (IEK-11), 91058
Erlangen, Germany
2
Department of Chemical and Biological Engineering Friedrich-Alexander-Universität Erlangen-Nürnberg, 91058
Erlangen, Germany
Electrode stability is a crucial performance criterion in electrochemistry. Interestingly, in certain fields of electrochemistry,
especially when using nonaqueous electrolytes, like in electroorganic synthesis, this aspect remained largely out of focus of
investigations so far. Regarding the handling and particularly the purification of nonaqueous electrolytes and the applicable
analytical methods to study stability, such fundamental investigations are usually more complicated than in aqueous electrolytes.
Herein, we present stability data of Pt metal, as one of the most frequently used electrodes in electroorganic synthesis, in anhydrous
(ppm level) acetonitrile- and methanol-based electrolytes in the usually applied potential ranges, obtained using an electroanalytical
flow cell (EFC) coupled to an inductively coupled plasma mass spectrometer (ICP-MS). Both electrolyte solvents are widely used
in nonaqueous electrochemistry and possess different physico-chemical properties. Here we chose them as representative examples
of aprotic and protic solvents and as solvent molecules with two different electrochemical activities: acetonitrile with a wide
stability window and methanol being a rather easily oxidizable molecule. A temperature study reveals not only the different
electrochemical behavior of the electrolyte systems but also significant differences in Pt dissolution in the studied electrolytes.
© 2020 The Author(s). Published on behalf of The Electrochemical Society by IOP Publishing Limited. This is an open access
article distributed under the terms of the Creative Commons Attribution Non-Commercial No Derivatives 4.0 License (CC BY-
NC-ND, http://creativecommons.org/licenses/by-nc-nd/4.0/), which permits non-commercial reuse, distribution, and reproduction
in any medium, provided the original work is not changed in any way and is properly cited. For permission for commercial reuse,
please email: permissions@ioppublishing.org. [DOI: 10.1149/1945-7111/abb27d]
Manuscript submitted June 3, 2020; revised manuscript received August 20, 2020. Published September 3, 2020.
In the process of developing novel electrodes or electrocatalyst which makes it attractive in electroorganic synthesis and it is also an
materials the initial focus lies on finding catalysts that are highly interesting candidate for the direct alcohol fuel cell due to its low
active for one reaction or show good selectivity for a certain product. oxidation onset potential.28 MeCN is, similarly to MeOH, widely
However, stability of electrodes is equally important as degradation used and represents an aprotic polar solvent with a wide electro-
of electrodes is inextricably related to economic losses. Especially chemical stability window. The degradation limits of MeCN have
the dissolution of metals in aqueous solutions has been in focus due been thoroughly investigated by means of in situ subtractively
its significance for fuel cells and electrolyzers long-term operation1–8 normalized interfacial Fourier-transformed infrared spectroscopy
but also more and more electrode stability studies in Li-ion batteries (SNIFTIRS) and mass spectrometry techniques.29,30 With our
have been reported recently.9–13 work we want to stress that both, the electrochemical stability
Sophisticated in situ techniques provide the most profound window of the electrolyte and the stability of the electrodes
insights not only into the dissolution processes, but also allow to themselves within the operating potential range, are relevant.
draw conclusions about the underlying degradation mechanisms. In our previous paper we described a fundamentally different
Well established techniques represent in situ spectroscopy12 and the dissolution behavior of Pt in methanol-based media compared to
coupling of different electrochemical flow cells to an ICP-MS.5,6,14 aqueous media.16 We used a methanol-based electrolyte still con-
This method was earlier limited to investigations in aqueous media taining 37 ppm H2O (based on Karl Fischer titration) to demonstrate
and has only recently been applied for organic electrolytes as the main differences between aqueous and organic electrolytes.16 It
well.13,15,16 The ICP-MS, an analytical tool, usually applied for has been, however, shown before that the very pronounced effect of
aqueous samples, requires modifications, especially for the sample water on the catalytic pathways in dioxygen electrochemistry in
introduction system, to make the method applicable also for organic nonaqueous media is first visible well below 10 ppm water
samples. Boorn et al.17 and Barrett et al.18 discussed the modifica- concentration.29 We want to minimize the still unclear effect of
tions for the introduction system for ICP-AES in detail and later trace amounts of water on the stability of Pt by applying extensive
Hutton19 described the specific requirements for ICP-MS. Knowing purification methods to ensure a water content for the electrolytes
the limits of an electrocatalyst and better understanding the under- used in this study to be lower than 1 ppm (Karl Fischer titration
lying degradation mechanisms helps in designing novel catalyst detection limit).
systems and finding the appropriate operation conditions for their Furthermore, we do not only investigate the dissolution profiles
application in devices. One of these operation relevant parameters is of Pt in MeOH- and MeCN-based electrolytes at room temperature
the temperature, which is often investigated in terms of enhancing but also show a comprehensive and comparative temperature study,
the rate of a certain reaction.20–22 However, there are only a few which gives even more profound insights into the very complex
studies that show the crucial correlation of catalyst stability with underlying mechanisms leading to Pt dissolution in nonaqueous
temperature.23–26 electrolytes.
Since the question of catalyst stability was raised recently in the
context of organic electroynthesis27, we want to emphasize the issue Experimental
of stability in this field and show here for the first time stability
The details of the electroanalytical flow cell (EFC) setup coupled
limits of Pt as anode material in anhydrous acetonitrile (MeCN) and
to the ICP-MS for stability investigations in nonaqueous media and
methanol (MeOH). MeOH represents a simple protic polar solvent,
the measurement conditions for methanol-based electrolyte systems
have been previously described.16 In short, all sample preparations
and electrochemical measurements including the Karl Fischer
*Electrochemical Society Member.
z
titration were carried out in an argon filled glovebox (MBRAUN).
E-mail: j.ranninger@fz-juelich.de; b.berkes@fz-juelich.deJournal of The Electrochemical Society, 2020 167 121507
The electrochemical measurements were conducted using a Biologic for 2–3 h in a glass apparatus, while distilled methanol thoroughly
VSP 300 potentiostat. The EFC with incorporated glassy carbon washed the glass-assembly interior. During refluxing, magnesium
counter electrode (HTW Hochtemperatur-Werkstoffe GmbH) and methoxide reacted with traces of water forming insoluble magne-
homemade leakage-free reference electrode (cell body purchased sium oxide (indication for a water removal process) and the solution
from Innovative Instruments Inc.) was pressed onto a freshly became turbid. After that time the solvent-still-head was switched to
polished Pt foil (25 μm thickness) serving as working electrode collection and ca. 250 ml of methanol were collected and directly
(polycrystalline Pt 99.99%, MaTecK), which was placed on a used further. The water content of the prepared electrolytes was
movable sample holder with integrated Peltier element. The position determined using Karl Fischer titration (917 Coulometer, Metrohm)
of the EFC on the working electrode, the force used to press the cell and was found to be below 1 ppm (Karl Fischer titration detection
onto the Pt foil and the temperature profile was controlled by a limit).
homemade LabVIEW software. The electrolyte used for the measurement was pumped through
The reference electrodes used in this study consisted of a Ag wire the EFC with a flow rate of 150 μl min–1 using a Legato® 100 syringe
immersed in a solution of MeOH or MeCN containing 0.01 mol l–1 pump (KD Scientifc). The outlet of the EFC was directly connected
AgNO3 and 0.1 mol l–1 tetrabutylammonium perchlorate for the to a Nexion 2000 ICP-MS (PerkinElmer) allowing a time-resolved
methanol- and acetonitrile-based electrolyte system, respectively. downstream analysis of the dissolved Pt species in the electrolyte.
The reference electrodes were calibrated against the ferrocene/ An internal standard (from (NH4)ReO4 in water (Certipur®, Merck))
ferrocenium (Fc/Fc+) couple and all potentials in this study are in ethanol for the MeOH-based electrolyte and in 1% HNO3 for the
referenced to Fc/Fc+ (from Fc/Fc+ to SHE +0.624 V31). MeCN-based electrolyte (concentration 10 μg l–1 Re) was added via
For electrolyte preparation (0.05 mol l–1 LiClO4 containing the MP2 pump of the ICP-MS. The different solvents for the
methanol and 0.05 mol l–1 LiClO4 containing acetonitrile) LiClO4 addition of the internal standard were chosen based on their
was dried at 60 °C under vacuum for at least three days. Acetonitrile miscibility with the electrolytes used.
(water content max. 0.001%, VWR Chemicals) was dried with For the ICP-MS measurements with MeCN the spray chamber
molecular sieve followed by vacuum filtration inside a glovebox. was cooled to 2 °C, a nebulizer gas flow of 0.6 l min–1 and an
The purification of methanol (max. water content 0.003%, oxygen gas flow of 0.06 l min–1 were used.
SeccoSolv, Merck) proved to be more difficult as upon drying,
even with activated 3 Å molecular sieves, water content lower than Results and Discussion
10 ppm could not be achieved. This is reasoned not only by the
Pt dissolution behavior in MeCN- and MeOH-based electro-
similarity in molecular volume of methanol and water but also due to
lytes.—MeCN and MeOH are both commonly used solvents and are
their similar pKa and adsorption heat values. In order to decrease the
the simplest representatives of nitriles and alcohols, respectively.
water content, methanol was distilled in a glovebox applying the
Both exhibit completely different electrochemical oxidation beha-
following procedure: 3 g of magnesium turnings were added to a
vior and are therefore relevant for different fields of applications.
batch of methanol (300 ml, 30 ppm water) in a round-bottomed flask
MeCN is widely used in organic electrochemistry because it has a
(500 ml). After an induction period of ca. 1 min upon stirring, metal
high relative permittivity (εr = 37.5) and a rather broad electro-
dissolution and hydrogen release started, while a solution of
chemical stability window, which makes it an attractive solvent for
magnesium methoxide in methanol was formed. After the gas
performing electrosynthesis.32 The value for the relative permittivity
evolution stopped, the solution was heated up to boiling and refluxed
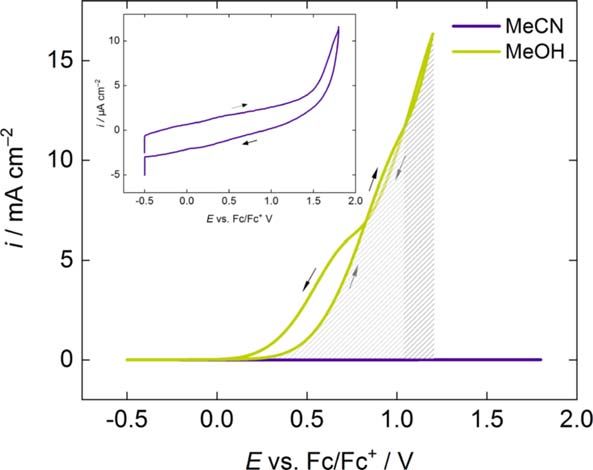
Figure 1. Applied potential profiles between –0.5 V and increasing upper potential limit recorded with 10 mV s–1 (top), measured current densities (middle) and
simultaneously detected Pt dissolution response (bottom) in (a) 0.05 mol l–1 LiClO4 containing MeCN, (b) 0.05 mol l–1 LiClO4 containing MeOH.Journal of The Electrochemical Society, 2020 167 121507
of MeOH (εr = 32.7) is comparable with MeCN, which makes include the oxidation of methanol and methoxide to form formalde-
MeOH-based electrolytes also attractive systems for electroorganic hyde, (1, 4) and CO, (2, 3, 5)) via 2 e– or 4 e– pathways. Protons
synthesis when protic apolar solvent properties are required.33,34 formed during the oxidation are reduced at the cathode to H2.
However, MeOH, contrary to MeCN, is oxidized at rather low
potentials, which also promoted research on MeOH as fuel candidate CH3OH CH2 O + 2H+ + 2e- [1]
for the direct alcohol fuel cell. Its oxidation products and degrada-
tion pathways have been extensively studied in both acidic and CH2 O CO + 2H+ + 2e- [2]
alkaline electrolytes.35–37
In order to study the Pt electrode dissolution in anhydrous (H2O CH3OH CO + 4H+ + 4e- [3]
content < 1 ppm) MeCN- and MeOH-based electrolytes, cyclic
voltammetry (CV) measurements were performed with a scan rate of
10 mV s–1 at 25 °C between –0.5 V and 1.8 V or 1.2 V increased by CH3O- CH2 O + H+ + 2e- [4]
0.1 V steps for MeCN and MeOH, respectively. The solvent
resistance was determined prior to each measurement and was found CH3O- CO + 3H+ + 4e- [5]
to be around 340 Ω and 140 Ω for the MeOH- and MeCN-based
electrolyte systems, respectively. This corresponds to 14 and 6 Ω In Figure 2b the concentration of dissolved Pt is plotted as a
cm2, which is comparable with aqueous systems.38 In MeOH-based function of applied potential. In this plot the onset of Pt dissolution
electrolyte the cell resistance was compensated using manual IR occurs in both cases around 0.5 V vs Fc/Fc+, yet clearly distinguish-
compensation (MIR 85%). The measurements in acetonitrile-based able regions in the CV can be identified in the dissolution profile.
electrolytes were not compensated. Owing to the very low measured Due to the good oxidation stability of acetonitrile no reaction
current values, the potential difference only accounts for 5–10 μV. intermediates, which influence the Pt dissolution, are formed.
The potential profiles and the corresponding current responses and Pt However, the Pt complexing capabilities of acetonitrile have to be
dissolution curves obtained in MeCN and MeOH are shown in mentioned here that can assist the solubilization and transport of
Figures 1a and 1b, respectively. The current curves clearly show the dissolved Pt from the surface into the bulk.42 In contrast, in MeOH
different electrochemical stability windows. While very low current Pt dissolution starts more slowly, but increases beyond 1 V and is
densities are measured for MeCN even at upper potential limits as significantly enhanced on the return scan. As the preferred oxidation
high as 1.8 V, the current densities for methanol are about three product at more positive potentials is CO, we associate this behavior
orders of magnitude higher than in MeCN. CVs with an upper to the observations of Pt dissolution in CO-saturated aqueous
potential limit higher than 1.2 V cannot be measured in MeOH electrolytes. In aqueous acidic electrolytes the saturation of the
because extensive gas evolution and bubble formation (H2 from the electrolyte with CO leads to a decreased dissolution of Pt during the
counter electrode and CO from the working electrode) interrupt the anodic sweep due to CO blockage of the surface. However, if the
measurement in the flow cell. Even though the current profiles show UPL of the CV exceeds the CO oxidation potential (0.85 V vs RHE)
very high currents for MeOH and low currents for MeCN, the Pt and subsurface oxide is formed (above 1.1 V vs RHE), increased Pt
dissolution profiles measured in both electrolytes have similar onset dissolution is detected during the cathodic scan. In addition to the
potentials and show similar growth with increasing upper potential cathodic Pt dissolution associated with Pt oxide reduction, CO is
limit (UPL). The total dissolved amounts (TDA) do not differ adsorbed again to the reduced Pt sites and blocks the surface for Pt
significantly, which will be discussed later and in both cases the only re-deposition, leading to an overall increased Pt dissolution.43 A
dissolution pathway observed is the anodic dissolution. similar line of argumentation was used to describe the increased Pt
In Figure 2a the CVs of Pt in MeOH- and MeCN-based dissolution from PtRu nanoalloys in acidic aqueous solution upon
electrolyte recorded at the highest upper potential limit are dis- addition of methanol.44
played. The CV of Pt in MeCN-based electrolyte (potential limits The total dissolved amounts (TDA) of Pt (shown in Figure 2c)
–0.5 V and 1.8 V) exhibits very low currents and the current vs. determined for each cycle as function of UPL give similar values.
potential curve (inset in Figure 2a) is rather featureless suggesting Both curves show an exponential growth and it seems that at the
that the measured current mainly originates from nonfaradaic potential region where formaldehyde is the preferred reaction
processes. This is in accordance with the previous findings of product of methanol oxidation the dissolution of Pt is somewhat
Suarez-Herrera et al., who studied voltammetric features of Pt suppressed compared to MeCN but gradually exceeds it as the
(111) electrodes in as received and dry acetonitrile solutions.39 oxidation turns to CO.
The CV recorded in MeOH shows an onset of MeOH oxidation at Additionally, the charge related to the dissolution of Pt, calcu-
potentials around 0.2 V vs Fc/Fc+. The curve increases exponen- lated from the ICP-MS data, is compared to the total charge,
tially until the reaction rate slows down at approximately 1 V calculated from the CV curve. In the calculation, we assumed that
followed by another exponential increase (indicated in Figure 2a the only reaction leading to dissolution is a two-electron process
with two different shades of gray below the curve of the forward resulting in the oxidation of Pt to Pt2+ ions. The obtained charge
scan). A similar behavior is observed in the backward scan. This ratio curves, in Figure 2d, show that in case of MeCN the charge
leads to the assumption that two different reactions occur, which is ratio for the dissolution of Pt increases linearly with increasing upper
in accordance with the proposed methanol oxidation mechanisms. potential limit, taking up more than 2% of the total charge measured
There are two pathways described in aqueous media, which possibly for the CV with the highest potential limit of 1.8 V. In MeOH on the
occur in parallel: (a) oxidation pathway which leads to the formation other hand, the dissolution charge contributes only to around 10–3%
of formaldehyde and formic acid as final products and starts with the of the total measured charge. It is also noteworthy that the curve for
adsorption of the MeOH molecule followed by two dehydrogenation the charge ratio linearly decreases at first and starts to increase again
steps; (b) formation of adsorbed CO species that can be further after reaching a minimum at 1 V. This phenomenon is in good
oxidized in aqueous electrolytes to the final product CO2. The agreement with the two different rates observed in the voltammo-
overall mechanism starts with the adsorption of MeOH and is gram and in the concentration vs potential curve since the crossing
followed by four dehydrogenation steps while requiring neighboring of the anodic and cathodic currents also happens around 1 V and the
Pt sites.35 The crucial role of OHad species on the catalyst surface for initial rather slow concentration increase in dissolved species is
the oxidation to the products formic acid and CO2 has been followed by a fast growth.
investigated and is described in literature.40,41 In the absence of
water or surface oxides, which is the case in anhydrous methanol, Temperature dependent Pt dissolution in MeCN- and MeOH-
formaldehyde was identified as main oxidation product, but also CO based electrolytes.—In order to study the temperature dependence of
is likely to be formed.41 Reactions occurring at the anode (see (1–5)) Pt dissolution, CVs were recorded between –0.5 V and 0.8 V, 0.9 V,Journal of The Electrochemical Society, 2020 167 121507
Figure 2. (a) Pt CVs recorded with 10 mV s–1 (between –0.5 V and 1.8 V or 1.2 V), (b) Pt dissolution vs potential (between –0.5 V and 1.2 V), (c) calculated
TDAs for CVs with increasing UPL and (d) calculated charge contribution of Pt dissolution measured in 0.05 mol l–1 LiClO4 containing MeCN (purple curve)
and in 0.05 mol l–1 LiClO4 containing MeOH (green curve).
1 V with a scan rate of 10 mV s–1 at 10 °C, 20 °C, 30 °C, 40 °C, 50 °
C together with online dissolution data. Every measurement was
carried out at least three times and a standard deviation was
calculated, which is indicated as error bars in the graphs. Before
each measurement EIS was conducted to determine the solution
resistance at each temperature. As expected, the solution resistance
steadily decreases with increasing temperature (see Figure 3). The
methanol-based system was compensated for the measured values
(MIR 85%). Between each temperature step the Pt electrode was
allowed to heat up to the programmed temperature for five minutes.
Figures 4a and 4b show the applied potential profiles and the
corresponding Pt dissolution curves in MeCN and MeOH, respec-
tively. The TDAs for all curves were calculated and are shown in
Figures 4c and 4d. In MeCN (see Figure 4c) an exponential increase
of dissolved Pt with increasing temperature is observed in all CVs
measured at the different upper potential limits. However, the
temperature dependent Pt dissolution in MeOH (see Figure 4d)
shows a different trend. Instead of an exponential increase the TDAs
obtained at potential limits of 0.8 V and 0.9 V resemble a linear fit
and the data points for the dissolution curve at 1 V even seem to
reach a plateau at higher temperatures (40 °C, 50 °C). Different
explanations can be found for the different temperature dependent Pt Figure 3. Measured solution resistances at 10 °C, 20 °C, 30 °C, 40 °C, 50 °
C in 0.05 mol l–1 LiClO4 containing MeCN (purple) and MeOH (green).
dissolution behaviors in MeCN- and MeOH-based media. TheJournal of The Electrochemical Society, 2020 167 121507 Figure 4. Potential profiles and corresponding dissolution curves of CVs between –0.5 V and 0.8, 0.9 and 1 V recorded with 10 mV s–1 in 0.05 mol l–1 LiClO4 containing (a) MeCN and (b) MeOH, calculated TDAs from CVs in (c) MeCN- and (d) MeOH-based electrolytes and corresponding dissolution charge for (e) MeCN- and (f) MeOH-based electrolytes at 10 °C, 20 °C, 30 °C, 40 °C and 50 °C.
Journal of The Electrochemical Society, 2020 167 121507
temperature dependent Pt dissolution in MeCN is the expected trend, electrolyte. Especially at higher temperatures where the methanol
since an increase in temperature often results in an acceleration of oxidation rate is high, the increase in Pt dissolution is relatively low.
the reaction rate. In this case the main reaction is the oxidation of Pt The formation and poisoning effect of reaction intermediates and
to Pt2+, since electrolyte degradation reactions barely play a role at products of the MeOH oxidation process has been discussed above
the applied potentials (see CVs in Figure 5). In MeOH, on the other as the reason for the comparably low temperature influence on Pt
hand, complex methanol degradation processes already occur at the dissolution in MeOH-based electrolytes. However, it might be also
applied potentials including the oxidation of MeOH to formaldehyde possible that a fast MeOH oxidation reaction taking place at the Pt
or CO.35 These products are known to block the catalyst surface and surface and a slower Pt oxidation compete, hindering catalyst
inhibit the MeOH oxidation process. This catalyst poisoning could dissolution.
not only have an effect on the product formation but also be the
reason for the low increase of Pt dissolution with temperature. Pseudo-van’t Hoff analysis of temperature dependent Pt
Especially, at higher temperatures, when the MeOH oxidation rate dissolution in MeCN- and MeOH-based electrolytes.—The van’t
increases, more product, which poisons the catalyst surface is Hoff equation (Eq. 6), where K is the reaction equilibrium constant,
formed and less Pt is dissolved. Figures 4e and 4f also suggest R is the universal gas constant, T is the temperature, ΔrH° is the
these findings, since the charge contribution for the Pt dissolution reaction enthalpy and ΔrS° is the reaction entropy at standard
increases in the MeCN-based system, whereas the dissolution charge conditions, describes the dependence of the reaction equilibrium
ratio even decreases for the MeOH-based system (Figure 4f), constant on temperature changes and allows to draw conclusions
especially for CVs with higher upper potential limit. about the enthalpy of a reaction.
The origin of the different temperature dependent Pt dissolution
behaviors in MeCN and MeOH is also illustrated in Figures 5 and 6. Dr H 1 D S
ln K = - + r [6]
In Figure 5a the concentration of dissolved Pt is plotted as a function R T R
of applied potentials and in Figure 5b CVs for UPL of 0.8, 0.9 and
1 V at all applied temperatures in MeCN-based electrolytes are In this study the calculated Pt TDAs for MeOH- and MeCN-
shown. The Pt CVs in MeCN-based electrolytes are featureless and based systems were used as the equilibrium constant K and plotted
no increase in current is observed with increasing UPL or tempera- and analyzed according to the van’t Hoff equation to illustrate the
ture. The dissolution of Pt, on the other hand, clearly increases both temperature dependence of Pt dissolution in both electrolyte
with temperature and UPL. In Figure 6a the dissolved Pt concentra- systems. In order to plot the Pt TDAs as the equilibrium constant,
tion plotted against the applied potentials and in Figure 6b the CVs the assumption that Pt re-deposition is negligible in our dynamic
obtained for the different temperatures in 0.05 mol l–1 LiClO4 flow cell has to be made. Therefore, we call this analysis pseudo-
containing MeOH for UPLs of 0.8, 0.9 and 1 V are shown. In the van’t Hoff analysis and the calculated enthalpies are pseudo-
case of the MeOH-based electrolyte a significant increase in current enthalpies. Nevertheless, the same reaction conditions were used
and therefore in the methanol oxidation rate with temperature and for different temperatures and electrolyte systems and trends can be
UPL is observed in the CVs. At the same time the measured Pt determined. The pseudo-van’t Hoff plots for the temperature
dissolution exhibits a relatively low growth rate with temperature dependent Pt dissolution in MeOH- and MeCN-based electrolytes
and significantly lower amounts compared to the MeCN-based for the upper potential limits of 0.8 V, 0.9 V and 1 V are shown in
Figure 5. Pt dissolution vs potential in (a) and CVs in (b) between –0.5 and 0.8, 0.9 and 1 V, respectively recorded with 10 mV s–1 in 0.05 mol l–1 LiClO4
containing MeCN at different temperatures (10 °C, 20 °C, 30 °C, 40 °C and 50 °C).Journal of The Electrochemical Society, 2020 167 121507
Figure 6 Pt dissolution vs potential in (a) and CVs in (b) between –0.5 and 0.8, 0.9 and 1 V, respectively recorded with 10 mV s–1 in 0.05 mol l–1 LiClO4
containing MeOH at different temperatures (10 °C, 20 °C, 30 °C, 40 °C and 50 °C).
Figure 7. The pseudo-ΔrH° values for the MeCN-based system are
(slope –3449.6 K) 28.7 kJ mol–1, (slope: –3188.8 K) 26.5 kJ mol–1,
(slope –3287.2 K) 27.3 kJ mol–1 and in the MeOH-based electrolyte
(slope –2908.3 K) 24.2 kJ mol–1, (slope –2436.3 K) 20.2 kJ mol–1
and (slope –2155.1 K) 17.9 kJ mol–1 were determined for the upper
potential limits 0.8 V, 0.9 V and 1 V, respectively. The negative
values for the slope and positive pseudo-ΔrH° values imply that Pt
dissolution in both electrolytes is an endothermic process. The
values for MeCN give similar results independent of the upper
potential limit and are comparable with 26 kJ mol–1 for aqueous
systems (1 and 5 mol l–1 H2SO425). In MeOH-based media the
calculated pseudo-enthalpies are smaller and decrease for CVs with
higher upper potential limits, which means that an increase in
temperature for CVs with higher UPLs in MeOH-based electrolytes
leads to a less significant shift in the reaction equilibrium to the
product side for the dissolution of Pt, also indicating the inhibition of
dissolution by the degradation products of methanol.
Conclusions
In this study we show for the first time the dissolution behavior of
Pt in 0.05 mol l–1 LiClO4 containing MeCN and MeOH at different
temperatures. At room temperature the Pt dissolution in both
electrolytes shows only anodic dissolution with similar total
dissolved amounts of Pt, even though MeOH can be regarded as a
reactive system that undergoes oxidation at the applied potentials,
whereas MeCN is seen as a stable solvent within the applied
potential range. In both electrolytes Pt exhibits an exponential
increase in dissolution with increasing upper potential limits.
For the temperature study, CVs with three different upper
potential limits were measured (0.8 V, 0.9 V and 1 V) at tempera-
tures ranging from 10 °C to 50 °C varied in 10 °C steps. Different
Figure 7. Pseudo-van’t Hoff plots for 0.05 mol l–1 LiClO4 containing temperature dependent dissolution behavior of Pt was observed in
MeCN (purple curves) and MeOH (green curves) for CVs with upper MeCN- and MeOH-based electrolytes. Pt dissolution in the MeCN-
potential limit of 0.8 V (top), 0.9 V (middle) and 1 V (bottom).
based electrolyte shows an exponential increase, whereas PtJournal of The Electrochemical Society, 2020 167 121507
dissolution in the MeOH-based electrolyte shows only a slight 13. P. P. Lopes, M. Zorko, K. L. Hawthorne, J. G. Connell, B. J. Ingram, D. Strmcnik,
increase with temperature. MeOH undergoes an oxidation process, V. R. Stamenkovic, and N. M. Markovic, J. Phys. Chem. Lett., 9, 4935 (2018).
14. S. O. Klemm, A. A. Topalov, C. A. Laska, and K. J. J. Mayrhofer, Electrochem.
which is enhanced with increasing temperature and upper potential Commun., 13, 1533 (2011).
limits. We postulate that the faster MeOH oxidation reaction at 15. P. Jovanovič, V. S. Šelih, M. Šala, and N. Hodnik, NPJ Mater. Degrad., 2, 9
elevated temperatures and the resulting increased concentration of (2018).
oxidation intermediates and products formed hinder the Pt dissolu- 16. J. Ranninger, S. J. Wachs, J. Möller, K. J. J. Mayrhofer, and B. B. Berkes,
Electrochem. Commun., 114, 106702 (2020).
tion. MeCN, on the other hand, is a stable solvent under the applied 17. A. W. Boorn and R. F. Browner, Anal. Chem., 54, 1402 (1982).
conditions. No increase in current is observed with increasing 18. P. Barrett and E. Pruszkowska, Anal. Chem., 56, 1927 (1984).
temperature or upper potential limit and no reaction products or 19. R. C. Hutton, J. Anal. At. Spectrom., 1, 259 (1986).
intermediates that could influence the Pt dissolution behavior are 20. H. A. Gasteiger, N. Markovic, J. Philip, N. Ross, and E. J. Cairns, J. Electrochem.
Soc., 141, 1795 (1994).
formed. 21. H. Uchida, K. Izumi, and M. Watanabe, J. Phys. Chem. B, 110, 21924 (2006).
22. T. J. Schmidt, V. Stamenkovic, J. P. N. Ross, and N. M. Markovic, Phys. Chem.
Acknowledgments Chem. Phys., 5, 400 (2003).
23. S. Cherevko, A. R. Zeradjanin, A. A. Topalov, G. P. Keeley, and K. J. J. Mayrhofer,
This work was supported by the German Research Foundation J. Electrochem. Soc., 161, H501 (2014).
(DFG) under Germany’s Excellence Strategy—Exzellenzcluster 24. S. Cherevko, A. A. Topalov, A. R. Zeradjanin, G. P. Keeley, and K. J. J. Mayrhofer,
2186 “The Fuel Science Center.” Electrocatalysis, 5, 235 (2014).
25. S. Mitsushima, Y. Koizumi, K. Ota, and N. Kamiya, Electrochem. Commun., 75,
155 (2007).
ORCID 26. G. Inzelt, B. Berkes, and Á. Kriston, Electrochim. Acta, 55, 4742 (2010).
27. B. Vanrenterghem, P. Jovanovič, M. Šala, M. Bele, V. S. Šelih, N. Hodnik, and
Johanna Ranninger https://orcid.org/0000-0002-1363-6812 T. Breugelmans, Electrochim. Acta, 286, 123 (2018).
Pavlo Nikolaienko https://orcid.org/0000-0002-1508-7589 28. C. Bianchini and P. K. Shen, Chem. Rev., 109, 4183 (2009).
Susanne J. Wachs https://orcid.org/0000-0002-5420-9892 29. J. K. Foley, C. Korzeniewski, and S. Pons, Can. J. Chem., 66, 201 (1988).
Karl J. J. Mayrhofer https://orcid.org/0000-0002-4248-0431 30. S. Pons and S. B. Khoo, Electrochim. Acta, 27, 1161 (1982).
31. V. V. Palishchuk and A. W. Addison, Inorg. Chim. Acta, 298, 97 (2000).
Balázs B. Berkes https://orcid.org/0000-0001-7457-6609 32. A. Shatskiy, H. Lundberg, and M. D. Kärkäs, ChemElectroChem, 6, 4067 (2019).
33. J.-I. Yoshida, K. Kataoka, R. Horcajada, and A. Nagaki, Chem. Rev., 108, 2265
References (2008).
34. D. S. P. Cardoso, B. Šljukić, D. M. F. Santos, and C. A. C. Sequeira, Org. Process
1. V. A. T. Dam and F. A. de Bruijn, J. Electrochem. Soc., 154, B494 (2007). Res. Dev., 21, 1213 (2017).
2. S. Mitsushima, S. Kawahara, K.-i. Ota, and N. Kamiya, J. Electrochem. Soc., 154, 35. E. A. Batista, G. R. P. Malpass, A. J. Motheo, and T. Iwasita, J. Electroanal. Chem.,
B153 (2007). 571, 273 (2004).
3. Y. Sugawara, T. Okayasu, A. P. Yadav, A. Nishikata, and T. Tsuru, J. Electrochem. 36. Y. X. Chen, A. Miki, S. Ye, H. Sakai, and M. Osawa, J. Am. Chem. Soc., 125, 3680
Soc., 159, F779 (2012). (2003).
4. S. Cherevko, G. P. Keeley, S. Geiger, A. R. Zeradjanin, N. Hodnik, N. Kulyk, and 37. J. Greeley and M. Mavrikakis, J. Am. Chem. Soc., 126, 3910 (2004).
K. J. Mayrhofer, ChemElectroChem, 2, 1471 (2015). 38. B. B. Berkes, A. Maljusch, W. Schuhmann, and A. S. Bondarenko, J. Phys. Chem.
5. P. Jovanovič, A. Pavlišič, V. S. Šelih, M. Šala, N. Hodnik, M. Bele, S. Hočevar, and C, 115, 9122 (2011).
M. Gaberšček, ChemCatChem, 6, 449 (2014). 39. M. F. Suarez-Herrera, M. Costa-Figueiredo, and J. M. Feliu, Langmuir, 28, 5286
6. P. P. Lopes, D. Strmcnik, D. Tripkovic, J. G. Connell, V. Stamenkovic, and N. (2012).
M. Markovic, ACS Catal., 6, 2536 (2016). 40. A. Ejigu, L. Johnson, P. Licence, and D. A. Walsh, Electrochem. Commun., 23, 122
7. S. Geiger et al., Nat. Catal., 1, 508 (2018). (2012).
8. F. D. Speck, P. G. Santori, F. Jaouen, and S. Cherevko, J. Phys. Chem. C, 123, 41. G. Bélanger, J. Electrochem. Soc., 123, 818 (1976).
25267 (2019). 42. S. F. Rach and F. E. Kühn, Chem. Rev., 109, 2061 (2009).
9. D. Aurbach, B. Markovsky, A. Rodkin, E. Levi, Y. S. Cohen, H.-J. Kim, and 43. A. A. Topalov, A. R. Zeradjanin, S. Cherevko, and K. J. J. Mayrhofer, Electrochem.
M. Schmidt, Electrochim. Acta, 47, 4291 (2002). Commun., 40, 49 (2014).
10. W. Choi and A. Manthiram, J. Electrochem. Soc., 153, A1760 (2006). 44. P. Jovanovič, V. S. Šelih, M. Šala, S. Hočevar, F. Ruiz-Zepeda, N. Hodnik,
11. T. Waldmann, M. Wilka, M. Kasper, M. Fleischhammer, and M. Wohlfahrt- M. Bele, and M. Gaberšček, Electrochim. Acta, 211, 851 (2016).
Mehrens, J. Power Sources, 262, 129 (2014).
12. J. Wandt, A. Freiberg, R. Thomas, Y. Gorlin, A. Siebel, R. Jung, H. A. Gasteiger,
and M. Tromp, J. Mater. Chem. A, 4, 18300 (2016).You can also read