Dynamics of Oxidative Stress in Helicobacter pylori-Positive Patients with Atrophic Body Gastritis and Various Stages of Gastric Cancer
←
→
Page content transcription
If your browser does not render page correctly, please read the page content below
diagnostics

Article
Dynamics of Oxidative Stress in Helicobacter pylori-Positive
Patients with Atrophic Body Gastritis and Various Stages of
Gastric Cancer
Vladislav Vladimirovich Tsukanov * , Olga Valentinovna Smirnova, Edward Vilyamovich Kasparov,
Alexander Alexandrovich Sinyakov , Alexander Viktorovich Vasyutin, Julia Leongardovna Tonkikh
and Mikhail Alexandrovich Cherepnin

                                          Scientific Research Institute of Medical Problems of the North, Federal Research Centre “Krasnoyarsk Science
                                          Centre” of the Siberian Branch of Russian Academy of Science, 660022 Krasnoyarsk, Russia;
                                          ovsmirnova71@mail.ru (O.V.S.); clinic@impn.ru (E.V.K.); sinyakov.alekzandr@mail.ru (A.A.S.);
                                          alexander@kraslan.ru (A.V.V.); tjulia@bk.ru (J.L.T.); mikhail.cherepnin@yandex.ru (M.A.C.)
                                          * Correspondence: gastro@impn.ru; Tel.: +7-391-2568171

                                          Abstract: Gastric cancer is a global health problem. The pathogenesis of this disease remains
                                          unclear. This study included 198 H. pylori (+) men aged 45 to 60 years old. Group A included
                                          63 practically healthy men, group B included 45 men with severe atrophic body gastritis, group C
                                          included 37 men with epithelial gastric cancer stages I–II according to TNM, and group D included
                                          54 men with epithelial gastric cancer stages III–IV according to the TNM scale. The content of
                                          malondialdehyde (MDA), diene conjugates (DCs), superoxide dismutase (SOD), catalase (CAT),
                                          glutathione S-transferase (GST), and glutathione peroxidase (GPO) was detected using an enzyme
Citation: Tsukanov, V.V.;
                                          immunoassay (ELISA) or spectrophotometric methods in the blood plasma. The concentrations of
Smirnova, O.V.; Kasparov, E.V.;
                                          MDA and DC were increased in the patients of group B compared with group A, and in patients
Sinyakov, A.A.; Vasyutin, A.V.;
Tonkikh, J.L.; Cherepnin, M.A.
                                          of groups C and D compared with groups A and B. The ratio of MDA/SOD and MDA/CAT was
Dynamics of Oxidative Stress in           decreased in the patients in group D compared with the patients in group C, and was significantly
Helicobacter pylori-Positive Patients     higher compared with group A. The ratios of MDA/GPO and MDA/GST increased linearly and
with Atrophic Body Gastritis and          were at a maximum in groups C and D. Our work determined that indicators of oxidative stress may
Various Stages of Gastric Cancer.         be the biochemical substrate, which brings together the various stages of the Correa cascade, and
Diagnostics 2022, 12, 1203.               may explain disease progression. The dynamics of changes in the content of SOD and CAT in the
https://doi.org/10.3390/                  plasma in patients with gastric cancer may be a target of future investigations.
diagnostics12051203

Academic Editor:                          Keywords: atrophic gastritis; gastric cancer; oxidative stress; lipid peroxidation; antioxidant protection;
Anastasios Koulaouzidis                   Helicobacter pylori

Received: 28 March 2022
Accepted: 6 May 2022
Published: 11 May 2022
                                          1. Introduction
Publisher’s Note: MDPI stays neutral
                                               In 2018, more than 1 million new cases of gastric cancer (GC) were detected worldwide
with regard to jurisdictional claims in
                                          and 782,683 deaths from this disease were registered [1]. The global age-standardized
published maps and institutional affil-
                                          incidence of gastric cancer is 11.1 per 100,000 people, and the mortality rate is 8.2 per
iations.
                                          100,000 people [2]. In Russia, the incidence of gastric cancer is high and varies in different
                                          regions, and is around 20–25 per 100,000 population [3]. The leading paradigm for the patho-
                                          genesis of gastric cancer is the Correa cascade, which postulates that Helicobacter pylori (H. pylori)
Copyright: © 2022 by the authors.
                                          infection causes the development of gastritis, which, under certain conditions, transforms into
Licensee MDPI, Basel, Switzerland.        atrophy, metaplasia, dysplasia, and gastric adenocarcinoma [4,5]. Regarding this, in 2019–2021,
This article is an open access article    European [6], British [7], and American [8,9] recommendations for the management of
distributed under the terms and           patients with precancerous changes in the stomach were published.
conditions of the Creative Commons             Currently, there are a number of works confirming the significance of oxidative stress
Attribution (CC BY) license (https://     regarding the development of gastritis and gastric cancer [10–12]. H. pylori disrupts in-
creativecommons.org/licenses/by/          tracellular processes in the epithelium, causing inflammation and epigenetic modifica-
4.0/).                                    tions [13,14]. Regarding inflammation, the response of the host organism is accompanied

Diagnostics 2022, 12, 1203. https://doi.org/10.3390/diagnostics12051203                                    https://www.mdpi.com/journal/diagnostics
Diagnostics 2022, 12, 1203 2 of 12
by the involvement of immune cells through their release of cytokines with the possible
formation of reactive oxygen species (ROS), which leads to oxidative stress and contributes
to deoxyribonucleic acid (DNA) damage and carcinogenesis [15]. In H. pylori-infected cells,
processes that prevent the activation of the immune and antioxidant systems of the host
organism occur [16]. Modern works have emphasized the prospects of studying oxidative
stress indicators, the results of which may influence the development of new approaches
for the prevention of gastric cancer [17–19].
Aim of Research
The aim of this research was to study the indicators of lipid peroxidation and antiox-
idant enzymes in the blood plasma of H. pylori-positive men with atrophic gastritis and
gastric cancer.
2. Materials and Methods
We examined 198 H. pylori-positive male patients aged 45 to 60 years old, among
which 63 were practically healthy men (group A), 45 were patients with atrophic body
gastritis (group B), 37 were patients with epithelial gastric cancer stages I–II according to
the international TNM classification (group C), and 53 were patients with epithelial gastric
cancer stages III–IV according to the international TNM classification (group D).
Group A included 63 men with a mean age of 48.7 ± 3.9 years old, without gastroen-
terological complaints and gastroenterological anamnesis. The recruitment of patients was
carried out from persons who underwent a planned medical examination at the Research
Institute of Medical Problems of the North, FRC KSC SB RAS. During medical monitoring,
patients underwent clinical and biochemical blood tests; X-ray diagnostics; electrocardio-
graphy; and routine consultations with a cardiologist, and, if indicated, other specialists.
Patients were included in group A only in the absence of severe chronic diseases of various
organs and systems. To exclude atrophic body gastritis, the content of pepsinogen-1 and
pepsinogen-2 was determined using an enzyme immunoassay using an ELISA analyzer
“MULTISKAN FC” (Thermo Fisher Scientific, Waltham, MA, USA) using the test system
“Gastropanel” (Biohit, Helsinki, Finland). The exclusion criteria for atrophic body gastritis
were the content of pepsinogen-1 in the blood serum being more than 50 µg/L and the
ratio of pepsinogen-1/pepsinogen-2 being more than 3.
Group B had 45 male patients (mean age 51.2 ± 4.9 years old) with chronic atrophic
body gastritis (CAG). For the diagnosis of atrophic body gastritis, a morphological study
of the biopsy specimens from three sections of the stomach obtained during fibroesoph-
agogastroduodenoscopy (FEGDS) was used in accordance with the modified Sydney
classification [20]. Group B included only patients with severe atrophic body gastritis.
Group C included 37 patients with stages I–II epithelial gastric cancer (mean age
51.2 ± 4.9 years) according to the international TNM classification. Group D included
53 patients with stages III–IV epithelial gastric cancer (mean age 53.2 ± 4.9 years old)
according to the international TNM classification [21]. The diagnosis of gastric cancer was
established by examining patients in the Krasnoyarsk Regional Oncological Dispensary
on the basis of comprehensive clinical and instrumental examination, which included
mandatory histological diagnostics.
In all of the examined groups, the determination of H. pylori was performed using a
13 C-urease breath test using the Iris Doc apparatus. Only H. pylori-positive patients were
included in the study.
The study material was venous blood, which was taken from patients in the morning,
after a 12 h fast, from the cubital vein into Vacutainer tubes with sodium heparin solution
(5 IU/mL). The blood plasma was isolated by centrifugation and was frozen at −80 ◦ C for
the biochemical analyses.
The concentrations of malonic dialdehyde (MDA), superoxide dismutase (SOD), cata-
lase (CAT), glutathione S-transferase (GST), and glutathione peroxidase (GPO) were mea-
sured using the enzyme immunoassay method (ELISA) on Thermo Scientific MultiskanDiagnostics 2022, 12, 1203 3 of 12
FC (Thermo Fisher Scientific, Waltham, MA, USA) apparatus using a human ELISA kit
(SunRed Biotechnology Company, Shanghai, China) based on sandwich-linked ELISA
using two specific and high affinity monoclonal antibodies. The concentration of studied
substances was measured in ng/mL.
The ratios of MDA/SOD, MDA/CAT, MDA/GPO, and MDA/GST were calculated.
The content of conjugated diene structures (DCs) of lipid hydroperoxides was deter-
mined by spectrophotometry on a GENESYS 10S UV–VIS (Thermo Fisher Scientific, USA)
apparatus, with measurements at a wavelength of 232 nm. The DC content was measured
in µmol/L [22].
The study was conducted with permission from the Ethics Committee of the Scientific
Research Institute of Medical Problems of the North, FRC KSC SB RAS (protocol no. 11
dated 11 November 2013). For working with the examined patients, the ethical principles
required by the Russian Federation Constitution and the Declaration of Helsinki from the
World Medical Association were met. All participants were informed of the purpose and
procedure of the study and were asked to provide written informed consent to the study
confirming their voluntary participation in the study.
Statistical Analysis
Statistical data processing was carried out using the Statistica 7.0 software package
(StatSoft, Tulsa, OK, USA). The analysis of the conformity of the type of distribution of the
sign to the law of normal distribution was carried out using the Shapiro–Wilk test. The me-
dian (Me) and interquartile range of percentiles (C25 –C75 ) were calculated when describing
the sample. The significance of differences between the indicators of independent samples
was assessed using the Mann–Whitney U test for pairwise comparison of groups and the
Kruskal–Wallis H test to compare multiple groups (p < 0.05).
3. Results
We analyzed the gender, age, anthropometric, anamnestic characteristics, and labora-
tory parameters of the examined patients. Patients were gender identical (only males were
examined) and practically did not differ in age. A decrease in body weight and an increase
in the content of white blood cells in the blood were found in both groups of patients with
gastric cancer in comparison with healthy individuals and persons with atrophic gastritis.
Hemoglobin and erythrocytes decreased, and the neutrophil-to-lymphocyte ratio increased
in patients with stages III–IV gastric cancer compared with healthy individuals and persons
with atrophic gastritis. With the increase in stage of gastric cancer, the frequency of tobacco
smoking increased and the frequency of alcohol consumption decreased (Table 1).
Table 1. Anthropometric and anamnestic characteristics and laboratory parameters of patients with
atrophic gastritis and gastric cancer.
1. Control Group 2. CAG GC Stages I–II GC Stages III–IV
Parameter (n = 63) (n = 45) (n = 37) (n = 53)
p p p p
Men/Women 63/0 45/0 37/0 53/0
n/n
48.9 (45.6–55.4) 51.1 (46.1–56.0) 51.4 (46.3–56.4) 53.0 (46.9–57.8)
Age. years p1–2 = 0.8 p1–3 = 0.8 p1–4 = 0.6
Me (C25 –C75 ) p2–3 > 0.9 p2–4 = 0.8
p3–4 = 0.8
179 (173–185) 178 (172–184) 176 (171–182) 177 (172–183)
Height, cm p1–2 = 0.9 p1–3 = 0.7 p1–4 = 0.8
Me (C25 –C75 ) p2–3 = 0.8 p2–4 > 0.9
p3–4 = 0.9Diagnostics 2022, 12, 1203 4 of 12
Table 1. Cont.
1. Control Group 2. CAG GC Stages I–II GC Stages III–IV
Parameter (n = 63) (n = 45) (n = 37) (n = 53)
p p p p
83.0 (74.5–91.0) 81.0 (72.0–90.5) 67.0 (59.5–75.0) 61.0 (54.5–68.0)
Weight, kg p1–2 = 0.8 p1–3 = 0.003 p1–4 < 0.001
Me (C25 –C75 ) p2–3 = 0.008 p2–4 < 0.001
p3–4 = 0.1
12 (19.0%) 13 (28.9%) 13 (35.1%) 20 (37.7%)
Tobacco smoking p1–2 = 0.3 p1–3 = 0.1 p1–4 = 0.04
Abs. (%) p2–3 = 0.7 p2–4 = 0.5
p3–4 > 0.9
23 (36.5%) 18 (40.0%) 10 (27.0%) 10 (18.9%)
Alcohol consumption p1–2 = 0.8 p1–3 = 0.4 p1–4 = 0.06
Abs. (%) p2–3 = 0.3 p2–4 = 0.04
p3–4 = 0.5
14.1 (12.4–15.7) 13.1 (11.2–14.9) 11.7 (9.9–13.6) 10.4 (8.7–12.3)
Hemoglobin, g/dL p1–2 = 0.4 p1–3 = 0.02 p1–4 = 0.005
Me (C25 –C75 ) p2–3 = 0.2 p2–4 = 0.03
p3–4 = 0.3
4.7 (4.1–5.2) 4.5 (3.8–4.9) 4.1 (3.5–4.7) 3.7 (3.3–4.2)
Red blood cells,
p1–2 = 0.6 p1–3 = 0.06 p1–4 = 0.01
×1012 /L
p2–3 = 0.3 p2–4 = 0.04
Me (C25 –C75 )
p3–4 = 0.5
5.6 (4.4–6.9) 5.3 (4.1–6.7) 9.6 (7.1–11.7) 9.9 (7.3–12.1)
White blood cells,
p1–2 = 0.8 p1–3 = 0.005 p1–4 = 0.003
×109 /L
p2–3 = 0.003 p2–4 < 0.001
Me (C25 –C75 )
p3–4 = 0.7
271 (216–338) 254 (194–319) 308 (176–444) 298 (165–413)
Platelet, ×109 /L p1–2 = 0.7 p1–3 = 0.2 p1–4 = 0.6
Me (C25 –C75 ) p2–3 = 0.1 p2–4 = 0.4
p3–4 = 0.8
2.21 (1.46–3.02) 1.98 (1.24–2.73) 2.86 (1.54–4.24) 3.15 (1.72–4.58)
Neutrophil-to-
p1–2 = 0.8 p1–3 = 0.5 p1–4 = 0.04
lymphocyte ratio
p2–3 = 0.1 p2–4 = 0.03
Me (C25 –C75 )
p3–4 = 0.7
Note: the significance of differences in indicators was calculated using the Mann–Whitney U test and χ2 .
The content of lipid peroxidation products in the blood plasma was significantly
increased in patients with gastric cancer in comparison with the control group, which con-
sisted of practically healthy individuals, and with the atrophic gastritis group. For example,
the level of MDA in the plasma of patients with stages III–IV gastric cancer was 72.7 times
higher, and DC was 7.7 times higher in comparison with group A. It is noteworthy that in
patients with severe atrophic body gastritis, a significant increase in both the primary and
end products of blood lipid peroxidation was also determined in comparison with group A
(Figures 1 and 2).
The significance of differences was assessed by the Kruskal–Wallis H test and Mann–
Whitney U test. Kruskal–Wallis H test: p < 0.001.
Mann–Whitney U test: p1–2 = 0.03; p2–3 = 0.03; p3–4 = 0.02.
The significance of differences was assessed using the Kruskal–Wallis H test and
Mann–Whitney U test. Kruskal–Wallis H test: p < 0.001.
Mann–Whitney U test: p1–2 = 0.02; p2–3 = 0.001; p3–4 = 0.02.increased in patients
The content withperoxidation
of lipid gastric cancer in comparison
products with the
in the blood plasmacontrol
wasgroup, which
significantly
consisted in
increased of patients
practically healthy
with individuals,
gastric and with the
cancer in comparison atrophic
with gastritis
the control group.
group, For
which
example, the
consisted level of MDA
of practically in theindividuals,
healthy plasma of patients
and withwith
thestages III–IV
atrophic gastric group.
gastritis cancer was
For
72.7 timesthehigher,
example, level ofand
MDA DCinwas 7.7 times
the plasma higher with
of patients in comparison
stages III–IV with group
gastric A. It
cancer wasis
Diagnostics 2022, 12, 1203 noteworthy that in patients with severe atrophic body gastritis, a significant
72.7 times higher, and DC was 7.7 times higher in comparison with group A.5 ofIt12is increase in
both the primary
noteworthy that inand end products
patients of blood
with severe lipidbody
atrophic peroxidation
gastritis, awas also determined
significant increase in
comparison
both with group
the primary and end A (Figures
products1 of
and 2). lipid peroxidation was also determined in
blood
comparison with group A (Figures 1 and 2).
Figure 1. The content of diene conjugates in the blood plasma of patients with atrophic gastritis and
Figure 1. The content of diene conjugates in the blood plasma of patients with atrophic gastritis and
gastric 1.
Figure cancer.
The content of diene conjugates in the blood plasma of patients with atrophic gastritis and
gastric cancer.
gastric cancer.
Figure 2. The content of malonic dialdehyde in the blood plasma of patients with atrophic gastritis
and gastric
Figure cancer.
2. The content of malonic dialdehyde in the blood plasma of patients with atrophic gastritis
Figure 2. The content of malonic dialdehyde in the blood plasma of patients with atrophic gastritis
and gastric cancer.
and gastric cancer.
All of the indicators of antioxidant protection we studied could be divided into the
following two units: the main bifunctional system (SOD and CAT) and the glutathione link
(GST and GPO). In patients with CAG and GC stages I–II, unidirectional increases in the
concentration of superoxide dismutase and catalase enzymes relative to the control were
detected. In patients with gastric cancer stages III–IV, differences were found in the form of
a slight increase in the concentration of SOD and a severe increase in the content of CATDiagnostics 2022, 12, 1203 6 of 12
(Table 2). Enzymes of the glutathione link also showed their activity in different ways in
the groups; there was an increase in the content of GST and GPO in patients with CAG and
GC stages I–II, and an unbalanced activity in patients with GC stages III–IV in the form of
a significant decrease in GST, and a slight increase in the concentration of GPO.
Table 2. Indicators of antioxidant enzymes in the blood plasma in patients with atrophic gastritis and
gastric cancer.
1. Control Group (n= 63) 2. CAG (n = 45) GC Stages I–II (n = 37) GC Stages III–IV (n = 53)
Groups
Me (C25 –C75 ) Me (C25 –C75 ) Me (C25 –C75 ) Me (C25 –C75 )
Indicators
p p p p
0.234 (0.225–0.252) 0.347 (0.295–0.386) 0.489 (0.512–0.605) 0.765 (0.754–0.805)
p1–2 = 0.001 p1–3 = 0.03 p1–4 < 0.001
SOD, ng/mL
p2–3 = 0.02 p2–4 < 0.001
p3–4 = 0.02
0.472 (0.456–0.489) 0.987 (0.972–1.12) 1.86 (1.37–2.4) 4.52 (3.16–5.1)
p1–2 = 0.03 p1–3 = 0.003 p1–4 < 0.001
CAT, ng/mL
p2–3 = 0.01 p2–4 < 0.001
p+ = 0.02
241.3 (237.7–262.4) 384.2 (375.1–407.3) 448.6 (439.3–484.6) 217.6 (203.4–229.3)
p1–2 = 0.01 p1–3 = 0.01 p1–4 = 0.01
GST, ng/mL
p2–3 = 0.002 p2–4 = 0.01
p3–4 = 0.02
30.9 (21.4–62.9) 58.6 (42.1–76.5) 97.4 (78.1–104.4) 113.7 (105.2–131.7)
GPO, ng/mL
p1–2 = 0.03 p1–3 = 0.001 p1–4 < 0.001
p2–3 = 0.003 p2–4 < 0.001
p3–4 = 0.02
Note: the significance of differences in indicators was calculated using the Mann–Whitney U test.
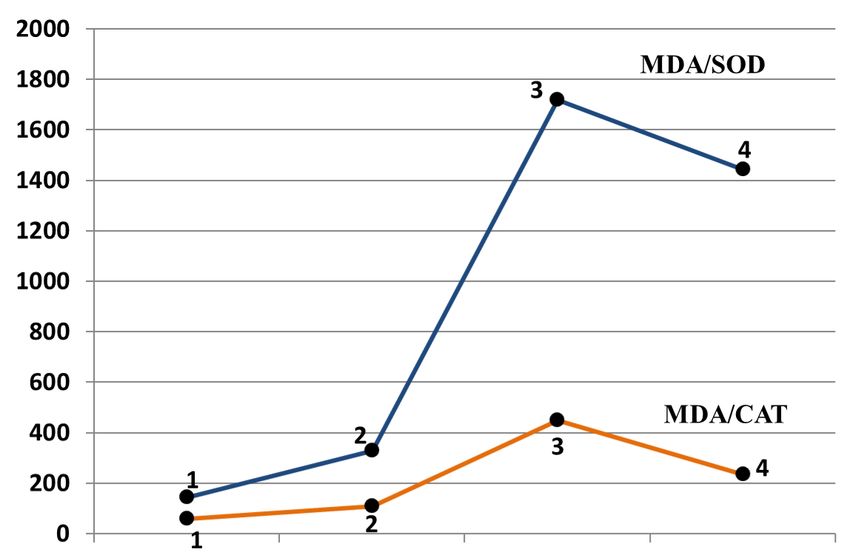
To assess the dynamics of the relationship between lipid peroxidation and antioxidant
protection factors, we studied the relationship of MDA and the studied antioxidant enzymes.
The patterns obtained were not unidirectional. The ratio of MDA/SOD and MDA/CAT
clearly decreased in the patients in group D compared with the patients in group C, and
were significantly higher in comparison with group A. This indicated that in patients with
stages III–IV gastric cancer, the dynamics of an increase in SOD and CAT in the plasma was
higher in comparison with the change in the concentration of MDA than in patients with
stages I–II gastric cancer (Figure 3).
The ratios of MDA/GPO and MDA/GST had simpler and more obvious linear char-
acteristics. The MDA/GST ratio was significantly increased in group D compared with
groups A, B, and C. Significant differences in the MDA/GPO ratio were recorded when
comparing group D with group A and group B (Figure 4).Diagnostics 2022, 12, x FOR PEER REVIEW 7 of 13
Diagnostics 2022, 12, 1203Diagnostics 2022, 12, x FOR PEER REVIEW 7 of 12 7 of 13
Figure 3. Concentration ratios of malonic dialdehyde to superoxide dismutase and malonic
dialdehyde to catalase in the blood plasma of patients with atrophic gastritis and gastric cancer.
1—Group A; 2—Group B; 3—Group C; 4—Group D. The significance of differences was assessed
by the Kruskal–Wallis H test and Mann–Whitney U test. Kruskal–Wallis H test: MDA/SOD р <
Figure 3. Concentration ratios of malonic dialdehyde to superoxide dismutase and malonic
0.001; MDA/CAT
Figure р < 0.001. Mann–Whitney
3. Concentration ratios of malonic U test MDA/SOD:
dialdehyde p1–2 = 0.03, p2–3
to superoxide < 0.001, p3–4
dismutase and= 0.02.
malonic dialde-
dialdehyde to catalase in the blood plasma of patients with atrophic gastritis and gastric cancer.
Mann–Whitney U test MDA/CAT:
in1—Group p1–2 = 0.02,
the bloodA;plasma ppatients
2–3 < 0.001, p3–4 =atrophic
0.02.
hyde to catalase 2—Group B; 3—Group C; 4—Group D. The significance of differences
of with gastritis and gastric cancer. 1—Group was assessed
A; 2—Group B; 3—Groupby the Kruskal–Wallis
C; 4—Group D.HThe testsignificance
and Mann–Whitney U test.was
of differences Kruskal–Wallis
assessed by H thetest: MDA/SOD р <
Kruskal–
The ratios of MDA/GPO and MDA/GST had simpler Uand more obvious linear
0.001; MDA/CAT
Wallis H test and Mann–Whitney Uр test.
< 0.001. Mann–Whitney
Kruskal–Wallis H test:testMDA/SOD
MDA/SOD: pp1–2
< =0.001;
0.03, MDA/CAT
p2–3 < 0.001, p3–4 = 0.02.
characteristics. The MDA/GST
Mann–Whitney ratio wasMDA/CAT:
U test significantlyp1–2 =increased in group
0.02, p2–3 < 0.001, p3–4 = D compared
0.02.
p < groups
with 0.001. Mann–Whitney U test MDA/SOD:
A, B, and C. Significant p1–2in=the
differences 0.03, p2–3 < 0.001,
MDA/GPO p3–4
ratio = 0.02.
were Mann–Whitney U
recorded
test MDA/CAT: p
when comparing group DThe
1–2 = 0.02, p
withratios< 0.001, p
groupofAMDA/GPO
2–3 = 0.02.
and group Band
3–4 (Figure 4).
MDA/GST had simpler and more obvious linear
characteristics. The MDA/GST ratio was significantly increased in group D compared
with groups A, B, and C. Significant differences in the MDA/GPO ratio were recorded
when comparing group D with group A and group B (Figure 4).
Figure 4. Concentration ratios of malonic dialdehyde to glutathione peroxidase and malonic dialde-
hyde to glutathione S-transferase in the blood plasma of patients with atrophic gastritis and gastric
cancer. 1—Group A; 2—Group B; 3—Group C; 4—Group D. The significance of differences was
assessed using the Mann–Whitney U test. Kruskal–Wallis H test: MDA/GST p < 0.001; MDA/GPO
p < 0.001. Mann–Whitney U test MDA/GST: p1–2 = 0.03, p2–3 < 0.001, p3–4 < 0.02; Mann–Whitney U
test MDA/GPO: p1–2 = 0.06, p2–3 < 0.001, p3–4 < 0.001.Diagnostics 2022, 12, 1203 8 of 12
4. Discussion
Oxidative stress is one of the significant aspects of the pathogenesis of diabetes,
atherosclerosis, neurodegenerative diseases, and cancer of various localizations [23–25].
Reactive oxygen species (ROS), which include superoxide (•O2 − ), hydrogen peroxide
(H2 O2 ), and singlet oxygen and hydroxyl radical (•OH), are generally considered to be
strong oxidizing agents and can accumulate in the organism when exposed to ultraviolet
radiation, radiation exposure, over nutrition, and tobacco smoking [26]. The accumulation
of ROS leads to the oxidation of biological macromolecules, which include proteins, lipids,
and nucleic acids, causing their structural and functional changes. The oxidation of fatty
acids leads to the formation of aldehydes. Currently, the most studied fatty acid is MDA [27].
MDA plays an essential role in cellular processes and can promote DNA changes, which is
one of the stages of carcinogenesis [28–30].
The organism has a mechanism to protect it from oxidative stress and lipid peroxida-
tion products. The main enzymatic antioxidants are superoxide dismutase (SOD), catalase
(CAT), glutathione peroxidase (GPO), and glutathione S-transferase (GST). SOD catalyzes
the dismutation of superoxide into oxygen and hydrogen peroxide. There are works that
show that a decrease in the activity of SOD in the intestine causes stomach ulcers, and an
increase in the activity of SOD is associated with the healing of ulcerative defects [31].
It has been shown that in the tissues of adenocarcinoma of the stomach and squamous
cell carcinomas of the esophagus, there is an increased expression of manganese SOD
compared with the normal mucosa [32]. Regarding the issue of changes in SOD activity
during carcinogenesis, there is no single point of view. Thus, a decrease in SOD activity in
the tumor tissue compared with healthy tissue has been observed in non-small-cell lung
cancer [33], bladder cancer [34], and ovarian cancer [35]. An increase in the activity of this
enzyme has been reported in colorectal cancer in tumor tissue [36] and blood serum [37].
CAT is a cellular enzyme that dismutates H2 O2 into H2 O and O2 [38]. H. pylori is
capable of synthesizing CAT for deactivate H2 O2 and surviving in the host organism [39].
A decrease in the activity of CAT has been recorded in patients with gastric adenocarci-
noma [40].
GPO converts glutathione (GSH) to its oxidized form (GS-SG), and during this process,
reduces H2 O2 to H2 O. It has been argued that GPO provides the first line of defense against
reactive oxygen species in the gut [41]. GST belongs to the family of metabolic isoenzymes
and has the ability to catalyze the conjugation of GSH with xenobiotic substrates for the
purpose of detoxification [42,43].
A number of studies have been devoted to the role of oxidative stress and H. pylori
in the pathogenesis of gastric cancer [17,29,44,45]. H. pylori virulence factors activate
the signaling pathways of oxidative stress and are mediators of chronic inflammation
in host cells. H. pylori is able to block the antibacterial effect of neutrophils and induce
DNA methylation, which stimulates cell proliferation towards poorly differentiated gastric
cells [12]. H. pylori strains containing CagA and VacA are characterized by an increased
survival and adhesion ability, which increases damage to gastric epithelial cells and makes
it possible to evade the immune response of the macro-organism [46]. It is known that
CagA strains, as a result of the expression of spermine oxidase (SMO), induce higher levels
of hydrogen peroxide (H2 O2 ) production, which activate caspase-mediated epitheliocyte
apoptosis and oxidative DNA damage [47,48]. CagA positivity is largely associated with
an increased expression of tumor necrosis factor α (TNFα) and interleukin (IL)-8, both
of which are markers of inflammation and oxidative stress [49]. Vacuolating cytotoxin
A (VacA) induces Ca2+ influx, production of reactive oxygen species (ROS), activation of
the nuclear factor kappa light chain enhancer of B cell activation (NFκB), and increased
expression of chemokines, presumably increasing the influx of pro-inflammatory immune
system cells to the site of bacterial infection of H. pylori [50].
Vacuolating cytotoxin A (VacA) induces Ca2+ influx, the production of reactive oxy-
gen species (ROS), activation of the nuclear factor of kappa light chain enhancer of B
cell activation (NFκB), and increased expression of chemokines, presumably increasingDiagnostics 2022, 12, 1203 9 of 12
the influx of pro-inflammatory cells of the immune system to the site of H. pylori infec-
tion [50]. Intracellular Ca2+ and ROS of granulocytes further lead to oxidative stress [51,52].
VacA disrupts autophagy in human gastric epithelial cells and increases cellular ROS,
which initiate the creation of an environment conducive to oxidative DNA damage with
subsequent neoplastic transformations and cancer development [53,54].
An additional virulence factor of H. pylori, γ-glutamyltransferase (GGT), induces
the production of H2 O2 in gastric epithelial cells, and increases NFκB activation and
the production of IL-8, a cytokine with pro-oncogenic properties [55–57]. Urease and
neutrophil-activating protein A (NapA) are two virulence factors of H. pylori that promote
neutrophil infiltration and ROS production [58]. Infiltrating neutrophils are characterized
by increased resistance to apoptosis, have an extended lifespan, and are potential factors
contributing to chronic inflammation caused by H. pylori infection [58–60]. NapA also has
the function of attracting neutrophils to the site of infection and induces a respiratory burst
of infiltrating neutrophils, which contributes to cellular oxidative stress and DNA damage.
Hypothetically, neutrophil ROS should nonspecifically kill both infected and uninfected
cells, as well as the pathogen. In addition, NapA protects H. pylori from the release of
oxyradicals, maintaining the cycle of neutrophil infiltration and oxidative burst [61,62].
In macrophages, H. pylori also increases SMO expression and H2 O2 release, which induces
apoptosis in these cells [48].
Our results indicating a significant increase in lipid peroxidation in patients with
stomach cancer are consistent with previously expressed views. We did not find information
in the available literature that would allow us to clearly interpret the heterogeneous changes
in antioxidant enzymes in patients with stages III–IV stomach cancer. One of the possible
explanations for the severe increase in CAT in the blood of patients with stages III–IV
stomach cancer may be that CAT belongs to intracellular enzymes, and metastatic stages
of cancer are accompanied by massive cell cytolysis and the release of enzymes into the
extracellular space.
5. Conclusions
This study used four groups of patients—practically healthy individuals, patients with
severe atrophic body gastritis, and patients with gastric cancer of various stages according
to the TNM classification—and led to several important results. Firstly, oxidative stress
plays an important role in the pathogenesis of gastric cancer. Secondly, we demonstrated
the presence of oxidative stress in the blood plasma of patients in group B in comparison
with the patients in group A. From our point of view, these data confirm the reality of
the Correa cascade. At the same time, indicators of oxidative stress can be a biochemical
substrate that brings together different stages of the cascade and determines the progress of
the disease. Third, another interesting pattern of our work was that we determined a severe
increase in the concentrations of SOD and CAT in the blood plasma of patients with stages
III–IV gastric cancer. In group D, the intensity of the increase in the content of SOD and
CAT in the blood plasma was higher than the increase in the content of MDA. A similar
pattern was not observed for glutathione enzymes. We hope that further research will be
useful in explaining this phenomenon.
Author Contributions: Conceptualization, V.V.T.; methodology, O.V.S.; clinical examination, E.V.K.,
J.L.T. and M.A.C.; laboratory investigation, A.A.S.; data curation, A.A.S. and A.V.V.; statistical analysis,
A.A.S., A.V.V. and M.A.C.; writing—original draft preparation, O.V.S.; writing—review and editing,
V.V.T.; writing—English translation, A.V.V. and J.L.T.; project administration, V.V.T. All authors have
read and agreed to the published version of the manuscript.
Funding: This research received no external funding.
Institutional Review Board Statement: The study was conducted in accordance with the Declaration
of Helsinki, and was approved by the Institutional Ethics Committee of the Scientific Research
Institute of Medical Problems of the North, FRC KSC SB RAS (protocol no. 11, date of approval
11 November 2013).Diagnostics 2022, 12, 1203 10 of 12
Informed Consent Statement: Informed consent was obtained from all of the subjects involved in
the study.
Data Availability Statement: Not applicable.
Conflicts of Interest: The authors declare no conflict of interest.
References
1. Bray, F.; Ferlay, J.; Soerjomataram, I.; Siegel, R.L.; Torre, L.A.; Jemal, A. Global cancer statistics 2018: GLOBOCAN estimates of
incidence and mortality worldwide for 36 cancers in 185 countries. CA Cancer J. Clin. 2018, 68, 394–424. [CrossRef]
2. Thrift, A.P.; Nguyen, T.H. Gastric Cancer Epidemiology. Gastrointest. Endosc. Clin. N. Am. 2021, 31, 425–439. [CrossRef]
3. Tsukanov, V.V.; Butorin, N.N.; Maady, A.S.; Shtygasheva, O.V.; Amelchugova, O.S.; Tonkikh, J.L.; Fassan, M.; Rugge, M.
Helicobacter pylori Infection, Intestinal Metaplasia, and Gastric Cancer Risk in Eastern Siberia. Helicobacter 2011, 16, 107–112.
[CrossRef]
4. Correa, P. Gastric cancer: Overview. Gastroenterol. Clin. N. Am. 2013, 42, 211–217. [CrossRef]
5. Rugge, M.; Savarino, E.; Sbaraglia, M.; Bricca, L.; Malfertheiner, P. Gastritis: The clinico-pathological spectrum. Dig. Liver Dis.
2021, 53, 1237–1246. [CrossRef]
6. Pimentel-Nunes, P.; Libânio, D.; Marcos-Pinto, R.; Areia, M.; Leja, M.; Esposito, G.; Garrido, M.; Kikuste, I.; Megraud, F.;
Matysiak-Budnik, T.; et al. Management of epithelial precancerous conditions and lesions in the stomach (MAPS II): European
Society of Gastrointestinal Endoscopy (ESGE), European Helicobacter and Microbiota Study Group (EHMSG), European Society
of Pathology (ESP), and Sociedade Portuguesa de Endoscopia Digestiva (SPED) guideline update 2019. Endoscopy 2019, 51,
365–388. [CrossRef]
7. Banks, M.; Graham, D.; Jansen, M.; Gotoda, T.; Coda, S.; di Pietro, M.; Uedo, N.; Bhandari, P.; Pritchard, D.M.; Kuipers, E.J.; et al.
British Society of Gastroenterology guidelines on the diagnosis and management of patients at risk of gastric adenocarcinoma.
Gut 2019, 68, 1545–1575. [CrossRef]
8. Gupta, S.; Li, D.; El Serag, H.B.; Davitkov, P.; Altayar, O.; Sultan, S.; Falck-Ytter, Y.; Mustafa, R.A. AGA Clinical Practice Guidelines
on Management of Gastric Intestinal Metaplasia. Gastroenterology 2020, 158, 693–702. [CrossRef]
9. Shah, S.C.; Piazuelo, M.B.; Kuipers, E.J.; Li, D. AGA Clinical Practice Update on the Diagnosis and Management of Atrophic
Gastritis: Expert Review. Gastroenterology 2021, 161, 1325–1332.e7. [CrossRef]
10. Yanaka, A. Sulforaphane enhances protection and repair of gastric mucosa against oxidative stress in vitro, and demonstrates
anti-inflammatory effects on Helicobacter pylori-infected gastric mucosae in mice and human subjects. Curr. Pharm. Des. 2011, 17,
1532–1540. [CrossRef]
11. Danis, N.; Ozkan, A.E.; Karatas, F.; Cakici, C.; Yigitbasi, T.; Sevencan, N.O.; Kayhan, B. The importance of antioxidant status in
gastric intestinal metaplasia. J. Med. Biochem. 2021, 40, 378–383. [CrossRef]
12. Jain, U.; Saxena, K.; Chauhan, N. Helicobacter pylori induced reactive oxygen Species: A new and developing platform for
detection. Helicobacter 2021, 26, e12796. [CrossRef]
13. De Falco, M.; Lucariello, A.; Iaquinto, S.; Esposito, V.; Guerra, G.; De Luca, A. Molecular Mechanisms of Helicobacter pylori
Pathogenesis. J. Cell. Physiol. 2015, 230, 1702–1707. [CrossRef]
14. Valenzuela, M.A.; Canales, J.; Corvalán, A.H.; Quest, A.F. Helicobacter pylori-induced inflammation and epigenetic changes
during gastric carcinogenesis. World J. Gastroenterol. 2015, 21, 12742–12756. [CrossRef]
15. Zhang, R.G.; Duan, G.C.; Fan, Q.T.; Chen, S.Y. Role of Helicobacter pylori infection in pathogenesis of gastric carcinoma. World J.
Gastrointest. Pathophysiol. 2016, 7, 97–107. [CrossRef]
16. Buommino, E.; Donnarumma, G.; Manente, L.; De Filippis, A.; Silvestri, F.; Iaquinto, S.; Tufano, M.A.; De Luca, A. The Helicobacter
pylori protein HspB interferes with Nrf2/Keap1 pathway altering the antioxidant response of Ags cells. Helicobacter 2012, 17,
417–425. [CrossRef]
17. Han, L.; Shu, X.; Wang, J. Helicobacter pylori-Mediated Oxidative Stress and Gastric Diseases: A Review. Front. Microbiol. 2022,
13, 811258. [CrossRef]
18. Wu, Z.; Wang, L.; Wen, Z.; Yao, J. Integrated analysis identifies oxidative stress genes associated with progression and prognosis
in gastric cancer. Sci. Rep. 2021, 11, 3292. [CrossRef]
19. Braga-Neto, M.B.; Costa, D.V.S.; Queiroz, D.M.M.; Maciel, F.S.; de Oliveira, M.S.; Viana-Junior, A.B.; Santos, F.A.; Leitao, R.F.C.;
Brito, G.A.C.; Vasconcelos, P.R.L.; et al. Increased Oxidative Stress in Gastric Cancer Patients and Their First-Degree Relatives: A
Prospective Study from Northeastern Brazil. Oxid. Med. Cell. Longev. 2021, 2021, 6657434. [CrossRef]
20. Dixon, M.F.; Genta, R.M.; Yardley, J.H.; Correa, P. Classification and grading of gastritis. The updated Sydney System. International
Workshop on the Histopathology of Gastritis, Houston 1994. Am. J. Surg. Pathol. 1996, 20, 1161–1181. [CrossRef]
21. Brierley, J.D.; Gospodarowicz, M.K.; Wittekind, C. TNM Classification of Malignant Tumours, 8th ed.; Wiley Blackwell: Hoboken,
NJ, USA, 2017; pp. 63–67. Available online: https://www.wiley.com/en-gb/TNM+Classification+of+Malignant+Tumours%2C+
8th+Edition-p-9781119263579 (accessed on 5 May 2022).
22. Gavrilov, V.B.; Gavrilova, A.R.; Khmara, N.F. Measurement of diene conjugates in blood plasma using the UV absorption
of heptane and isopropanol extracts. Lab. Delo 1988, 2, 60–64. Available online: https://pubmed.ncbi.nlm.nih.gov/2452294
(accessed on 5 May 2022). (In Russian)Diagnostics 2022, 12, 1203 11 of 12
23. Ito, F.; Sono, Y.; Ito, T. Measurement and Clinical Significance of Lipid Peroxidation as a Biomarker of Oxidative Stress: Oxidative
Stress in Diabetes, Atherosclerosis, and Chronic Inflammation. Antioxidants 2019, 8, 72. [CrossRef]
24. Ho, E.; Galougahi, K.K.; Liu, C.C.; Bhindi, R.; Figtree, G.A. Biological markers of oxidative stress: Applications to cardiovascular
research and practice. Redox Biol. 2013, 1, 483–491. [CrossRef]
25. Gentile, F.; Arcaro, A.; Pizzimenti, S.; Daga, M.; Cetrangolo, G.P.; Dianzani, C.; Lepore, A.; Graf, M.; Ames, P.R.J.; Barrera, G. DNA
damage by lipid peroxidation products: Implications in cancer, inflammation and autoimmunity. AIMS Genet. 2017, 4, 103–137.
[CrossRef]
26. Forman, H.J. Redox signaling: An evolution from free radicals to aging. Free Radic. Biol. Med. 2016, 97, 398–407. [CrossRef]
27. Fritz, K.S.; Petersen, D.R. An overview of the chemistry and biology of reactive aldehydes. Free Radic. Biol. Med. 2013, 59, 85–91.
[CrossRef]
28. Tsikas, D. Assessment of lipid peroxidation by measuring malondialdehyde (MDA) and relatives in biological samples: Analytical
and biological challenges. Anal. Biochem. 2017, 524, 13–30. [CrossRef]
29. Ma, Y.; Zhang, L.; Rong, S.; Qu, H.; Zhang, Y.; Chang, D.; Pan, H.; Wang, W. Relation between gastric cancer and protein oxidation,
DNA damage, and lipid peroxidation. Oxid. Med. Cell. Longev. 2013, 2013, 543760. [CrossRef]
30. Ayala, A.; Muñoz, M.F.; Argüelles, S. Lipid peroxidation: Production, metabolism, and signaling mechanisms of malondialdehyde
and 4-hydroxy-2-nonenal. Oxid. Med. Cell. Longev. 2014, 2014, 360438. [CrossRef]
31. Naito, Y.; Yoshikawa, T.; Ando, T.; Kishi, A.; Ueda, S.; Oyamada, H.; Kondo, M. Changes in superoxide dismutase activity in the
gastric mucosa of peptic ulcer patients. J. Clin. Gastroenterol. 1992, 14, S131–S134. [CrossRef]
32. Janssen, A.M.; Bosman, C.B.; van Duijn, W.; Oostendorp-van de Ruit, M.M.; Kubben, F.J.; Griffioen, G.; Lamers, C.B.; van Krieken,
J.H.; van de Velde, C.J.; Verspaget, H.W. Superoxide dismutases in gastric and esophageal cancer and the prognostic impact in
gastric cancer. Clin. Cancer Res. 2000, 6, 3183–3192. Available online: https://pubmed.ncbi.nlm.nih.gov/10955802 (accessed on
5 May 2022).
33. Zalewska-Ziob, M.; Adamek, B.; Kasperczyk, J.; Romuk, E.; Hudziec, E.; Chwalińska, E.; Dobija-Kubica, K.; Rogoziński, P.;
Bruliński, K. Activity of Antioxidant Enzymes in the Tumor and Adjacent Noncancerous Tissues of Non-Small-Cell Lung Cancer.
Oxid. Med. Cell. Longev. 2019, 2019, 2901840. [CrossRef]
34. Islam, M.O.; Bacchetti, T.; Ferretti, G. Alterations of Antioxidant Enzymes and Biomarkers of Nitro-oxidative Stress in Tissues of
Bladder Cancer. Oxid. Med. Cell. Longev. 2019, 2019, 2730896. [CrossRef]
35. Ramadan, A.; Hemida, R.; Nowara, A.; Eissa, L.A.; El-Gayar, A.M. Role of oxidative stress in epithelial ovarian cancer in
Egyptian patients. J. Exp. Ther. Oncol. 2017, 12, 9–15. Available online: https://pubmed.ncbi.nlm.nih.gov/28472559 (accessed on
5 May 2022).
36. Zińczuk, J.; Maciejczyk, M.; Zar˛eba, K.; Pryczynicz, A.; Dymicka-Piekarska, V.; Kamińska, J.; Koper-Lenkiewicz, O.; Matowicka-
Karna, J.; K˛edra, B.; Zalewska, A.; et al. Pro-Oxidant Enzymes, Redox Balance and Oxidative Damage to Proteins, Lipids and
DNA in Colorectal Cancer Tissue. is Oxidative Stress Dependent on Tumour Budding and Inflammatory Infiltration? Cancers
2020, 12, 1636. [CrossRef]
37. Zińczuk, J.; Maciejczyk, M.; Zar˛eba, K.; Romaniuk, W.; Markowski, A.; K˛edra, B.; Zalewska, A.; Pryczynicz, A.; Matowicka-
Karna, J.; Guzińska-Ustymowicz, K. Antioxidant Barrier, Redox Status, and Oxidative Damage to Biomolecules in Patients with
Colorectal Cancer. Can Malondialdehyde and Catalase Be Markers of Colorectal Cancer Advancement? Biomolecules 2019, 9, 637.
[CrossRef]
38. Schrader, M.; Fahimi, H.D. Peroxisomes and oxidative stress. Biochim. Biophys. Acta 2006, 1763, 1755–1766. [CrossRef]
39. Mori, M.; Suzuki, H.; Suzuki, M.; Kai, A.; Miura, S.; Ishii, H. Catalase and superoxide dismutase secreted from Helicobacter
pylori. Helicobacter 1997, 2, 100–105. [CrossRef]
40. Monari, M.; Foschi, J.; Calabrese, C.; Liguori, G.; Di Febo, G.; Rizzello, F.; Gionchetti, P.; Trinchero, A.; Serrazanetti, G.P.
Implications of antioxidant enzymes in human gastric neoplasms. Int. J. Mol. Med. 2009, 24, 693–700. [CrossRef]
41. Chu, F.F.; Esworthy, R.S.; Doroshow, J.H. Role of Se-dependent glutathione peroxidases in gastrointestinal inflammation and
cancer. Free Radic. Biol. Med. 2004, 36, 1481–1495. [CrossRef]
42. Bhattacharyya, A.; Chattopadhyay, R.; Mitra, S.; Crowe, S.E. Oxidative stress: An essential factor in the pathogenesis of
gastrointestinal mucosal diseases. Physiol. Rev. 2014, 94, 329–354. [CrossRef]
43. Udomsinprasert, R.; Pongjaroenkit, S.; Wongsantichon, J.; Oakley, A.J.; Prapanthadara, L.A.; Wilce, M.C.; Ketterman, A.J.
Identification, characterization and structure of a new Delta class glutathione transferase isoenzyme. Biochem. J. 2005, 388,
763–771. [CrossRef]
44. Backert, S.; Neddermann, M.; Maubach, G.; Naumann, M. Pathogenesis of Helicobacter pylori infection. Helicobacter 2016, 21,
19–25. [CrossRef]
45. Varbanova, M.; Frauenschläger, K.; Malfertheiner, P. Chronic gastritis—An update. Best. Pract. Res. Clin. Gastroenterol. 2014, 28,
1031–1042. [CrossRef]
46. Posselt, G.; Backert, S.; Wessler, S. The functional interplay of Helicobacter pylori factors with gastric epithelial cells induces a
multi-step process in pathogenesis. Cell Commun. Signal. 2013, 11, 77. [CrossRef]
47. Deep, A.; Verma, K.; Swaroop, S.; Kumar, A.; Rungta, S. Novel coronavirus (COVID-19) and its potential G.I. manifestation: A
review. J. Fam. Med. Prim. Care 2020, 9, 5474–5479. [CrossRef]Diagnostics 2022, 12, 1203 12 of 12
48. Chaturvedi, R.; Cheng, Y.; Asim, M.; Bussière, F.I.; Xu, H.; Gobert, A.P.; Hacker, A.; Casero, R.A., Jr.; Wilson, K.T. Induction of
polyamine oxidase 1 by Helicobacter pylori causes macrophage apoptosis by hydrogen peroxide release and mitochondrial
membrane depolarization. J. Biol. Chem. 2004, 279, 40161–40173. [CrossRef]
49. Augusto, A.C.; Miguel, F.; Mendonça, S.; Pedrazzoli, J., Jr.; Gurgueira, S.A. Oxidative stress expression status associated to
Helicobacter pylori virulence in gastric diseases. Clin. Biochem. 2007, 40, 615–622. [CrossRef]
50. Eruslanov, E.; Kusmartsev, S. Identification of ROS using oxidized DCFDA and flow-cytometry. Methods Mol. Biol. 2010, 594,
57–72. [CrossRef]
51. Kim, J.M.; Kim, J.S.; Lee, J.Y.; Kim, Y.J.; Youn, H.J.; Kim, I.Y.; Chee, Y.J.; Oh, Y.K.; Kim, N.; Jung, H.C.; et al. Vacuolating
cytotoxin in Helicobacter pylori water-soluble proteins upregulates chemokine expression in human eosinophils via Ca2+ influx,
mitochondrial reactive oxygen intermediates, and NF-kappaB activation. Infect. Immun. 2007, 75, 3373–3381. [CrossRef]
52. Willhite, D.C.; Blanke, S.R. Helicobacter pylori vacuolating cytotoxin enters cells, localizes to the mitochondria, and induces
mitochondrial membrane permeability changes correlated to toxin channel activity. Cell. Microbiol. 2004, 6, 143–154. [CrossRef]
53. Raju, D.; Hussey, S.; Ang, M.; Terebiznik, M.R.; Sibony, M.; Galindo-Mata, E.; Gupta, V.; Blanke, S.R.; Delgado, A.; Romero-Gallo,
J.; et al. Vacuolating cytotoxin and variants in Atg16L1 that disrupt autophagy promote Helicobacter pylori infection in humans.
Gastroenterology 2012, 142, 1160–1171. [CrossRef]
54. Tsugawa, H.; Suzuki, H.; Saya, H.; Hatakeyama, M.; Hirayama, T.; Hirata, K.; Nagano, O.; Matsuzaki, J.; Hibi, T. Reactive oxygen
species-induced autophagic degradation of Helicobacter pylori CagA is specifically suppressed in cancer stem-like cells. Cell Host
Microbe 2012, 12, 764–777. [CrossRef]
55. Li, M.; Zhang, Y.; Feurino, L.W.; Wang, H.; Fisher, W.E.; Brunicardi, F.C.; Chen, C.; Yao, Q. Interleukin-8 increases vascular
endothelial growth factor and neuropilin expression and stimulates ERK activation in human pancreatic cancer. Cancer Sci. 2008,
99, 733–737. [CrossRef]
56. Eftang, L.L.; Esbensen, Y.; Tannæs, T.M.; Bukholm, I.R.; Bukholm, G. Interleukin-8 is the single most up-regulated gene in whole
genome profiling of H. pylori exposed gastric epithelial cells. BMC Microbiol. 2012, 12, 9. [CrossRef]
57. Asfaha, S.; Dubeykovskiy, A.N.; Tomita, H.; Yang, X.; Stokes, S.; Shibata, W.; Friedman, R.A.; Ariyama, H.; Dubeykovskaya, Z.A.;
Muthupalani, S.; et al. Mice that express human interleukin-8 have increased mobilization of immature myeloid cells, which
exacerbates inflammation and accelerates colon carcinogenesis. Gastroenterology 2013, 144, 155–166. [CrossRef]
58. Uberti, A.F.; Olivera-Severo, D.; Wassermann, G.E.; Scopel-Guerra, A.; Moraes, J.A.; Barcellos-de-Souza, P.; Barja-Fidalgo, C.;
Carlini, C.R. Pro-inflammatory properties and neutrophil activation by Helicobacter pylori urease. Toxicon 2013, 69, 240–249.
[CrossRef]
59. Wilson, K.T.; Crabtree, J.E. Immunology of Helicobacter pylori: Insights into the failure of the immune response and perspectives
on vaccine studies. Gastroenterology 2007, 133, 288–308. [CrossRef]
60. Peek, R.M., Jr.; Fiske, C.; Wilson, K.T. Role of innate immunity in Helicobacter pylori-induced gastric malignancy. Physiol. Rev.
2010, 90, 831–858. [CrossRef]
61. Wang, G.; Hong, Y.; Olczak, A.; Maier, S.E.; Maier, R.J. Dual Roles of Helicobacter pylori NapA in inducing and combating
oxidative stress. Infect. Immun. 2006, 74, 6839–6846. [CrossRef]
62. Zhao, Y.; Cai, Y.; Chen, Z.; Li, H.; Xu, Z.; Li, W.; Jia, J.; Sun, Y. SpoT-mediated NapA upregulation promotes oxidative stress-
induced Helicobacter pylori biofilm formation and confers multidrug resistance. Antimicrob. Agents Chemother. 2021, 65, e00152-21.
[CrossRef]You can also read