E-commerce Business-to-Business (e-B2B) Distribution Strategy and Network Design for Nanostores
←
→
Page content transcription
If your browser does not render page correctly, please read the page content below
E-commerce Business-to-Business (e-B2B) Distribution Strategy and Network
 Design for Nanostores
 by
 Austin Iglesias Saragih
 B.S. Industrial Engineering, Purdue University (2014)
 and
 Syed Tanveer Ahmed
 B.Tech. Electrical Engineering, Indian Institute of Technology Bhubaneswar (2015)

 SUBMITTED TO THE PROGRAM IN SUPPLY CHAIN MANAGEMENT
 IN PARTIAL FULFILLMENT OF THE REQUIREMENTS FOR THE DEGREE OF
 MASTER OF APPLIED SCIENCE IN SUPPLY CHAIN MANAGEMENT
 AT THE
 MASSACHUSETTS INSTITUTE OF TECHNOLOGY

 June 2021
 © 2021 Saragih and Ahmed. All rights reserved.
 The authors hereby grant to MIT permission to reproduce and to distribute publicly paper and
 electronic
 copies of this capstone document in whole or in part in any medium now known or hereafter
 created.

 Signature of Author: ____________________________________________________________________
 Department of Supply Chain Management
 May 14, 2021

 Signature of Author: ____________________________________________________________________
 Department of Supply Chain Management
 May 14, 2021
 Certified by: __________________________________________________________________________
 Dr. Christopher Mejía Argueta
 Research Scientist, Center for Transportation and Logistics
 Director, Food and Retail Operations Lab
 Capstone Advisor
 Accepted by: __________________________________________________________________________
 Prof. Yossi Sheffi
 Director, Center for Transportation and Logistics
 Elisha Gray II Professor of Engineering Systems
 Professor, Civil and Environmental Engineering
E-commerce Business-to-Business (e-B2B) Distribution Strategy and Network Design for
 Nanostores
 Austin Iglesias Saragih
 and
 Syed Tanveer Ahmed
 Submitted to the Program in Supply Chain Management
 on May 14, 2021 in Partial Fulfillment of the
 Requirements for the Degree of Master of Applied Science in Supply Chain Management

ABSTRACT
With 50 million nanostores globally, nanoretailing is the most important retail channel in developing
countries. In India, these stores are called kiranas, and they are the backbone of India's retail market.
Unfortunately, the distribution to this massive retail segment is fragmented. Current fragmented
channels of exclusive distributors, wholesalers, and stockists are costing kiranas more than 50% of
their potential margins and impacting their business viability. A non-exclusive e-commerce business-
to-business (e-B2B) distribution strategy can serve as a promising solution to reduce fragmentation,
cost-to-serve, and increase potential margins in the industry. This research formulated a non-
exclusive e-B2B distribution strategy at the lowest cost-to-serve and identified the essential urban
network design factors for e-commerce platforms to consider. We extended the Two-Echelon
Capacitated Location-Routing Problem (2E-CLRP) with the augmented route-cost estimation to
consider wallet share, market penetration, frequency, drop size, and urban circuity factors. We also
computed the Road Network Circuity Factor (RCF) values of several Indian cities. Our results indicate
that, through e-B2B distribution, companies can achieve most of their cost savings and profitability
when they reach certain threshold of wallet share and market penetration. Furthermore,
geographical circuity constraints and increasing frequency of deliveries do not significantly increase
logistics costs. In summary, we recommend that companies reach their threshold of wallet share and
penetration to reduce costs optimally. Key initiatives to reach this target include sharing cost savings
back to the nanostores, develop free shipping options and loyalty programs, increasing delivery
frequency, and expanding to new service regions. Moreover, companies should not be afraid to
increase their delivery frequency or open service in promising regions as these factors only slightly
increase cost to serve. Although this project focuses on India, our findings are also applicable to other
developing countries. A non-exclusive e-B2B distributor improves adaptability and affordability of
nanostore supply chain operations and provides ample opportunities to for further research.

Capstone Advisor: Dr. Christopher Mejía Argueta
Title: Research Scientist, Center for Transportation and Logistics

 2
ACKNOWLEDGMENTS
We are immensely grateful to our advisor Dr. Christopher Mejía Argueta, for his mentorship and
support as our advisor and incredible expertise in nanostores and retail supply chain. Thank you for
guiding us, teaching us to be great supply chain researchers, and for being approachable and amiable.
We truly appreciate him and look forward to continue having him as our mentor professionally and
personally.
Austin Iglesias Saragih, specifically would like to thank his parents: Roselyn Maria Sinaga and Freddy
Rikson Saragih. Thank you for your supporting me to achieve this dream. Without their dedication
and prayers, he would not be here today. This dream, which has been 21 years in the making, has
finally come true. He would also like to thank my sisters: Stephani Putri Fajar, Patricia Utami Saragih,
and Angelyn Olivia Karlina Saragih. Ad Majorem Dei Gloriam (AMDG).
Syed Tanveer Ahmed would like to thank God, the Almighty for his blessings throughout his journey
and my family for their love and support. My mom, Sheereen Banu and dad, Syed Fiaz Ahmed have
been pillars of support throughout my life and their sacrifices and constant motivation has led him
to where he is today. He would like to thank his sister, Tasneem and brother-in-law, Mohammed
Muzaffar for their support. Finally, his young nephews, Muhammed Uzair and Muhammed Umar for
their sweet innocent love and keeping him in good spirits throughout his Micro Masters and MIT
journey in these challenging times.
We would also like to thank our sponsoring company and its advisor for providing us with high-
quality and granular data and guiding us on our project. We would like to thank Dr. Daniel Merchán
and Dr. Matthias Winkenbach for providing access to their research and giving a few ideas in the
preliminary stage of this capstone project.
Finally, we would like to thank the SCM program and CTL team for their hard work and dedication to
all members of the SCM class of 2021. This has been a wonderful experience for us.

Austin Iglesias Saragih and Syed Tanveer Ahmed

 3
TABLE OF CONTENTS
LIST OF FIGURES ..................................................................................................................................................................... 5
LIST OF TABLES ....................................................................................................................................................................... 6
1 INTRODUCTION.............................................................................................................................................................. 7
 1.1 Background............................................................................................................................................................. 7
 1.2 Motivation ............................................................................................................................................................... 7
 1.3 Research Problem ................................................................................................................................................ 8
 1.4 Methodology........................................................................................................................................................... 9
 1.5 Summary .................................................................................................................................................................. 9
2 LITERATURE REVIEW ............................................................................................................................................... 10
 2.1 Megacities and Kiranas .................................................................................................................................... 10
 2.2 Kirana Distribution Strategy ......................................................................................................................... 12
 2.3 Urban Distribution Network Models.......................................................................................................... 14
 2.4 KPIs and Tradeoffs for Supply Chain Network Design ....................................................................... 17
 2.5 Gaps and Contributions ................................................................................................................................... 19
3 DATA AND METHODOLOGY .................................................................................................................................... 20
 3.1 Business Overview............................................................................................................................................. 20
 3.2 Distribution Strategy Key Performance Indicators (KPIs) and Tradeoffs ................................. 21
 3.3 Data Overview ..................................................................................................................................................... 23
 3.4 Network Model.................................................................................................................................................... 24
 3.5 Urban Morphology Impact – Road Network Circuity Factor (RCF) Calculation ...................... 29
4 RESULTS AND ANALYSIS.......................................................................................................................................... 30
 4.1 Company Overview ........................................................................................................................................... 30
 4.2 Urban Morphology and Road Network Circuity Factors Results ................................................... 31
 4.3 Model Implementation and Results............................................................................................................ 32
 4.4 Sensitivity Analysis of Wallet Share, Frequency, and Penetration ................................................ 35
 4.5 Sensitivity Analysis of Urban Morphologies ........................................................................................... 38
5 DISCUSSION.................................................................................................................................................................... 39
 5.1 Tradeoffs ................................................................................................................................................................ 39
 5.2 Insights and Practical Implications............................................................................................................. 39
 5.3 Management Recommendations ................................................................................................................. 40
6 CONCLUSION ................................................................................................................................................................. 42
REFERENCES ........................................................................................................................................................................... 43
APPENDIX ................................................................................................................................................................................. 46

 4
LIST OF FIGURES

Figure 1.1 Scope of e-B2B Distribution Strategy and Network Design ............................................................. 8
Figure 2.1. Literature Review Structure ...................................................................................................................... 10
Figure 2.2. Typical Kirana Stores in India ................................................................................................................... 11
Figure 2.3. Strategies to Supply Kiranas ...................................................................................................................... 13
Figure 2.4. Business to Business (B2B) Retail Value Chain in India ................................................................ 13
Figure 2.5. e-B2B Channel for distribution ................................................................................................................. 14
Figure 2.6. Four Network Delivery Structures .......................................................................................................... 15
Figure 2.7. Distribution Network Design Framework ........................................................................................... 16
Figure 2.8. 2E-CLRP Network Model ............................................................................................................................. 16
Figure 2.9. Relationship Between Frequency and Drop Size............................................................................... 18
Figure 3.1. The end-to-end supply chain of e-B2B distributor for kiranas ................................................... 20
Figure 3.2. Operations Clock of Kirana Distribution ............................................................................................... 21
Figure 3.3. Kirana Market Segments and the Company's Target Market ....................................................... 21
Figure 3.4. Cost to Serve Waterfall ................................................................................................................................. 22
Figure 3.5. Schematic Illustration of Cross-dock Networks, Serving Specific Urban City Segments .. 25
Figure 4.1. Wallet Share, Drop Size, Drop Frequency, and Penetration July 2020-June 2025 .............. 30
Figure 4.2. Road Network Circuity Factor (RCF) of City Scenarios................................................................... 32
Figure 4.3. Urban Morphologies Map Illustration.................................................................................................... 32
Figure 4.4. All Kiranas and Their Demand Volumes are Aggregated into City Segments ....................... 33
Figure 4.5. City segments, Cross-docks, and a Network Design Model to Minimize Costs ..................... 33
Figure 4.6. Cost-to-serve Percentage Over Time Horizon .................................................................................... 34
Figure 4.7. Sensitivity Analysis of Cost-to-serve percentage over Wallet Share percentage ................. 35
Figure 4.8. Sensitivity Analysis of Cost-to-serve percentage over Monthly Delivery Frequency ........ 36
Figure 4.9. Sensitivity Analysis of Cost-to-serve Percentage Over Penetration Percentage .................. 37
Figure 4.10. Sensitivity Analysis of Cost-to-serve Percentage Over Road Network Circuity Factor .. 38
Figure 5.1. Effort-Impact Matrix of Initiatives ........................................................................................................... 41

 5
LIST OF TABLES

Table 3.1. City Segment Summary .................................................................................................................................. 24
Table 3.2. Cost Component and Capacity Summary for Cross-dock Facilities and Vehicles .................. 24
Table 3.3. Objective Function Components ................................................................................................................ 25
Table 3.4. General Model Parameters ........................................................................................................................... 26
Table 3.5. First-echelon Parameters and Endogenous Variables ...................................................................... 26
Table 3.6. Second-echelon (2E) Parameters and Endogenous Variables ...................................................... 26
Table 3.7. Physical Capacity Parameters ..................................................................................................................... 27
Table 3.8. Drop Size, Wallet Share, Frequency and Penetration Parameters ............................................... 27
Table 4.1. Urban Morphology Settings ......................................................................................................................... 31
Table 4.2. Summary of Cost-to-Serve Over Key Variables in NCR..................................................................... 34
Table 4.3. Cost-to-Serve % Over Road Network Circuity Factors of Different Cities/Regions ............. 38
Table 5.1.Distribution Strategy Action Framework with Expected Savings and Priority ....................... 40
Table Appendix 1.1. Cost-to-Serve over Frequency, Wallet Share, Penetration, & Drop Size in NCR 46

 6
1 INTRODUCTION
1.1 Background
Today, almost 90% of India's consumer packaged goods (CPG) manufacturers operate in fragmented
channels. These channels consist of approximately a million individual distributors and wholesalers
whose goods reach the kirana stores, serving millions of Indian consumers (Bhise, 2019). A kirana is
a small, family-owned retail store. It is usually referred to as a nanostore, mom-and-pop store, or the
traditional channel (Fransoo et al., 2017). This substantial retail market is facilitated through a long
business-to-business (B2B) retail supply chain between the CPG manufacturers and the end
consumers through multiple intermediaries (Kumar, 2019).
In India, at least 14 million kiranas exist and operate every day, and their characteristics and issues
are very distinctive. Their small size makes distribution a logistics challenge. Other challenges
include small distribution drop sizes, limited available cash, and minimal shelf space - especially in
urban areas. Furthermore, Kin (2018) argued that kirana supply chain networks are highly
fragmented due to different goals between manufacturers and kirana owners, which increases the
cost to serve of this channel. An independent, online, and multi-brand distributor would fill the gap
to address this issue and help to gain further efficiency in the fiercely competitive retail landscape
and last-mile delivery environment.
India is a high-tech market with several companies leading business-to-consumer (B2C) e-commerce
platforms. However, only a few have entered the CPG wholesale business to disrupt the decades-old
exclusive distributor-led traditional fulfillment channels and improve the B2B retail value chain for
brands and consumers. These e-commerce companies would directly serve the kiranas better,
provided that it has a robust distribution strategy and comprehensive supply chain network model.
This research aims to formulate a non-exclusive e-commerce B2B (e-B2B) distribution strategy at
the lowest cost-to-serve, at the highest service levels, and identify essential urban network design
factors. Using geolocations of each kirana and the projected 5-year demand, delivery frequencies,
projected market penetration1, and wallet share2, this study provides a comprehensive urban
network supply chain strategy that entails the value proposition and the network model for e-
commerce B2B distribution.

1.2 Motivation
Globally, billions of consumers buy their staples from up to 50 million nanostores worldwide. In
developed countries, modern channel retailers are very dominant due to the larger purchasing power
of the customers and the ability to provide cheaper products due to logistics efficiencies reach via
door-to-door distribution strategies. However, the opposite is true in most developing countries. The
traditional channels retailers can serve lower-income consumers through closer proximity, credit
line offers, and the format of the kirana (Fransoo et al., 2017).
Kiranas are not only the backbone of India's everyday CPGs but also dairy products, fruits, and
vegetables, including rice and pulses. The Indian Retail Industry Analysis by IBEF (Kamath, 2020)
calculated that they comprise 80% of India's $ 1.1 trillion retail market. Typically, a kirana serves the
needs of approximately 500 families in the neighborhood. With an average space of 300 ft2 and

1 Percentage of stores (i.e., kiranas) subscribing to the e-B2B service provided by the e-commerce platform
2 Percentage of goods in the store (i.e., kirana) distributed by the e-commerce platform

 7
US$3,000 in inventory at any given time, a kirana offers roughly 2,500 SKUs, which vary in response
to the socioeconomic composition of the neighborhood's and customers' preferences.
The most challenging problem of kiranas has been the considerably high cost to serve, which
adversely affects their survival (Castañon-Choque, 2018). Limited capital, space, and technology
prevent them from adequately stocking to fulfill demands, which leads to overstocking without a
clear business strategy and less product availability. Moreover, most of the CPG manufacturers do
not offer frequent visits to deliver their goods directly. As a result, store owners have no choice but
to close their stores every few days to visit the closest wholesale market to buy their consumer's
demands (Kamath, 2020). This condition results in loss of business, time, and money.
Moreover, kiranas' high fragmentation causes substantial distribution inefficiencies, especially in
congested megacities. A solution is required to serve them efficiently, given the unique features of
their commercial channels and logistics strategies, technological challenges, and others (Sponsor
Company, 2020). However, tackling the logistics complexities of serving millions of kirana stores is a
challenge that many face, yet few master. (Fransoo et al., 2017).
These two challenges emerged in designing a non-exclusive e-B2B distribution solution for these
kiranas. Therefore, this capstone project addresses the challenges by cutting the fragments of
distributors, reducing the cost to serve, and serving rapid replenishment to the kiranas. Kirana
owners can benefit from the faster service to provide a better experience to their consumers. They
can also benefit from a cheaper cost-to-serve to increase their wallet share. Brands can also increase
their gross merchandise volume (GMV), and consequently, their margins. Finally, entering the B2B
business will boost growth and foster forward-looking logistics approaches to serve kiranas.

1.3 Research Problem
Our research questions are the following:
 • What should be the e-B2B distribution strategy (see Figure 1.1) to serve kiranas at
 optimal cost subject to service levels?
 • What factors of urban network design should be considered to implement the
 distribution strategy at different stages?
Figure 1.1 Scope of e-B2B Distribution Strategy and Network Design
Scope of e-B2B Distribution Strategy and Network Design

To answer the first question, we develop a recommendation framework for e-commerce platforms.
This framework becomes a guiding principle for companies to design their distribution from brand
manufacturers to the kiranas. On distribution strategy, Spoor (2016) and Kin (2018) offer a variety

 8
of options: direct delivery to kiranas, delivery through cross-dock points or and urban consolidation
centers (UCC), or a combination of both.
To answer the second question, a large-scale network design solution is developed to highlight the
tradeoffs between penetration, wallet share, frequency, and urban circuity characteristics in
achieving the objective for the platform. Sensitivity analysis of the network model is provided.
Finally, we describe the key factors to be considered at different stages.

1.4 Methodology
Given a geographical region of kirana stores (i.e., demand points), whose aggregate demand
distribution is known daily, a distribution network design model was built for the kirana stores via
an e-commerce platform's distribution centers and cross-dock points. We use the following
procedure to address the aforementioned research questions:
 1. Cluster and segment the kiranas based on their characteristics.
 2. Identify the drivers of logistics cost-to-serve, e.g., the frequency of kirana's orders, wallet
 share of kirana's orders fulfilled by the platform, the number of kiranas onboarded, the
 capacity of kiranas, types of vehicle, and so on.
 3. Calculate road circuity values.
 4. Compute the cost-to-serve objective function of the network.
 5. Define the constraints and identify the tradeoffs in the optimization function.
 6. Optimize the objective function subject to constraints with the continuous
 approximation method using Gurobi Software.
 7. Perform sensitivity analyses over different urban geography settings of the optimization
 function with respect to parameters to discuss key observations.
 8. Formulate short- and long-term recommendations and effort-impact matrix guidelines
 based on the network model results and the network's most critical parameters.

1.5 Summary
Kiranas are an integral part of the retail atmosphere. Unfortunately, current fragmented traditional
distribution channels are costing the kiranas' their potential margins. Therefore, a non-exclusive e-
B2B distribution strategy becomes a promising solution, and with an appropriate network design
model, the strategy can generate a lower cost structure. To achieve this, we formulate a two-echelon
location-routing problem (2E-CLRP) suitable for the large-scale distribution network design to
minimize cost-to-serve to kiranas. Network model results show that companies should focus their
resources on attaining the threshold of wallet share and penetration (see Chapter 4 and 5). In this
project, the threshold for wallet share and penetration is 10%. Moreover, opening new areas or
improving services should not deter companies as increasing frequency and network circuity do not
substantially increase costs. The next chapter will review the works of literature pertinent to the
project.

 9
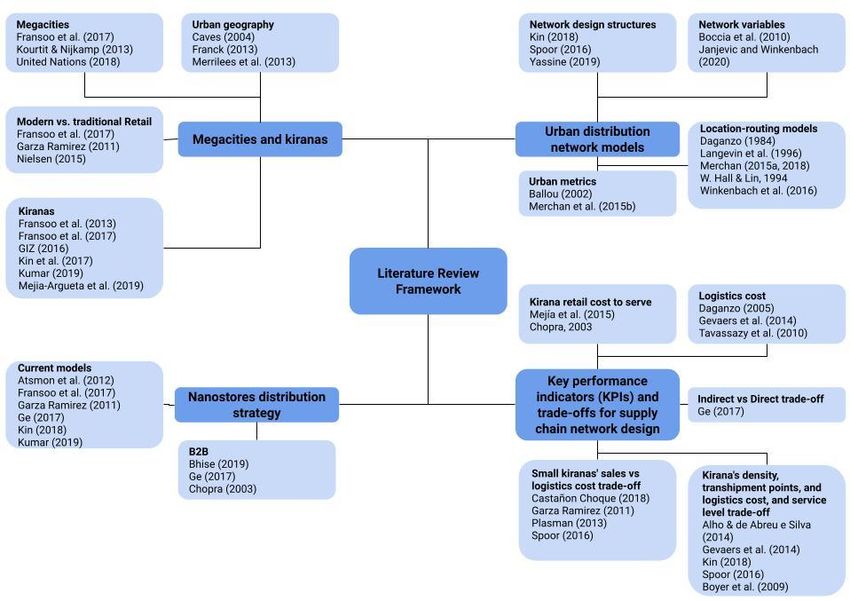
2 LITERATURE REVIEW
This chapter surveys the literature on kiranas, distribution strategies to serve them, current
distribution network models, and key performance indicators (KPIs) to measure their performance
(see Figure 2.1). The literature review is conducted to identify relevant works to our research goal:
to build Business-to-Business (B2B) distribution strategies to serve kiranas at optimal cost and
service levels; and urban distribution network models in addition to that. First, we discuss the
current and future status of megacities and kiranas. Next, we review the existing distribution
strategies, urban supply chain network models, KPIs, cost-to-serve approaches, and tradeoffs. The
gaps in the literature and the specific contributions from our research are then presented.
Figure 2.1. Literature Review Structure
Literature Review Structure

2.1 Megacities and Kiranas
A megacity is a vast city, typically with a population of more than 10 million inhabitants. It is expected
that the number of megacities will continue to grow, from 33 to 43 by 2030 (United Nations, 2018).
The World Cities report from the United Nations finds that big cities "create wealth, generate
employment and drive human progress" for entire nations. India is expected to have seven
megacities by 2030 and remain the second most populated country globally.
The rise of megacities is due to three significant factors: 1) Demographic transition, due to both
population increase and smaller household sizes; 2) Rural-urban migration as the economy depends

 10
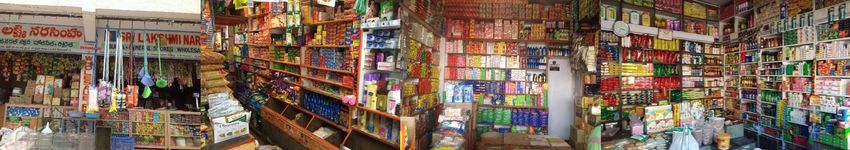
less on agriculture and more on services; and 3) Geographic spread of urban areas by increasing the
urban sprawl (Kourtit & Nijkamp, 2013). This increase will be most dramatic on the least-urbanized
continents: Asia, Africa, Latin America, and the Caribbean. Surveys and projections indicate that
developing countries will mainly drive all urban growth over the next 25 years. The emerging market
economies in these developing countries will be characterized by high economic growth, the
emergence of a sizeable middle class with different consumption patterns, and urbanization
(Fransoo et al., 2017).
One can use urban morphology to classify urban regions which entail different logistical challenges.
The 'core city' is the largest or most important city of a metropolitan area and is surrounded by
smaller satellite cities, towns, and suburbs (Caves, 2004). 'Satellite cities' are smaller municipalities
adjacent to a major city which is the core of a metropolitan area (Merrilees et al., 2013). A
'metropolitan area' or metro is a region consisting of a densely populated urban core and its less-
populated surrounding territories. A 'conurbation' is a region comprising several metropolises, cities,
large towns, and other urban areas that have merged to form one continuous urban or industrially
developed area (Caves, 2004). 'Twin cities' are a particular case of two cities or urban centers
founded in close geographic proximity (Franck, 2013).
Retailing in megacities depends on the presence of many retail outlets to serve the increasing
populations. Retail outlets that sell consumer packaged goods (CPG) are diverse but broadly can be
classified into two types. One type is stores belonging to the modern retail chains (e.g., Walmart,
Carrefour). Modern retail stores include hypermarkets, supermarkets (of varying sizes), and smaller
convenience stores or mini-markets (e.g., 7-Eleven), and these are owned by large companies (Garza
Ramirez, 2011; Fransoo et al., 2017). The other type is traditional retail, which comprises
independent retailers. Traditional store formats can include mom-and-pop stores, kiosks, street
vendors, and open markets, but the unique feature is the sole proprietorship. They are neither part
of a larger company nor a franchise. These stores are known by different names in academia,
including 'traditional channels', 'unorganized', 'mom & pop stores', 'neighborhood markets',
'nanostores' or 'high-frequency stores'. These stores have different local names in different
countries: kirana (India), hanout (Morocco), changarro (Mexico), tienda de barrio (Colombia),
bodega (Peru and United States), warung or toko (Indonesia), and sari-sari (Southeast Asia)
(Nielsen, 2015; Fransoo et al., 2017).
Since the context of this research is India, the local term 'kirana' is used. Kiranas (depicted in Figure
2.2) are defined as independently owned retail stores that are generally small in size (< 20m2). They
mainly operate with cash, have a small width of the product assortment, mostly lack a storage room,
have a low degree of technological penetration in order placement, and have no logistics support
with limited optimization possibilities (Fransoo et al., 2013). Kiranas form the backbone of the Indian
economy, being an essential part of the country's retail industry.
Figure 2.2. Typical Kirana Stores in India
Typical Kirana Stores in India

 11
Modern retail typically expands as countries become urbanized, gross domestic product (GDP) rises,
and trade liberalizes. However, various factors account for the continued presence of kiranas in
emerging market economies (Kin et al., 2017; Mejia-Argueta et al., 2019). The first one is high
population density, i.e., lack of sufficient space for modern retail outlets that usually occupy larger
areas. Economic inequality is another factor, as evidenced in the higher presence of kiranas in
economically impoverished areas. The last two are the social role played by kiranas and the presence
of an informal economy. Kirana stores occupy a 90% market share, representing a force of around
14 million kiranas that are the bedrock of India's everyday CPG supply. The Indian consumer retail
market is expected to grow at a compound annual growth rate (CAGR) to reach $1.6 trillion in 2025
from nearly $900 billion in 2019 (Kumar, 2019).
Hence, kiranas remain essential for manufacturers to reach sales in major emerging markets, at least
in the near future. Fransoo et al. (2017) and Mejia-Argueta et al. (2019) predict that kiranas will
continue to flourish, but the form of retailing would change considerably. Some of the changes include
cashless transactions, the use of e-commerce platforms, and the merging of virtual and physical
inventory.
As cities get more extensive and denser, the impact on urban freight transport (UFT) is significant.
Logistics facilities become further located from the urban core areas, where most jobs, residents, and
businesses are present. Also, the high fragmentation of kirana stores causes substantial distribution
inefficiencies, especially in congested megacities. Recent trends indicate that UFT will become more
complex and expensive. In India, an estimated 60% of daily deliveries in urban areas are linked to
independent retail (GIZ, 2016). With most consumption taking place in urban areas, a frequent and
reliable UFT system and a well-coordinated logistics, warehousing strategy are needed.

2.2 Kirana Distribution Strategy
Several decades of rapid economic growth have transformed the purchasing power parity of
emerging market economies. The current retail landscape for the CPG industry in emerging-market
megacities is highly fragmented. Traditional channel is a significant revenue and cash-flow source for
CPG manufacturers. Multinational and local CPG suppliers inevitably and primarily rely on tens of
thousands of kiranas in megacities to access millions of consumers with increasing purchasing power
parity (i.e., middle class). For example, in India, Unilever deploys thousands of salespeople to
distribute directly to more than 1.5 million kiranas (Atsmon et al., 2012).
To compare distribution in traditional and modern retail, modern retailers depend on a supply chain
network of distribution centers (DCs), cross-docks and logistics service providers. Goods are shipped
in comparatively large volumes from manufacturer locations to the retailer's DCs and, subsequently,
to the retail stores in a consolidated way, often using full truckload (FTL). In the case of family-owned
small retail, such optimization possibilities are lacking. Manufacturers have different strategies to
supply the kiranas. Fransoo et al. (2017) distinguished five different supply strategies: Onboard
sales, Pre-sales + direct store delivery, Pre-sales + distributor, Distributor, and Wholesaler to serve
kiranas and identified advantages and disadvantages for each. The small volumes ordered by kiranas
and the lack of storage space cause significant logistical differences. Therefore, the CPG
manufacturers mainly supply kiranas via indirect models such as wholesalers.
The indirect supply, which is the cheapest option, offers a comparatively low degree of control and
visibility because of wholesalers. However, large manufacturers typically exert more control,
visibility over the sales and delivery process by either conducting the processes themselves or

 12
outsourcing to exclusive distributors (see Figure 2.3). A typical distributor led process with
deliveries uses the pre-sales scheme that looks as follows: a salesperson visits a store to get the order;
in case of sales (not every visit leads to sales), goods are (usually) delivered the next day after which
the payment is collected (Garza Ramirez, 2011; Fransoo et al., 2017).
Figure 2.3. Strategies to Supply Kiranas (adapted from Kin, 2018)
Strategies to Supply Kiranas (adapted from Kin, 2018)

A crucial topic is the efficiency of last-mile deliveries. Supply of kiranas concerns large volumes
collectively, but final deliveries are highly fragmented. The characteristics of kiranas (i.e., small size
with limited or no storage room) make shipments small. If a store owner has little cash available,
fewer products can be purchased by that store (Fransoo et al., 2017). Altogether, the exclusive supply
of kiranas is characterized by an inherent lack of bundling with multiple suppliers delivering to a
single store. Bundling products of several manufacturers are essentially what non-exclusive
distributors and wholesalers do. Currently, it seems that CPG manufacturers only stop using
exclusive distributors as modern retail becomes dominant, or if the manufacturers look for
expanding the market in a relatively unknown channel, geography, or if they want to continue
exploiting the expanded market profitably (Ge, 2017).
Figure 2.4. Business to Business (B2B) Retail Value Chain in India (adapted from Kumar, 2019)
Business to Business (B2B) retail value chain in India (adapted from Kumar, 2019)

 13
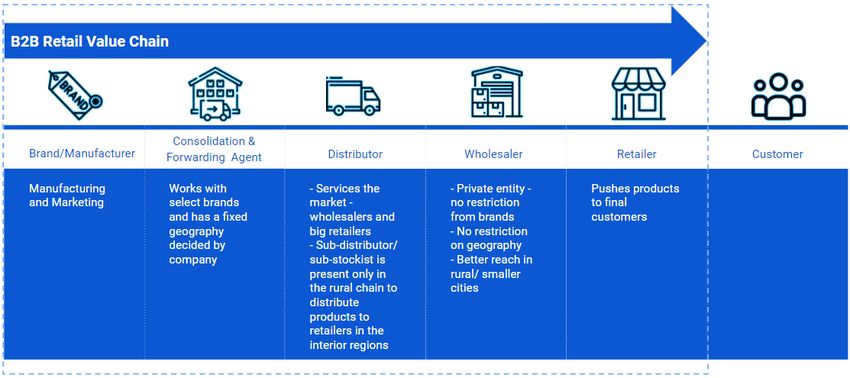
The Indian B2B retail value chain has four to five layers of intermediaries starting from a forwarding
agent, a distributor, a sub-distributor, a wholesaler, and a retailer. Thus, a brand/manufacturer needs
to go through to get to the end consumer (see Figure 2.4). This traditional supply chain system causes
multiple bottlenecks that lead to longer timeliness, losses in CPG manufacturer's efficiency, issues
with quality, and most importantly, reduction in retailer's margin. Traditional distribution's modus
operandi has been to overstock retailers with weekly/fortnightly replenishments (Bhise, 2019).
An e-B2B distributor can fill various nanostore distribution processes (see Figure 2.5): Starting from
handling delivery logistics, warehousing needs, getting the proper inventory from the right set of
manufacturers to taking orders online, and get them fulfilled to the kirana. The other advantages of
e-B2B would be easy demand generation (i.e., kiranas may order through a website or app), credit
options to kirana stores, and doorstep delivery, which will substantially improve the business
prospects for the retailer. Ge (2017) predicts that kiranas have great potential to adapt to new retail
environments in the coming decades, and they may even prosper in future omnichannel operations.
Figure 2.5. for distribution (taken from Kin, 2018)
e-B2B Channel for distribution (taken from Kin, 2018)

Three current e-B2B models are: 1) 'Asset Light - Technology Led' marketplace, which relies on pure
tech-led demand generation and just-in-time inventory; 2) 'Inventory based - Technology Led'
players, who maintain their inventory, but rely on tech-led demand; 3) 'Inventory based - Assisted'
players, who keep the inventory in their warehouses and promote the feet-on-street assisted-
demand generation, i.e., they have their sales force who visit the kiranas for taking orders, in addition
to having an app (Kumar, 2019). All these models are evolving and have yet to prove their viability.
A non-exclusive e-B2B distributor can fit in any of these three models. According to Kumar's (2019)
classification, this research focuses on an inventory-based e-B2B distribution platform.
The next step is to understand the potential urban distribution network models that an e-B2B non-
exclusive distributor can adopt. Distribution is a crucial driver of the overall profitability of a firm
because it directly impacts both the supply chain cost and the customer experience. A high-
performance distribution can be used to achieve various supply chain objectives ranging from low
cost to high responsiveness (Chopra, 2003).

2.3 Urban Distribution Network Models
Frameworks that position supply chain network designs in urban environments are growing in the
world. They are essential for studying the pros and cons of different distribution structures. Spoor

 14
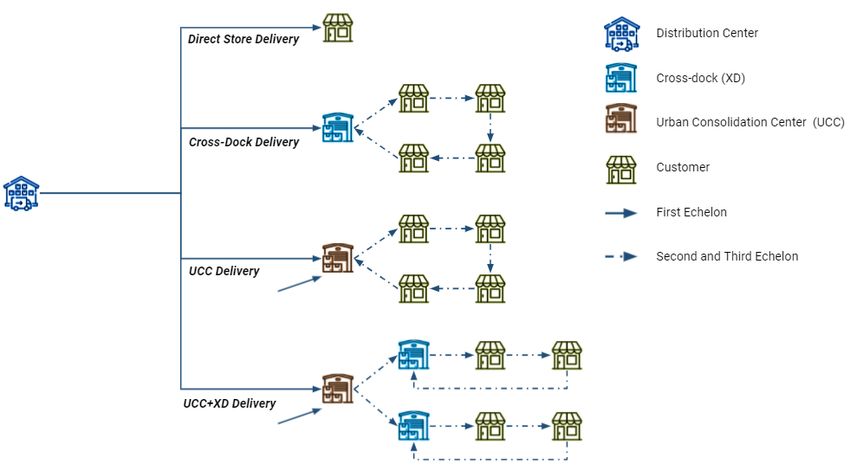
(2016) presents four different last-mile delivery network structures of the supply chain for
distributors to supply kiranas (see Figure 2.6):
 1. Direct Delivery: Typically, dispatched vans to distribute directly to kiranas
 2. Cross-dock Delivery (XD): A large vehicle travels to a cross-docking facility where the parcels
 are unloaded and then sorted into smaller vehicles (e.g., motorbikes, vans)
 3. Urban Consolidation Center (UCC): A cross-docking facility with consolidation from other
 CPG companies' distribution center, typically exist in CPG's distributors, logistics service
 providers (LSPs) or third-party logistics (3PLs).
 4. UCC+XD: A combination of UCC and XD
Figure 2.6. Four Network Delivery Structures
Four Network Delivery Structures (adapted from Spoor, 2016)

Cross-dock delivery (XD), urban consolidation center (UCC), and the combination of them are
considered multi-echelon urban delivery networks because there exist two (or more) tiers or
echelons of transportation. These networks allow for consolidation and increased vehicle utilization.
These facilities are also known as (city) hubs, transshipment points, transfer points, or terminals.
The use of cross-docks and UCCs makes CPG manufacturers incur facility costs and additional
handling costs, but it reduces transport costs due to modal shift to smaller vehicles and reducing the
impact of congestion from logistics sprawl (Kin, 2018; Yassine, 2019). UCC, in essence, is an
additional transshipment point, but rather than being operated by a single company, it provides a
collaborative system for multiple stakeholders (Kin, 2018). However, UCC is also the main barrier as
it necessitates collaboration and data sharing with potential competitors and their suppliers and
customers.

 15
Boccia et al. (2010) argued that urban logistics networks require three levels of decision: strategic,
tactical, and operational. The strategic decisions are long-term related decisions that include
considering the count, types, and location of the supply and transshipment distribution facilities. In
the medium term, the tactical decisions comprise defining the types and number of vehicles required
at each facility. Lastly, in the short term, the optimized vehicle routes are determined for day-to-day
operations. Kirana distribution strategies should lean on long-and-medium term planning to ensure
business sustainability.
To classify relevant network design variables, Janjevic and Winkenbach (2020) denoted three critical
components in a conceptual framework for distribution network design: i) network architecture, ii)
transportation services, and iii) logistics facilities (see Figure 2.7). These components are used to
develop the distribution network design. Available variables at each component will be the baseline
variables for our proposed network model.
Figure 2.7. Distribution network design framework (taken from Janjevic & Winkenbach, 2020)
Distribution Network Design Framework (taken from Janjevic & Winkenbach, 2020)

The most applicable network model for the project is a two-echelon capacitated location-routing
problem (2E-CLRP) by Winkenbach et al. (2016), Merchán (2015a), and Merchán et al. (2018), which
seeks to minimize cost for last-mile delivery networks (see Figure 2.8). The authors present case
studies in two different cities served by a postal service company in France. Sensitivity analysis and
scenarios were performed to show the tradeoffs between various network choices. The study
concluded that service levels and population density directly impact the distribution network design
considerations.
Figure 2.8. 2E-CLRP Network Model
2E-CLRP Network Model

 16
Due to the enormous size of combining two NP-hard problems, the augmented route-cost estimation
(ARCE) formula is introduced to approximate the routing cost component and reduce complexity
while maintaining a high-quality solution. This model will be used as a base formulation to implement
the kirana distribution strategy in our study. However, our approach will focus mainly on the
strategic and tactical location-allocation approach. Merchán (2015a) extended Winkenbach's model
to add cross-dock points and congestion factors; he also tested the model in a case study from a Latin-
American country. The study showed that specific cross-dock platforms could also increase delivery
and cost efficiency in places of high congestion. Lastly, Daganzo (1984) and Langevin et al. (1996)
also introduced one-to-many distribution approximation models, which fit the needs of our project
network model and justify the foundations of our approach.
Despite vehicle routing is operational and short-term, it is a very complex problem to be solved
mathematically. The continuous approximation will help enable the solution to be robust yet
comprehensible to solve network problems (Hall & Lin, 1994). In this research, we will not focus on
the vehicle routing problem as it is an operational problem that can be approximated. The inherent
complexity of multi-echelon LRP for large-scale problem instances in the context of real-world urban
geographies would render the optimization models virtually intractable if they depended on explicit
routing algorithms (Winkenbach et al., 2016). We instead focus on the high-level strategic and
tactical location-routing problems to compute needs, set expected capacities, and estimate various
logistic metrics.
In the next section, we will discuss the various factors influencing the choice of the distribution
network and their relative strengths and weaknesses. Determining key performance indicators
(KPIs) along with the tradeoffs will help identify distribution networks that are best suited for a
variety of customer and product characteristics.

2.4 KPIs and Tradeoffs for Supply Chain Network Design
This project found two major KPIs for kiranas distribution strategy and network design: cost-to-
serve (mostly on logistics cost) and service levels. First, cost-to-serve and logistics cost components
will be thoroughly discussed. Second, we examine the tradeoffs to logistics cost based on multiple
features of kiranas and their assortment. Finally, we discuss the service level expectations of kiranas
and its tradeoff to cost-to-serve.
On cost-to-serve, Mejía et al. (2015) introduced a cost-to-serve methodology in three phases to sort
kiranas depending on their profit and cost-to-serve. This study enabled us to understand each
segment of the cost, its drivers, and to determine its profit margin. By knowing and classifying its cost
depending on the commercial, logistics nature of all elements, the tradeoffs and the impact of kiranas'
distribution strategy and network design can be measured granularly and comprehensively. As we
run different scenarios and network designs, the inventory, transportation, handling, and
information costs are affected (Chopra, 2003).
Cost-to-serve is an impactful KPI for our project. Castañon-Choque (2018) analyzed the cost-to-serve
for a distribution company in Mexico and the impact that kiranas going bankrupt would have on their
logistics costs and operations. Her work considered commercial variable costs (e.g., credit and order
management), commercial fixed costs (e.g., leasing, maintenance, promoters, and salesforce payroll),
logistics variable costs (e.g., transportation, warehousing, inventory), and logistics fixed costs (e.g.,
leasing outsourcing). Transportation cost was simplified by using one-to-many continuous

 17
approximation. The authors indirectly discuss the variety of goods being distributed, but more as a
cost driver than a source of analysis.
On logistics cost, Daganzo (2005) classified four main cost components: transportation, handling,
rent, and inventory. Also, Gevaers et al. (2014) developed a last-mile cost model for business to
consumer (B2C) without considering inventory and handling at supply and transshipment points.
For B2B, the previous approaches will be similar except for a higher first-time hit rate and larger
drop size.
Tavassazy et al. (2010) defined the distribution costs as a function of inventory, handling, and
transportation costs. Inventory costs are modeled as a function of replenishment frequency, order
size, and transport time. Handling costs involve the transshipment points of unloading, picking, and
loading to the final delivery vehicle. The transport costs are modeled as a function of the distance,
shipment size, frequency, density, speed, and reliability of the mode used.
Furthermore, there is a tradeoff for serving kiranas with small drop sizes as it will increase sales and
transportation costs. Kirana characteristics and their assortment (i.e., wallet share) will determine
the replenishment frequency, that is, the number of times in a given period the kirana is served. The
latter impacts the drop size per delivery, calculated as the total volume demand in a given period.
This quantity is divided by the replenishment frequency during that period, impacting transportation
cost (Garza Ramirez, 2011). In addition, small drop size is inversely proportional to the number of
store visits (see Figure 2.9) due to small size, limited storage at kiranas, their limited cash on hand,
manual replenishment that requires multiple deliveries from various suppliers.
An increased replenishment frequency can reduce out-of-stock events and thereby increase sales
(Spoor, 2016). Also, upper limits on drop size due to cash constraints can impact frequency (Plasman,
2013). Plasman (2013) also considered that stores with small drop sizes will increase the
transportation cost extensively and that with high density, it would not be economically feasible to
serve them. Castañon-Choque (2018) reported that the new and usually smaller stores might cost
more despite the increased transportation cost. However, it is better to have them instead of losing
them to competitors, provided that they have a reasonable survival rate.
Figure 2.9. Relationship between frequency and drop size (taken from Kin, 2018)
Relationship Between Frequency and Drop Size (taken from Kin, 2018)

 18
Other studies have analyzed the tradeoffs of serving kiranas. Ge (2017) presented tradeoffs between
logistics costs and growth of demand for a distributor to choose between indirect and direct delivery
channels to serve kiranas. Direct delivery allows faster growth but has higher logistics costs.
However, the author also shows the need to define the most efficient pathway to serve kiranas.
Another tradeoff exists between kiranas' distance, routes, and density, whether we should build
transshipment points, service levels, and logistics costs. For a short distance, direct is always the best;
for long-distance, XD/UCC distribution is better (Spoor, 2016). The last-mile transportation cost also
varies depending on the properties of the receiving kiranas per geographic area. The number of
kiranas in each area will determine the stop density and, therefore, inter-customer travel distance
(Alho & de Abreu e Silva, 2014). Other cost variables that influence logistics cost are the (average)
stop time per kirana, the (average) distance from the depot to the first stop, the distance between
the stops and the average speed. (Gevaers et al., 2014). Last-mile delivery routes can be restricted on
two measures, by the vehicle's capacity or the available shift time of the driver (Boyer et al., 2009).
In summary, there exist multiple tradeoffs that affect logistics cost: sales of kiranas with small drop
sizes, indirect vs. direct channels, and building transshipment points based on density, routes, and
distance. Moreover, Kin (2018) identified some of the preferences of kiranas for store deliveries,
which depend on distribution strategy and network model: delivery at the store, delivery lead times,
delivery within a specific time window, real-time delivery information, products of different brands
bundling for delivery and possibility of express delivery. Fulfilling these service level requirements
will also impact the logistics cost due to the fragmentation caused by a lack of consolidation of routes
and shipments. A non-exclusive e-B2B distributor will be well placed to satisfy these preferences of
kiranas.

2.5 Gaps and Contributions
The literature review revealed some gaps in the research on kiranas: 1) Studies of non-exclusive e-
B2B distributors for delivery to kiranas in emerging market economies. 2) Careful analysis of various
tradeoffs to create high-performance distribution strategies to serve kiranas. 3) Quantitative models
proving the cost and service effectiveness of new distribution models. 4) Network strategy roadmaps
propose a flexible distribution scheme that considers the retail evolution and changes in
consumption patterns in an integrated way over an extended period.
After analyzing the current state of the art and understanding the practical challenges faced in kirana
distribution by distributors and manufacturers, the capstone project will:
 1) Formulate an e-B2B distribution strategy on the short-, medium- and long-term.
 2) Develop a network model which minimizes the cost-to-serve to implement the e-B2B
 distribution strategy.
 3) Analyze tradeoffs between multiple scenarios and drivers of cost-to-serve, efficiency, and
 service level (e.g., the frequency of kirana orders, wallet share of kirana orders fulfilled by the
 platform, delivery frequency, and geographical circuity values).
 4) Formulate a short list of recommendations and effort-impact matrix guidelines based on
 network model and qualitative findings, including the most critical parameters of the kirana
 distribution network strategy.

 19
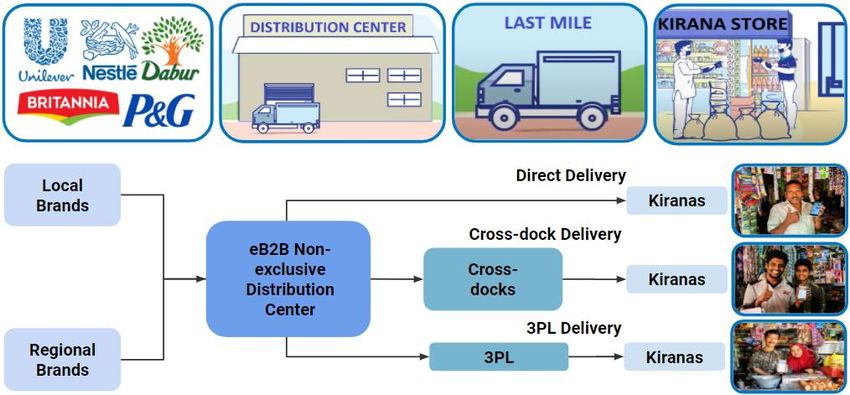
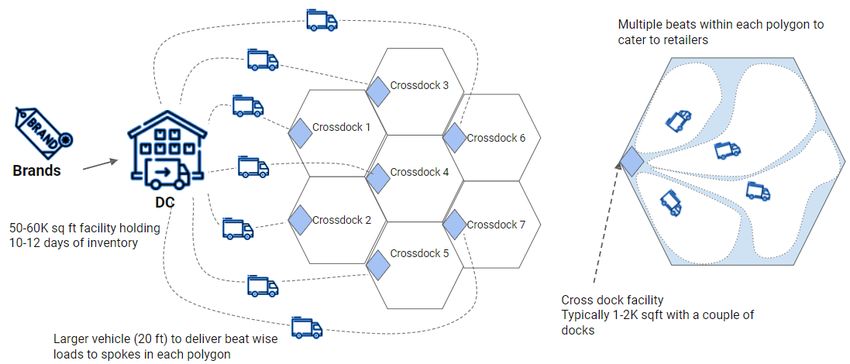
3 DATA AND METHODOLOGY
This chapter describes the methodology used to formulate a non-exclusive e-commerce business-to-
business (e-B2B) distribution strategy to serve kiranas (i.e., mom-and-pop stores) at optimal cost
and build a quantitative network model to determine the short-, medium-, and long-term network
expansion strategy. First, we developed a model to optimize the total logistics cost. Next, we
developed tradeoffs between cost-to-serve and negotiated service levels. We further analyzed the
tradeoffs among multiple business scenarios by changing the frequency, wallet share, number of
kiranas onboarded, kiranas, urban setting, and fleet capacity and compute the cost-to-serve and
service levels. Finally, we formulated business recommendations and derived actionable managerial
insights based on the study.

3.1 Business Overview
The company serves as an e-B2B distributor for kiranas in Indian megacities (see Figure 3.1). Local
and regional brands supply the consumer-packaged-goods (CPG) to the distribution center (DC)
through consolidation and forwarding agents (C&FA) and distributors. At the DC, the goods are
inbounded and put away in storage locations.
Figure 3.1.
The End-to-end Supply Chain of e-B2B Distributor for Kiranas

As the kiranas put the orders throughout the day, the DC will pick, sort, pack, and dispatch the
packages and goods. Once dispatched, the parcels go through three types of delivery: direct, cross-
dock, and 3PL direct. Whereas direct delivery is typically used for short-distance kiranas, cross-dock
delivery is suited for longer-distance kiranas. Finally, third-party logistics delivery is allocated for
kiranas in lower-demand tier-2 cities or non-densely populated areas.
Operationally, when kiranas order before 18:00 hours, they expect a next-day delivery (D1) for those
located
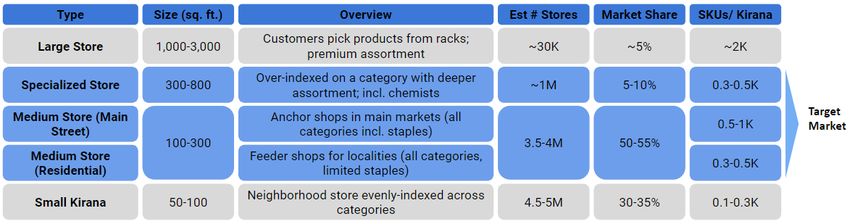
Figure 3.2. Operations Clock of Kirana Distribution
Operations Clock of Kirana Distribution

To further understand the kiranas, it is essential to know how they are segmented. Kiranas are
generally categorized into five segments: large, specialized, medium main street, medium residential,
and small (see Figure 3.3). For our project, the company focuses on the specialized and medium
kiranas as its target market. Currently, large kiranas are already well-served with the state-of-the-
art distributions; the rest of the kiranas are not. Moreover, small kiranas' drop sizes are too
insignificant to match the cost-to-serve (Plasman et al., 2013; Castañon-Choque, 2018). Thus, the
target market segment possesses high potential in volume, economies of scale, and serviceability. It
also encompasses more than half of the retail market share (4.5-5.5 million kiranas).
Figure 3.3. Kirana market segments and the company's target market (Sponsor Company, 2020)
Kirana Market Segments and The Company's Target Market (Sponsor Company, 2020)

3.2 Distribution Strategy Key Performance Indicators (KPIs) and Tradeoffs
The first KPI is cost-to-serve (see Figure 3.4). Minimizing cost-to-serve is crucial in e-B2B
distribution strategy, and the components are within the company's control. The most significant
component of cost-to-serve is delivery logistics cost, which will be optimized using our distribution
network model. The company will utilize numbers derived its internal analyses for the cost of goods
sold, other logistics costs, commercial costs, other costs, taxes, depreciation, and amortization. With
this framework, we will compute the net profit and total cost-to-serve (TCTS) for the e-B2B
distributor and use it as a strategic and measurement tool to serve kiranas.

 21
You can also read