Economics of Education - Munich, 3-4 September 2021 Alma Mater Matters: College Quality, Talent, and Development - CESifo
←
→
Page content transcription
If your browser does not render page correctly, please read the page content below
Economics of Education
Munich, 3–4 September 2021

Alma Mater Matters: College Quality, Talent,
and Development
Paolo Martellini, Todd Schoellman, and Jason Sockin
Alma Mater Matters:
         College Quality, Talent, and Development∗
            Paolo Martellini†              Todd Schoellman‡                 Jason Sockin§

                                            August 2021

                                                Abstract

           We develop a global measure of college quality based on the earnings of each col-
      lege’s graduates around the world. We use a new database that details earnings and
      alma maters for a large number of natives and migrants, who are key to our iden-
      tification strategy. We find that: i) college quality is an important determinant of
      earnings, as graduates of top colleges earn 57 percent more than graduates of typical
      colleges, ii) college quality is strongly correlated with development, as graduates from
      the richest countries earn 65 percent more than graduates of the poorest countries in
      the same labor market, and iii) college quality predicts innovation and entrepreneur-
      ship across countries and colleges. Last, we estimate average human capital for mi-
      grants by origin-destination pair. We show that developing countries lose more to
      brain drain and a small set of OECD countries gain more from global talent flows
      than traditional measures based on numbers of skilled migrants alone would suggest.

      JEL: O15, O11, J3, J6.
      Keywords: College quality, human capital, entrepreneurship, innovation, develop-
      ment, migration.

   ∗ Thanks to seminar participants at the University of Pennsylvania for productive comments and discus-

sions. The views expressed herein are those of the authors and not necessarily those of the Federal Reserve
Bank of Minneapolis or the Federal Reserve System.
   † University of Wisconsin-Madison. E-mail: martellini@wisc.edu
   ‡ Federal Reserve Bank of Minneapolis. E-mail: todd.schoellman@gmail.com
   § University of Pennsylvania. Email: jsockin@sas.upenn.edu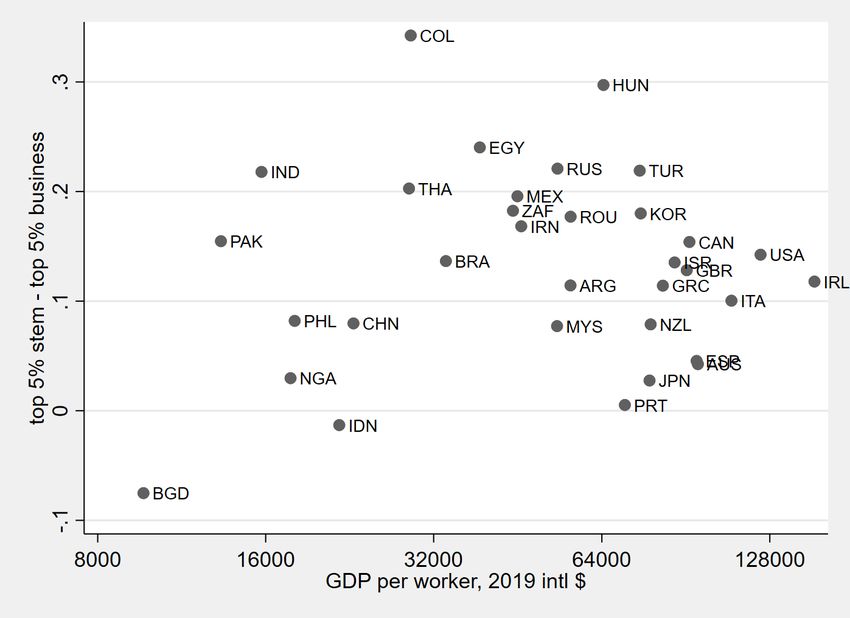
1     Introduction
Internationally standardized achievement tests point to large cross-country differences
in primary and secondary education quality.1 These test scores are an essential building
block for work demonstrating the importance of education quality for a country’s income
level and growth rate.2 Existing testing programs do not extend to tertiary education,
leaving us with little evidence on the extent of cross-country variation in college quality.
This absence is notable given the growing evidence that college quality plays an impor-
tant role in human capital formation and innovation within the United States.3
    We address this gap by developing a measure of college quality that is meaningfully
scaled and comparable across countries. Our approach builds on recent work that evalu-
ates colleges within a country based on their graduates’ earnings. We implement a gen-
eralization of this approach that ranks colleges around the world on the same basis. Our
measure provides new insights relative to the standard, proxy-based rankings of colleges.
For example, it ranks the quality of the very top colleges in developing countries much
higher. Nonetheless, the covariance between average college quality and gross domes-
tic product (GDP) per worker is positive and large, indicating that college quality is an
important contributor to cross-country human capital and income differences. We then
show that college quality is closely related to the global supply of top talent by linking it
to measures of entrepreneurs and innovators across countries and across colleges within
a country.
    Our analysis utilizes the proprietary database of the website Glassdoor.4 The website
collects information on job and pay from users in return for providing comparisons to
their peers. Many users also upload their resumes, which provide detailed educational
histories. The database includes a sample of earnings for 1.4 million workers who ob-
tained a Bachelor’s degree from 2,872 different colleges in 48 countries. Many countries
in our sample produce similar earnings data for graduates who are employed domesti-
cally, such as the “College Scorecard” released by the U.S. Department of Education. We
    1 Most prominently, the OECD’s PISA exams are administered to 15 year-olds, while the U.S. Department

of Education’s TIMSS exams are administered to students in grades 4 and 8.
   2 See Hanushek and Woessmann (2011), Schoellman (2012), and Cubas et al. (2016).
   3 We use the word college throughout for institutions that offer accredited, four-year tertiary education.

See Card and Krueger (1992) and Heckman et al. (1996) on cross-state variation in education quality in the
United States. Bell et al. (2019) shows that invention in the United States is concentrated among graduates
of a narrow set of colleges; Biasi and Ma (2020) show these colleges are high-quality, as measured by their
propensity to teach frontier rather than out-of-date knowledge.
   4 This database has also been used to explore the drivers of variable pay (Sockin and Sockin, 2019a),

the use of variable pay to reduce firm-level volatility (Sockin and Sockin, 2021), and the pass-through of
firm-specific shocks to worker compensation (Gadgil and Sockin, 2020). This paper is the first to explore
differences between colleges.

                                                     1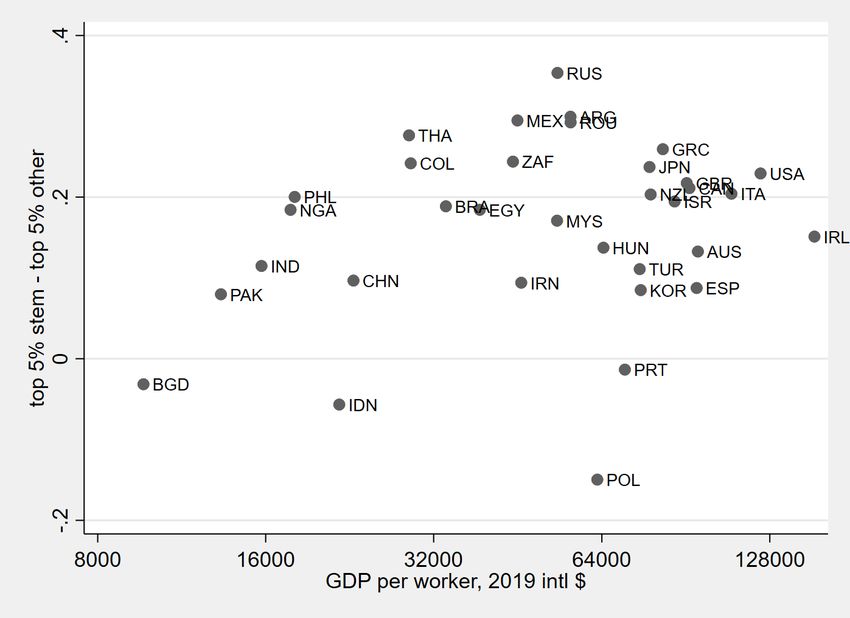
show that in this case our ranking agrees closely with this existing information both in
terms of the level of earnings and the rank correlation across colleges.
    These rankings cannot be compared across countries without further work. The chal-
lenge goes beyond the usual problem with currencies and exchange rates. More fun-
damentally, the earnings of Oxford and Indian Institute of Technology (IIT) graduates
reflect the human capital of graduates as well as the influence of the very different coun-
tries where they work. We want to isolate the former. The key to making progress on this
issue is that the Glassdoor database includes a large sample of workers who report earn-
ings for multiple countries. These migrants provide information that makes it possible to
adjust for the effect of country and construct an internationally comparable measure of
college quality.
    Our approach can be understood using a hypothetical worker who graduates from an
IIT, works in India, and subsequently migrates to and works in the United Kingdom. The
worker’s post-migration earnings are informative about how her human capital com-
pares to that of Oxford graduates within a common country. This particular worker is
generally not the average IIT graduate. However, we can compare the migrant’s pre-
migration earnings to those of other IIT graduates within India to measure where the
migrant fits in the overall earnings distribution and adjust for selection. An alternative
way to understand this approach is that the change in earnings at migration informs us
about the importance of country of work for earnings of college workers, as in Hendricks
and Schoellman (2018).5 We then apply this estimated country effect to all graduates to
put them on a common footing. Our implementation builds on this intuition, using the
data provided by migrants among a large set of countries.
    Our estimates show that alma mater matters. As a first approach, we estimate the
earnings gain from attending top colleges based on the rankings of the Center for World
University Rankings (CWUR), one of the more widely used proxy-based rankings. We
find that graduates of their top-20 colleges earn 57 percent more than graduates of un-
ranked colleges. That figure is in line with standard estimates on the total earnings pre-
mium for attending college in the United States.6 Alternatively, we construct our own
ranking based solely on earnings. Our ranking is positively correlated with existing
global and within-country rankings (correlation coefficients 0.38 and 0.61). However, it
gives new insights along several dimensions. For example, selective liberal arts colleges
perform much better in our rankings than in existing ones. There are also many more
   5 We follow also a large literature that uses migrants to disentangle the importance of human capital

from place-based effects, such as capital intensity, total factor productivity, or the skill bias of technology
(Hendricks, 2002; Schoellman, 2012, 2016; Okoye, 2016; Rossi, 2020).
   6 For example, the ratio of median earnings for workers with a bachelor’s degree to workers with a high

school degree in 2019 is 1.59 (National Center for Education Statistics, 2020, Table 502.30).

                                                      2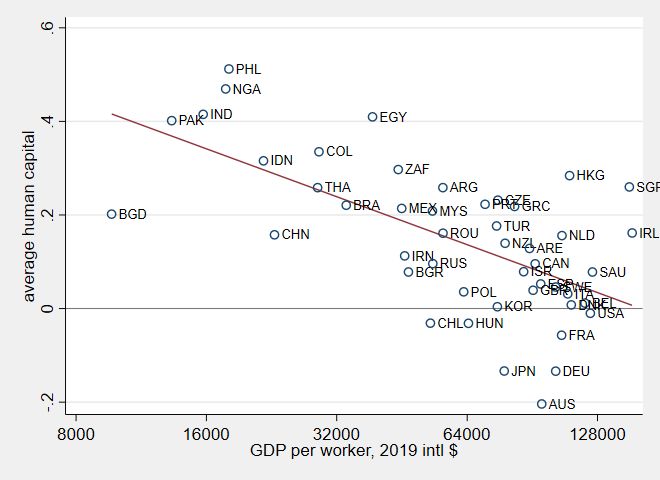
colleges from developing countries at the top of our rankings, particularly those that fo-
cus on science and technical education. The most striking example is that four of the top
ten colleges in our rankings are different branches of the IITs, which rank in the 500–1000
range in CWUR rankings. Those low rankings seem inconsistent with the high salaries
their graduates command throughout the world.
    We aggregate our findings to the country level and study their importance for growth
and development. The quality of a nation’s colleges in various percentile bins is strongly
correlated with development, with the estimated elasticity centered on 0.2. This finding
seems to hold equally well for top and median colleges, suggesting that college quality
is uniformly lower in poorer countries. To put these figures into perspective, graduates
of our richest countries’ colleges would be expected to earn about 65 percent more in the
same labor market compared with graduates of the poorest countries’ colleges.
    The quality of a nation’s colleges is particularly important for the supply of top tal-
ent responsible for much of entrepreneurship and innovation. We link our measures of
college quality to data on where chief executive officers (CEOs) of S&P 500 firms, Nobel
laureates, and patent holders receive their undergraduate degrees. We show that college
quality is a robust predictor of each for both Americans and non-Americans. The relation-
ship holds at the country level, even if we also control for Gross Domestic Product (GDP)
per worker. It holds at the college level, even if we control for country fixed effects. These
findings reinforce the view that college quality is an important determinant of a nation’s
ability to develop leading firms and undertake innovation.
    We also use our data to provide new evidence on brain drain and global talent flows.
The existing literature documents that less developed countries lose skilled workers (brain
drain) and that they mostly migrate to a small subset of OECD countries (global talent
flows). We add to this body of work by providing new evidence on the average human
capital per emigrant and per immigrant for each country in our database. We document
that less developed countries lose more from brain drain because their emigrants are also
significantly positively selected on average human capital. We also find that global talent
flows are more concentrated than what is implied by traditional quantity-based measures
because only a subset of developed countries attract skilled migrants with average human
capital that exceeds that of natives.
    The remainder of the paper is organized as follows. Section 2 details our empirical
approach, while section 3 overviews the Glassdoor data that make it feasible. Section 4
gives our main results, while section 5 provides details on sensitivity. Section 6 presents
our results for global talent flows. Finally, section 7 provides a brief conclusion.

                                              3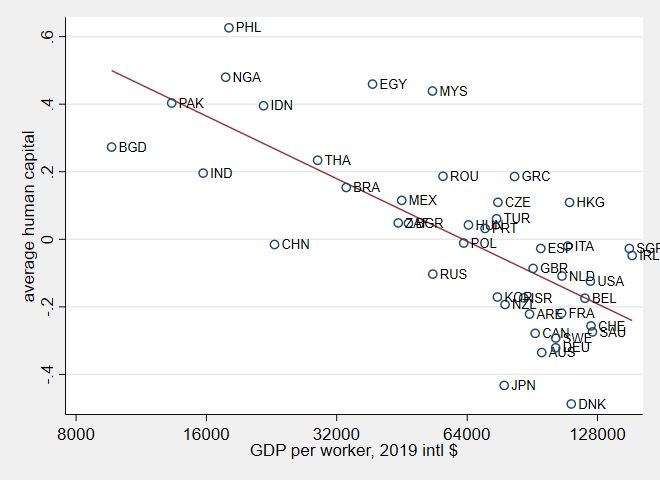
2    Methodology
In this section we present the methodology that allows us to build an internationally
comparable, earnings-based measure of college quality. Our baseline analysis builds on
three assumptions that are widely used in the literature that draws inferences about cross-
country human capital differences from the experiences of migrants. First, we assume the
marginal product of labor is log-separable with respect to the effects of country, college
quality, and worker’s ability.7 Second, we assume that labor markets are perfectly com-
petitive, which implies that wages are equal to the marginal product of labor. Third, we
assume that a worker supplies the same human capital in any country where he or she
might work. This assumption rules out both difficulty among migrants in transferring
their skills to their new country or migrants having (and sorting along) country-specific
skills. We investigate the sensitivity of our analysis to departures from these assumptions
in Section 5.
    Under these assumptions, the wage of worker i who earned her bachelor’s degree
from college j in country c and is employed in country c0 is given by

                                  log(wi,j,c,c0 ) = zc0 + q j + ε i,j,c,c0 .                        (1)

Here, zc0 is the effect of country of work (e.g., total factor productivity), q j is the quality of
college j, and ε i,j,c,c0 is the ability of worker i.
    We normalize E[ε i,j,c,c ] ≡ 0, which implies that q j is the average human capital of
graduates from college j. We think of this measure as the relevant information for poten-
tial employers, which might use alma mater to draw inference about an applicant’s skills.
As we show in Section 4, this measure is also a strong predictor of innovation and en-
trepreneurship. Our measure of quality is distinct from the college’s value added, which
may be the more relevant measure of quality for students or policymakers. As we discuss
below, our data do not allow us to pursue this interesting avenue.
    Migrants play an essential role in our identification by allowing us to estimate and
adjust for the effect of country zc0 . While non-migrants are not selected, migrants may
be. In our baseline analysis, we assume that selection is the same for migrants from any
college j in c who are employed in c0 . This assumption implies that we have to control for
average selection ε̄ c,c0 for each origin-destination pair (c, c0 ). This is the fourth assumption
of our benchmark approach that we investigate further in Section 5.
   7 Hendricks and Schoellman (2018) show that a Cobb-Douglas aggregate production function and perfect

substitution among workers with different levels of human capital is one way to satisfy this assumption.

                                                     4
2.1   Identification
We illustrate the sources of variation in the data that allow us to compare college qual-
ity across countries. In doing so, we highlight the minimal set of observations needed
to address the threats to identification that arise both from cross-country differences in
productivity that are unrelated to human capital and selection into migration.
    Consider, for simplicity, the case of two countries, c and c0 , and three groups of work-
ers: stayers in c denoted by Sc , movers from c to c0 denoted by Mc,c0 , and stayers in c0
denoted by Sc0 . Let w̄y,c be the average earnings of workers in group y = {Sc , Mc,c0 , Sc0 }
and country c. Under specification (1), we can express average earnings as

                                          w̄ j,Sc ,c =q j + zc
                                       w̄ j,Mc,c0 ,c =q j + zc + ε̄ c,c0
                                                                                              (2)
                                      w̄ j,Mc,c0 ,c0 =q j + zc0 + ε̄ c,c0
                                        w̄ j0 ,Sc0 ,c0 =q j0 + zc0 ,

where j and j0 denote colleges in country c and c0 , respectively. In what follows, we
omit the indices j and j0 from the expressions for average wages since we consider one
college per country. We are interested in estimating the difference in (log-)quality q j − q j0 .
Combining the equalities from equation (2), it is easy to show that

                      q j − q j0 = (w̄Sc ,c − w̄Sc0 ,c0 ) − (w̄ Mc,c0 ,c − w̄ Mc,c0 ,c0 ).    (3)

That is, the quality gap between schools j and j0 is given by the difference in wage between
stayers in those countries, w̄Sc ,c − w̄Sc0 ,c0 , net of the wage change experienced by movers
from country c to c0 , w̄ Mc,c0 ,c − w̄ Mc,c0 ,c0 .
    To gain intuition into why all three sets of workers are necessary for our analysis,
consider two alternative scenarios in which information on either movers from or stayers
in country c were missing. In the first scenario, we would obtain

                           (q j − q j0 ) + (zc − zc0 ) = (w̄Sc ,c − w̄Sc0 ,c0 ).              (4)

Absent movers, it would not be possible to distinguish the cross-country earnings gap
that is attributable to differences in school quality from other country-specific determi-
nants of productivity. In the second scenario, if we replaced the missing observation from
stayers in country c, w̄Sc ,c , with that of movers from the same country, w̄ Mc,c0 ,c , we could

                                                        5
only recover
(q j − q j0 ) + ε̄ c,c0 = (w̄ Mc,c0 ,c − w̄Sc0 ,c0 ) − (w̄ Mc,c0 ,c − w̄ Mc,c0 ,c0 ). (5)
Equation (5) shows that we cannot infer differences in the average human capital of col-
lege graduates across countries without using stayers in both countries, except under
the assumption that movers are representative of the college graduate population, i.e.
w̄Sc ,c = w̄ Mc,c0 ,c or ε̄ c,c0 = 0. As shown in section 6, this assumption is strongly rejected by
the data.
2.2 Estimation Procedure
In practice, the structure of the Glassdoor database leads us to use a two-step estimation
process for extracting our three coefficient vectors of interest: i) the earnings premium
specific to country of work zc0 , ii) the selection in unobserved quality among graduates
who migrate for work ε̄ c,c0 , and iii) school quality q j . The first step uses workers who
report earnings in more than one country. On this sample, we estimate
log(wi,t,c0 ) = zc0 + λi + βXit + ε i,t,c0 . (6)
where λi are worker fixed effects and Xit includes a quadratic in years of experience and
year fixed effects. Intuitively, this equation estimates how much earnings grow at migra-
tion (after adjusting for time and changes in work experience) and assigns this gain to the
effect of country, zc0 .
With the vector of country-specific premia zc0 in hand, we turn to the second step in
which ε̄ c,c0 and q j are jointly estimated from the larger sample of workers who provide in-
formation on where they attained their bachelor’s degree and at least one earnings report.
On this sample, we estimate
log(wi,j,c,c0 ) − zc0 = q j + γXit + ε̄ c,c0 + ηi,j,c,c0 , (7)
where Xit includes a quadratic in years of experience along with major of study and year
fixed effects, and ηi,j,c,c0 = ε i,j,c,c0 − ε̄ c,c0 is a mean-zero residual. We now turn to the dataset
that makes implementing this two-step procedure possible.
63 Data
The primary data source for our work comes from the online platform Glassdoor, where
workers can review their employers, document their earnings, and search for jobs. Indi-
viduals are incentivized to contribute information through a “give-to-get” policy, whereby
those who contribute to the website, via an employer review or pay report, gain access
to the reviews and pay reports submitted (anonymously) by others. Users provide Glass-
door with a wealth of information. First, users are asked when registering to provide a
resume, which about one-quarter do. Second, users provide information on their earn-
ings (base pay, variable pay, currency, and periodicity) and the detailed nature of their
work (employment status, job title, location, and firm). Some users provide this infor-
mation for multiple years, multiple jobs, and multiple countries in order to receive new
or updated comparisons. Consequently, our earnings data consist of employee-employer
matches with a rich set of worker observables.
We have access to the full database on earnings spanning the years 2006–2020. Later
years contribute disproportionately to the sample as Glassdoor has become more widely
used over time. We impose several sample restrictions throughout to ensure comparabil-
ity and limit measurement error. First, we restrict our attention to only full-time employ-
ees to avoid imputing hours worked. Second, we annualize labor earnings, assuming
that full-time hourly workers are employed two thousand hours per year and full-time
monthly workers are employed twelve months per year. We focus on base income, which
excludes any variable earnings from cash bonuses, stock bonuses, profit sharing, sales
commissions, tips, gratuities, or overtime.8 Last, we exclude workers for whom the cur-
rency of earnings does not match their country of employment’s predominant currency,
and winsorize the top and bottom 0.1% of earnings to limit the influence of any outliers.
As detailed in Section 2.2, we follow a two-step estimation process. The first step
utilizes the sample of workers who provide earnings reports for more than one country.
We require that a country be connected through at least 25 migrants (emigrants or immi-
grants) to or from the ten countries with the most migrants in Glassdoor to be included
in our sample. This restriction ensures that countries in our sample are sufficiently con-
nected through migration and that the country effects are estimated with sufficient preci-
sion. The resulting sample includes 73,000 workers migrating among 55 countries around
the world; see appendix table A1 for details. As discussed in Section 2, we would also
be interested in constructing a value-added measure of college quality, if possible. How-
8 Ourconcern here is measurement error, as variable pay is reported imprecisely for workers paid on an
hourly or monthly basis. While more than one-third of U.S. workers (Lemieux et al., 2009) and 22%–55%
of salaried workers in Glassdoor abroad (table A-5 of Sockin and Sockin (2019b)) report earning variable
income, Sockin and Sockin (2019a) estimate that variable pay accounts for 4–7% of employee labor income.
7ever, the nature of the Glassdoor database is such that very few workers submit earnings
reports from before and after they graduate college, rendering this estimation infeasible.9
The second step uses earnings net of the effect of country to estimate college quality.
This step requires joint evidence on a worker’s earnings and where they received their
degree. Here we use the one-quarter of workers who submit resumes when creating a
profile on Glassdoor. Resumes typically contain data on educational attainment; around
one-half of resumes contain information regarding college and degree that we can use
after cleaning. We keep information for the colleges where the respondent received their
bachelor’s degree and their most advanced post-bachelor’s degree, if one is present. We
clean and standardize information on the college name, the degree attained, major, and
grade point average. Our benchmark sample includes workers who report their alma
mater and for whom we know or can infer with a high probability that the degree in
question was a bachelor’s degree. See Appendix C for further details.
For the second step, we restrict attention to colleges with at least 25 workers with
earnings reports in Glassdoor. This restriction ensures that the college effects are esti-
mated with sufficient precision. Our sample for the second stage consists of 1.4 million
workers with data on undergraduate alma mater and earnings from 2,872 colleges in 48
different countries, with 1,318 colleges residing outside of the United States. We are able
to capture global college quality because our sample has sufficient coverage of graduates
from universities outside the United States: 372,000 workers who received their bache-
lor’s degree outside the United States, 65% of which are then employed in their country
of study. See table 1 for details of this sample.
In addition to Glassdoor, we rely upon a handful of other datasets. From the CWUR,
we obtain a global ranking of the top 2000 colleges, which provides a natural comparison
for our earnings-based rankings. Each college included in the list is also assigned a na-
tional ranking, which we use to compare top colleges between countries. To adjust earn-
ings by inflation and purchasing power parity (PPP), we obtain purchasing PPP-adjusted
exchange rates from World Bank (2020). To analyze the import of country-specific in-
come, we obtain PPP-adjusted GDP per worker from World Bank (2020). To adjust for
the number of colleges per country we use the data provided by World Higher Education
Database (World Higher Education Database, 2021).
9 Alternatively, we could estimate pre-collegiate earnings, as in Belfield et al. (2018). Glassdoor also has
limited information for doing so.
8Table 1: Summary of Global College Coverage
GDP per Colleges Graduates
Country Abb. worker ($) Overall Top 5% Domestically Abroad
Bangladesh BGD 9,661 16 1 524 1,100
Pakistan PAK 13,299 30 4 1,748 2,596
India IND 15,722 289 24 130,078 49,841
Nigeria NGA 17,724 31 4 1,272 2,333
Philippines PHL 18,031 75 2 5,058 4,591
Indonesia IDN 21,670 16 1 1,015 377
China CHN 22,977 133 46 1,257 12,832
Thailand THA 28,898 11 4 546 414
Colombia COL 29,103 11 5 134 608
Brazil BRA 33,645 41 21 3,542 1,358
Egypt EGY 38,698 24 2 3,178 2,290
South Africa ZAF 44,370 13 2 1,217 1,415
Mexico MEX 45,198 24 8 1,173 1,300
Iran IRN 45,915 15 10 221 1,994
Bulgaria BGR 46,839 5 1 162 207
Chile CHL 52,647 2 2 36 100
Malaysia MYS 53,222 29 4 3,042 956
Russia RUS 53,319 9 4 240 591
Argentina ARG 56,252 6 1 259 305
Romania ROU 56,288 10 3 551 683
Poland POL 62,843 12 9 354 418
Hungary HUN 64,450 10 1 534 341
Portugal PRT 70,406 7 4 272 236
Turkey TUR 74,854 25 8 2,229 1,942
South Korea KOR 75,170 25 9 432 1,472
Czech Republic CZE 75,376 3 2 77 89
Japan JPN 77,951 6 5 130 248
New Zealand NZL 78,314 7 1 641 1,059
Greece GRC 82,353 14 1 796 882
Israel ISR 86,447 18 1 2,489 1,078
United Arab Emirates ARE 89,182 2 0 102 82
United Kingdom GBR 90,885 131 12 34,281 14,184
Canada CAN 91,897 80 7 26,405 7,263
Spain ESP 94,672 28 5 1,003 1,436
Australia AUS 95,166 35 4 4,300 7,019
Germany DEU 102,505 7 4 125 171
Sweden SWE 102,530 3 1 67 157
France FRA 105,775 11 1 185 403
Netherlands NLD 105,986 17 3 537 513
Italy ITA 109,284 34 4 1,516 2,174
Hong Kong HKG 110,352 9 0 1,817 551
Denmark DNK 111,352 4 1 83 215
Belgium BEL 119,767 6 2 130 210
United States USA 123,239 1,554 92 1,029,946 14,969
Switzerland CHE 123,657 1 0 27 32
Saudi Arabia SAU 124,616 4 2 205 77
Singapore SGP 151,616 9 0 5,122 493
Ireland IRL 153,923 20 2 2,451 1,557
Total 48 2,872 330 1,271,509 145,162
Total excluding USA 47 1,318 238 241,563 130,193
Notes: Table lists the 48 countries for which we can estimate college quality for at least one college. Each row gives country name
and abbreviation, GDP per worker (annual average from 2010–2020, from World Bank (2020), number of colleges for which we can
estimate quality, and the number of graduates from those colleges employed domestically and abroad.
93.1 Sample Validation
All of our results rest on analysis of the Glassdoor database. This naturally raises the
question of whether our sample is representative of the underlying population. Karabar-
bounis and Pinto (2019) show that Glassdoor wage data broadly match first and second
moments of the earnings distribution by industry and by region in the United States us-
ing data from the Quarterly Census for Employment and Wages and the Panel Study of
Income Dynamics. Sockin and Sockin (2019b) find correlations of about 0.9 and 0.8 for
the first and second moments of total income between industry and three-digit standard
occupation category occupations in the United States using the American Community
Survey. We add to this evidence by comparing mean earnings by college between Glass-
door and representative samples from select countries.
We start with the United States. The United States Department of Education publishes
a “College Scorecard” that uses tax data from the United States Treasury to provide “me-
dian earnings of graduates working and not enrolled 1 [2] year[s] after completing highest
credential.” The median earnings data is disaggregated by college, degree attained, and
major of study. We limit attention in Glassdoor to recipients of bachelor’s degrees from
U.S. colleges who report earnings one or two years after the graduation dates reported
on resumes. We match these observations to the College Scorecard data by college, de-
gree, major, and years since graduation, which captures 78,000 workers in Glassdoor from
1,429 colleges.
The difference in log earnings between Glassdoor and the College Scorecard data pro-
vides a measure of selection at the college, degree, major, and cohort level. We aggregate
this measure of selection to the college level (using the Glassdoor sample as weights) and
plot the density of college-level selection in Figure 1. The distribution is symmetric, cen-
tered on zero, and has small tails. This indicates that Glassdoor provides an unbiased
sample of earnings by college in the United States.
Our goal is to measure college quality using earnings of graduates around the world.
An important concern is that Glassdoor may be less representative in other countries
where the platform has a smaller presence. To provide evidence on this concern, we
repeat the same selection exercise using nine other countries for which we have been able
to find representative data on earnings by college. The details for each country are laid
out in Appendix B.
Table 2 summarizes some of the key results of these exercises for all ten countries. For
each country it shows their PPP GDP per worker, the number of colleges and graduates
in Glassdoor that we match to representative data sources, and the resulting estimates of
selection. Overall selection varies by country and appears correlated with development,
10Figure 1: Sample Selection into Glassdoor for U.S. Graduates
Notes: Figure captures the distribution across colleges of the difference between mean log earnings in Glassdoor and mean log earn-
ings in the Department of Education’s College Scorecard database.
consistent with the hypothesis that Glassdoor users are a more selected segment of the
college graduate workforce in developing countries. Our main result in this paper is that
college quality is lower in developing countries as measured by earnings in Glassdoor.
If workers who participate in Glassdoor are more selected in developing countries, this
only works to strengthen the result. We also compare selection for the top five percent of
colleges versus other colleges within each country, where the top five percent are based
on CWUR rankings for each country. The degree of selection is similar for most countries
and there is no clear pattern with respect to development. With these results in hand, we
now turn to using the sample to estimate college quality.
Table 2: Sample Selection into Glassdoor for Select Nations
Colleges Graduates Average selection estimate (ŵ j )
GDP per
Country worker ($) Overall Top 5% Overall Top 5% Overall Top 5% Other 95%
India 15,722 31 10 400 163 -0.09 -0.13 -0.06
China 22,977 3 – 155 – 0.71 – –
Colombia 29,103 11 2 25 6 0.11 0.09 0.11
Poland 62,843 19 10 394 263 0.28 0.33 0.19
New Zealand 78,314 7 1 398 160 -0.01 0.02 -0.03
United Kingdom 90,885 116 12 4070 534 0.03 -0.11 0.05
Australia 95,166 36 4 565 153 -0.01 0.01 -0.02
Italy 109,284 28 3 67 25 0.31 0.35 0.28
United States 123,239 1429 95 77939 20818 0.02 0.00 0.03
Singapore 151,616 4 0 340 0 -0.15 – -0.15
Notes: Table above summarizes the average selection into Glassdoor data for ten countries for which external data for comparison
are available. For details regarding the external data used for each nation, the level of aggregation for each comparison group, and a
summary of how comparison samples in Glassdoor are constructed, see Section B of the Internet Appendix.
114 Main Results
The two-step estimation procedure outlined in Section 2 along with the Glassdoor data
described in Section 3 allow us to estimate the earnings premium for 48 countries and
college quality for 2,872 colleges. Appendix table A1 shows the estimated country effect,
zc0 , which generally lines up with, but varies much less than, GDP per worker. This result
is similar to the finding in Hendricks and Schoellman (2018). In this section, we highlight
our first main results of interest: the estimates of college quality and their importance for
entrepreneurship and innovation.
4.1 Measuring College Quality
We start by using our estimates of college quality to provide an economically significant
scale to the widely-used CWUR rankings. To do so, we estimate the average quality for
colleges in various ranking bins (e.g., 1–20, 21–50, etc.) as compared to unranked (out-
side the global top 2000) colleges. The results are shown in table 3, along with standard
errors and the number of colleges in each ranking bin included in our sample. Our anal-
ysis excludes colleges that have fewer than twenty-five graduates who report earnings in
Glassdoor. There is a statistically and economically significant premium for graduating
from a highly-ranked college. The premium grows from 12 log points for colleges ranked
1001–2000, to 33 log points for colleges ranked 51–100, and reaches a substantial 45 log
points (57 percent) for colleges ranked in the top twenty. To put this last number into
perspective, we note that the college earnings premium is 59 percent in the United States
in 2019 (see footnote 6 for details and source). That is, the earnings difference between
attending a college ranked in the global top twenty instead of outside the global top 2000
is nearly as large as the earnings difference between attending college or not in the United
States.
Table 3: College Premia and CWUR World Ranking
World ranking
1–20 21–50 51–100 101–250 251–500 501–1000 1001–2000
College quality 0.452∗∗∗ 0.359∗∗∗ 0.329∗∗∗ 0.267∗∗∗ 0.197∗∗∗ 0.163∗∗∗ 0.118∗∗∗
(0.045) (0.041) (0.033) (0.019) (0.015) (0.012) (0.011)
[19] [23] [36] [104] [174] [276] [335]
Notes: Table displays our measure of (log) college quality q j as a function of various ranking groups from the Center for World
University Rankings. Omitted category is unranked (below 2000). Standard errors are in parentheses and number of colleges in our
sample within each bin in brackets.
Alternatively, we can construct our own global ranking based on the estimated quality
12of each college. The top 100 colleges are shown in table 4. We focus on broad trends rather
than the ranking of any particular school, which may be affected by noise in estimated
college quality. The ranking includes many expected groups of colleges. For example,
it features most of the Ivy League colleges, several of the world’s top technical colleges
(e.g., California Institute of Technology, Technical University of Munich, Technion – Israel
Institute of Technology), and two of the top U.S. public colleges (University of Michigan
and University of California, Berkeley).
However, the ranking also reveals some surprises. We highlight two. First, selective
liberal arts colleges do much better in our ranking than in the CWUR ranking. Four-
teen of the top one hundred colleges are U.S. liberal arts colleges.10 Second, our ranking
emphasizes much more colleges with a technical orientation from around the world. The
most notable example is the dominance of the Indian Institutes of Technology at the top of
the rankings. While these colleges are typically ranked in the 500–1000 range in CWUR,
we argue that these rankings are not commensurate with the earnings their graduates
command around the globe.
One potential concern with these and subsequent results is that they may reflect sig-
naling and university prestige rather than human capital. The fact that our ranking di-
verges from standard ones provides one piece of evidence against this hypothesis. As
a second piece of evidence, we estimate the return to standard normalized GPA within
each college. We find a large return to GPA for migrants and non-migrants, in the United
States and around the world. See table A2 for details. We view this return as further
evidence that employers pay for human capital rather than prestige.
Although interesting, the ranking in table 4 uses data from only 100 of our 2,872 total
colleges. Our next results focus on the overall distribution of college quality by country
and its contribution to cross-country human capital and income differences.
4.2 College Quality and Cross-Country Human Capital Differences
In this section we show that college quality is systematically related to GDP per worker.
This finding implies that the common practice of focusing on the share of a nation’s work-
force that has graduated college understates cross-country differences in the supply of
skilled labor.
The Glassdoor data have better coverage of graduates from top colleges. Given this,
we start by focusing on the quality of top colleges by country and how it correlates with
development. We consider two notions of top colleges: either the average quality of a
10 They are Amherst, Barnard, Claremont McKenna, Colgate, Cooper Union, Harvey Mudd, Haverford,
Middlebury, Pomona, Swarthmore, US Air Force Academy, Washington and Lee, Wesleyan, and Williams.
13Table 4: Top 100 Colleges By Estimated Quality
College quality College quality
World World
Rank College Country ranking Graduates qj Rank College Country ranking Graduates q j
1 Indian Institute of Information Technology Allahabad IND . 55 0.46 51 Université Paris-Dauphine FRA 885 26 0.26
2 University of Pennsylvania USA 9 600 0.43 52 Swarthmore College USA 815 288 0.26
3 Keio University JPN 86 64 0.42 53 Indian Institute of Technology, BHU IND 1519 116 0.26
4 Indian Institute of Technology Kanpur IND 830 173 0.38 54 The American University of Paris FRA . 84 0.26
5 Indian Institute of Technology Delhi IND 548 145 0.38 55 Babson College USA 940 597 0.26
6 Sophia University JPN 1837 77 0.38 56 Technische Universität Darmstadt DEU 476 25 0.26
7 Harvard University USA 1 325 0.37 57 Queensland University of Technology AUS 390 390 0.25
8 Indian Institute of Technology Kharagpur IND 674 266 0.36 58 United States Air Force Academy USA . 473 0.25
9 Emory University USA 90 203 0.35 59 Western Sydney University AUS 516 321 0.25
10 Indian Institute of Technology Guwahati IND 969 154 0.34 60 Australian Catholic University AUS 1176 57 0.25
11 Indian Institute of Technology Bombay IND 587 136 0.34 61 Middlebury College USA 1947 443 0.25
12 Indian Institute of Technology Roorkee IND 788 218 0.33 62 Tokyo University of Science JPN 654 27 0.25
13 California Institute of Technology USA 11 220 0.33 63 Santa Clara University USA 1125 1509 0.25
14 Columbia University in the City of New York USA 6 451 0.33 64 Cornell University USA 14 334 0.25
15 Waseda University JPN 168 92 0.33 65 Rice University USA 109 661 0.25
16 United States Naval Academy USA 1220 985 0.32 66 United States Merchant Marine Academy USA . 94 0.25
17 Cooper Union for the Advancement of Science and Art USA . 122 0.32 67 Vanderbilt University USA 46 56 0.25
18 Williams College USA 1295 335 0.32 68 Sciences Po FRA 618 38 0.24
19 The University of Tokyo JPN 13 41 0.32 69 Technion – Israel Institute of Technology ISR 111 413 0.24
20 The Interdisciplinary Center ISR . 26 0.31 70 The Business School GBR . 85 0.24
21 University of Canberra AUS 1087 108 0.31 71 École Polytechnique de Montréal CAN . 27 0.24
22 The University of Sydney AUS 100 584 0.31 72 Macquarie University AUS 371 444 0.24
23 Brown University USA 45 963 0.31 73 Amherst College USA 458 314 0.24
24 University of Chicago USA 10 113 0.31 74 Flinders University AUS 509 45 0.24
14
25 Indraprastha Institute of Information Technology IND . 26 0.31 75 The University of Queensland AUS 115 449 0.24
26 Carnegie Mellon University USA 84 1576 0.31 76 Washington and Lee University USA 1356 233 0.24
27 Dartmouth College USA 49 965 0.31 77 Hadassah Academic College ISR . 27 0.24
28 Universität Hamburg DEU 176 35 0.31 78 University of Notre Dame USA 140 1833 0.24
29 Netaji Subhas University of Technology IND . 250 0.31 79 University of Tasmania AUS 408 105 0.23
30 University of Michigan-Ann Arbor USA 17 354 0.30 80 University of California-Berkeley USA 8 8856 0.23
31 Southern Cross University AUS 1409 88 0.30 81 Colgate University USA 856 678 0.23
32 The University of Melbourne AUS 64 601 0.30 82 Monash University AUS 102 1018 0.23
33 Claremont McKenna College USA 1036 301 0.30 83 Stevens Institute of Technology USA 1027 551 0.23
34 Harvey Mudd College USA . 184 0.30 84 Barnard College USA . 389 0.23
35 St. Louis College of Pharmacy USA . 42 0.30 85 Haverford College USA 1155 220 0.23
36 Copenhagen Business School DNK 1098 82 0.30 86 Rose-Hulman Institute of Technology USA . 466 0.23
37 Australian National University AUS 108 206 0.29 87 University of Waterloo CAN 179 1906 0.23
38 Washington University in St Louis USA 41 72 0.29 88 Yeshiva University USA 229 246 0.22
39 Technical University of Munich DEU 76 41 0.29 89 The London School of Economics and Political Science GBR 293 367 0.22
40 Yale University USA 12 58 0.28 90 Freie Universität Berlin DEU 71 43 0.22
41 United States Military Academy USA 1009 991 0.28 91 Wesleyan University USA 707 637 0.22
42 Cranfield University GBR 804 26 0.28 92 Dhirubhai Ambani Institute of Information and Communication Technology IND . 116 0.22
43 Georgetown University USA 203 111 0.28 93 College of the Holy Cross USA 893 500 0.22
44 Tufts University USA 94 1244 0.28 94 Pomona College USA 1054 336 0.22
45 The University of New South Wales AUS 113 666 0.28 95 La Trobe University AUS 529 210 0.22
46 Charles Sturt University AUS 1025 137 0.28 96 Massachusetts Maritime Academy USA . 134 0.22
47 University of Technology Sydney AUS 463 329 0.27 97 Yonsei University KOR 161 241 0.21
48 Samuel Merritt University USA . 49 0.27 98 Lehigh University USA 449 1226 0.21
49 Kyoto University JPN 21 26 0.27 99 Indian Institute of Technology Madras IND 600 154 0.21
50 University of Copenhagen DNK 39 44 0.26 100 Griffith University AUS 379 237 0.21
Notes: Table displays the one-hundred schools with the highest estimated quality ranking in descending order, along with the country where it is located, its place in the the Center for
World University Rankings, the number of students in our sample, and the estimated quality. School quality is normalized relative to The University of Texas at Austin.nation’s top five colleges, or the average quality of its top five percent of colleges. Top
colleges are based on nation-specific CWUR rankings, which include only colleges ranked
in the global top 2000. To convert absolute rankings to percent rankings, we normalize by
the total number of colleges by country from World Higher Education Database (2021).
We exclude countries with fewer than twenty total colleges when calculating the top five
percent. The resulting estimates of top college quality are plotted against PPP GDP per
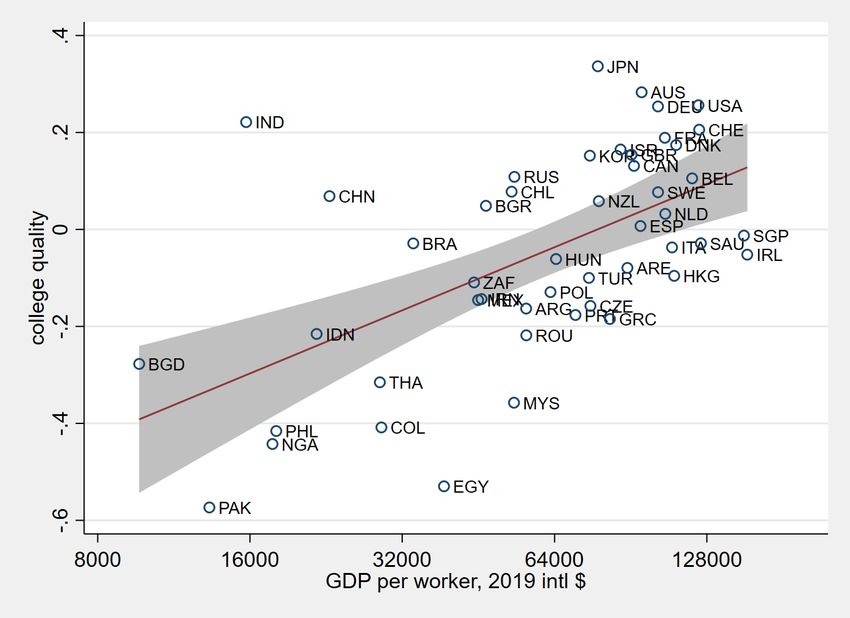
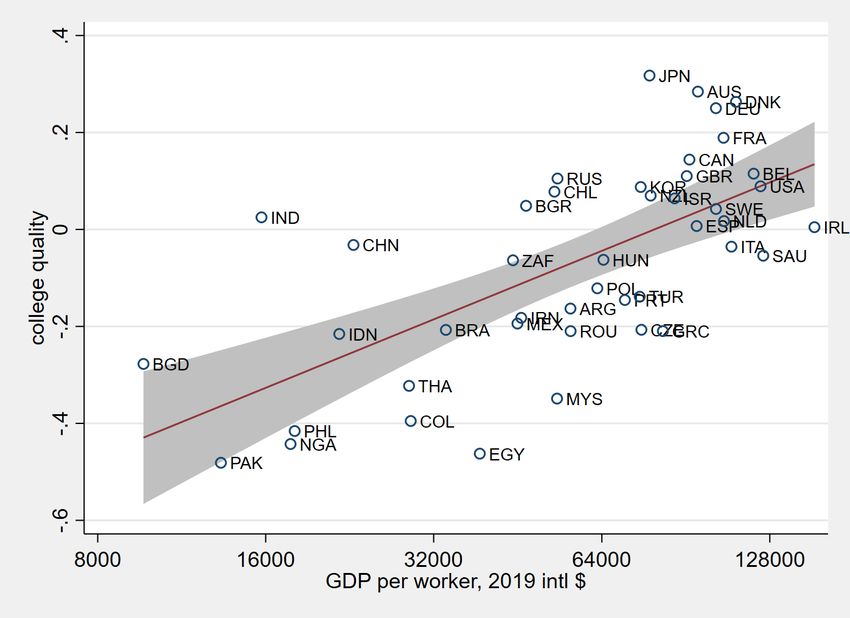
worker in Figure 2.
The key insight from this plot is that higher GDP per worker is associated with bet-
ter college quality. Again, the effect is economically and quantitatively significant. The
regression line indicates that top universities in the richest countries have college qual-
ity about 50 log points higher than top universities in the poorest countries, indicating
that graduates from rich nations’ top universities earn 65 percent more in the same labor
market. The overall trend relationship is similar whether we use the top five percent of
colleges (Figure 2a) or the top five colleges (Figure 2b). The top five ranking shows a
pronounced size advantage, which benefits large nations with many colleges (e.g., India,
China, and the United States). With this in mind, we focus on percent rankings for the
remainder of the paper.
Figure 2: Returns to Nations’ Top Colleges
(a) Relative national ranking (Top 5%) (b) Absolute national ranking (Top 5)
Notes: Figures plot the average estimated quality among the top five percent (left panel) or top five (right panel) of a country’s colleges
(based on Center for World University Rankings) against PPP GDP per worker from World Bank (2020) in log scale.
This first finding is quantitatively consistent with the broader literature on cross-
country differences in human capital. For example, Schoellman (2012) estimates overall
education quality by country using Census data for the United States. His findings imply
an elasticity of overall education quality with respect to development of 0.19. The slope
of the regression line in Figure 2a corresponds to an elasticity of 0.20, a strikingly similar
15number.
An advantage of our work relative to Schoellman (2012) is that we estimate the quality
of specific colleges rather than assuming that each country has a single education quality.
We utilize this fact to estimate for the first time how the distribution of college quality
varies with development. To do so, we split each country’s colleges into various per-
centile ranges based on CWUR rankings and regress their quality against log GDP per
worker. The resulting elasticity of college quality with respect to development for each
bin is shown in table 5. The estimates are consistently large and quite stable. For example,
the elasticity of the quality of the top two percent, top five percent, and top twenty-five
percent are all around 0.20. The elasticity of the quality of unranked colleges is only mod-
estly smaller, at 0.169.
These results suggest that the entire distribution of college quality is shifted left in de-
veloping countries. At first glance, these results may appear inconsistent with the result
from the previous subsection that developing countries possess some of the world’s top
colleges. The key to reconciling the two results is to note that large developing countries
have a handful of world-class colleges but also have other colleges at the top of their na-
tional rankings that do not score nearly so well and drag down the average. For example,
India has 812 colleges; the top five percent for India consists of 41 colleges, mixing the
IITs with other, less-renowned colleges.
We also explore whether developing countries have a comparative advantage in par-
ticular subjects by estimating separately college quality for STEM fields, business/social
science fields, and other fields. We find that STEM graduates systematically earn more
than business/social science graduates, who in turn earn more than graduates of other
fields. However, the magnitude of this effect appears fairly common across countries (see
figure A1).
In summary, developing countries seem to have uniformly worse college quality, which
accounts for about one-fifth of cross-country income differences. Alternatively, college
quality accounts for about one-third of cross-country differences in human capital per
Table 5: Top Percent Colleges within Countries and GDP per worker
Top 2% Top 3–5% Top 5% Top 5–10% Top 10–25% Top 25% Unranked
Log(gdppw) 0.217∗∗∗ 0.209∗∗∗ 0.204∗∗∗ 0.242∗∗∗ 0.207∗∗ 0.202∗∗∗ 0.169∗∗∗
(0.046) (0.047) (0.036) (0.049) (0.080) (0.033) (0.037)
N 35 33 44 34 27 48 36
Adjusted R2 0.39 0.37 0.42 0.41 0.18 0.43 0.37
Notes: Table displays estimated coefficient from regressing the average quality of a country’s colleges in the respective group on the
log of PPP GDP per worker from World Bank (2020). Percentile bins based on based on Center for World University Rankings. N is
number of countries.
16worker, given the finding that the elasticity of human capital with respect to GDP per
worker is 0.6 (Hendricks and Schoellman, 2018). Finally, these findings are consistent
with recent work that finds that developing countries appear to be scarce in the quality as
well as the quantity of skilled workers (Jones, 2014; Okoye, 2016; Rossi, 2020; Hendricks
and Schoellman, 2021).
4.3 College Quality and Top Talent
Our measure of college quality captures the earnings of each college’s graduates by con-
struction. In this section we show that it also captures the ability of the college to produce
talented graduates who become entrepreneurs or innovators. We measure entrepreneurs
as CEOs of S&P 500 firms and innovators as Nobel Laureates (in Physics, Chemistry,
Medicine, and Economics) or holders of patents. All patenting data are derived from
patents granted by the U.S. Patent and Trademark Office and S&P firms are American, so
we analyze the results separately for American and non-American colleges.
We start with the relationship between college quality and entrepreneurship or inno-
vation among U.S. colleges. Bell et al. (2019) provide data on the share of students at each
college who are granted patents, the number of patents by college, and the number of
citations to patents by college. Data cover colleges with more than ten patents granted
among students in the 1980–1984 birth cohorts; see their paper for further details. Details
on other outcomes are available in Appendix D.
We merge these measures of the number of innovators and entrepreneurs graduating
from each college with our measure of college quality. We regress the share of student
inventors, the log of (one plus) the number of patents or citations, the number of No-
bel laureates, and the number of CEOs on college quality. We use a censored regression
specification and report marginal effects for the number of Nobel laureates and CEOs to
account for the fact that there are a substantial number of zeros in the data. The results are
shown in table 6. College quality is a statistically significant predictor of each outcome,
as shown in the first row. We also report the mean of each outcome and the standard de-
viation of college quality in the United States to give a sense of magnitudes. The implied
economic significance is large. For example, a one standard deviation increase in college
quality corresponds to 50 percent more patents, 0.15 more Nobel laureates, and 0.3 more
CEOs of S&P500 companies.11
We now turn to results for non-American colleges. We start with results at the country
level. They allow us to address whether countries with high-quality colleges have more
11 Calculated as exp(3.008 × 0.15) = 1.57, 0.991 × 0.15 = 0.15, and 1.994 × 0.15 = 0.30, respectively.
17Table 6: College Quality and Notable Achievements, U.S. Colleges Only
Share
student Log Log Nobel S&P500
inventors patents+1 cites+1 prizes CEOs
College quality 0.050∗∗∗ 3.008∗∗∗ 2.774∗∗∗ 0.991∗∗∗ 1.994∗∗∗
(0.006) (0.655) (0.411) (0.148) (0.128)
Mean outcome 0.011 4.188 3.928 0.088 0.259
Std. dev. college quality 0.15 0.15 0.15 0.15 0.15
N 326 326 326 1554 3108
Notes: Table relates our measure of college quality to notable achievements across U.S. colleges. The former three dependent variables
and the set of colleges for which such data are available are from Bell et al. (2019). Estimates for the former three dependent variables
from standard OLS, while estimates for Nobel prizes and S&P500 CEOs reflect marginal effects from Tobit specifications. For S&P500
CEOs, data for 2005 and 2020 are stacked into a single regression that includes a dummy variable for 2005 observation. For further
details on the latter two dependent variables, see Appendix D.
entrepreneurs and innovators. An obvious confounding factor is that countries with high-
quality colleges tend to be richer, so we control for GDP per worker throughout. We
use the same outcomes as for Americans, except that we now rely on total U.S. patents
filed by foreign nationals by country from the U.S. Patent and Trademark Office rather
than patents by college (which are not available for non-American colleges). We divide
outcomes by the population of the country to make results more comparable. We again
use a censored regression specification for the number of Nobel laureates and CEOs.
Table 7: Top College Quality and Notable Achievements Across Countries
Patents Nobel prizes S&P500 CEOs
per million persons per million persons per million persons
Log(gdppw) 642.551∗∗∗ 176.233 0.104∗∗∗ 0.047 0.038∗∗∗ 0.026∗∗
(195.660) (236.217) (0.032) (0.033) (0.011) (0.012)
Top 5% college quality 2288.935∗∗∗ 0.284∗∗∗ 0.066∗
(757.945) (0.099) (0.038)
Notes: Table relates top college quality to notable achievements looking across forty-three countries and excluding the United States.
Top 5% college quality reflects the average across our measure of college quality for the top 5% of colleges in each country according
to CWUR national rankings. Estimates for patents from standard OLS, while estimates for Nobel prizes and S&P500 CEOs reflect
marginal effects from Tobit specifications. For S&P500 CEOs, data for 2005 and 2020 are stacked into a single regression that includes
a dummy variable for 2005 observation. For further detail regarding each of the dependent variables, see Appendix D.
We first regress each outcome against GDP per worker. As shown in table 7, we verify
positive and statistically significant correlations for all three outcomes. We then regress
each outcome against GDP per worker and the average quality of the nation’s top five
percent of colleges. College quality is a statistically significant predictor of patents and
Nobel laureates. For these outcomes it also greatly reduces the magnitude and eliminates
18the significance of GDP per worker. For CEOs the results are more mixed: the point
estimate has the right sign and is economically large, but it is only marginally statistically
significant and reduces the estimated effect of GDP per worker by a smaller amount. This
result is consistent with the view that technical, codifiable, knowledge is more directly
linked to education quality, compared with managerial ability.
While patenting data are only available at a country level, we also know the number
of CEOs and Nobel laureates for each foreign college. For our final analysis we estimate
the relationship between college quality and these two measures at the college level. This
analysis gives us a larger sample size. It also allows us to sidestep the usual concern that it
is challenging to control for all plausible confounding factors in cross-country regressions.
To highlight this, we conduct the analysis using country fixed effects. The results are
shown in table 8.
Table 8: College Quality and Notable Achievements, Non-U.S. Colleges
Nobel prizes S&P500 CEOs in 2020
College quality 0.411∗∗∗ 0.376∗∗∗ 0.166∗∗∗ 0.223∗∗∗
(0.089) (0.103) (0.043) (0.054)
Country FE X X
Mean outcome 0.07 0.07 0.04 0.04
Std. dev. college quality 0.27 0.27 0.27 0.27
N 1318 1318 1318 1318
Notes: Table relates our measure of college quality to notable achievements across colleges outside the United States. Estimates reflect
marginal effects from Tobit specifications. For further details regarding the two dependent variables, see Appendix D.
This table shows that foreign graduates from higher-quality colleges are more likely
to win Nobel prizes or become CEOs in the United States. Further, this relationship is
similar if not stronger when we control for country fixed effects. Again, the economic
magnitudes are large. A college outside the United States that is one standard deviation
higher in our measure of quality has 0.1 more Nobel laureates and 0.06 more CEOs, when
the sample average for the outcomes are only 0.07 and 0.04. Put together, these results
suggest that high-quality colleges are disproportionately responsible for producing the
highly talented workers who become innovators and entrepreneurs. They further em-
phasize the importance of the heterogeneity in top college quality by country that we
document in Figure 2.
195 Sensitivity
In this section we investigate the sensitivity of our results to relaxing the assumptions we
made and details of our implementation. We focus throughout on our main result for the
elasticity of college quality with respect to development. We estimate the elasticity sepa-
rately for the top five percent of colleges and all other colleges to highlight any possible
impact on the distribution of quality. All results are presented in table 9. For example,
the first row shows that the baseline estimate for these two groups of colleges is 0.204 and
0.237, respectively.
We start by relaxing the four assumptions that underlie our approach as outlined in
Section 2. The first assumption is that labor markets are competitive, which allows us
to map earnings differentials (which we observe) into human capital differentials. Many
forms of non-competitive labor markets take the form of occupation premia (e.g., occu-
pational licensing) or firm premia (e.g., a premium to working for large or multinational
firms). Because the Glassdoor database includes information on occupation and firm,
we can explore the effect of controlling for fixed effects for each. The second and third
rows show that doing so changes the elasticity of college quality with respect to GDP per
worker very little.
The second assumption is that earnings are log-separable between country effects and
human capital, which in turn is decomposed into college quality and worker ability. We
relax this assumption by allowing for an interaction between college quality and the coun-
try effect in the earnings equation. The estimated coefficient on this interaction term
is negative and statistically significant (see Table A3), suggesting that graduates from
better colleges earn a smaller earnings premium in higher zc0 (richer) countries. This is
consistent with models that allow imperfect substitution between workers with different
skill levels. In these models, skilled workers are relatively abundant in richer countries
and so they earn a lower wage; recent work has provided additional evidence consistent
with such frameworks (Jones, 2014; Okoye, 2016; Rossi, 2020; Hendricks and Schoellman,
2021).12 As the fourth row shows, allowing for this effect changes our estimated relation-
ship elasticity very little.
Allowing workers of different types to be imperfect substitutes introduces relative
prices into the earnings equation. These relative prices would also appear in the earnings
equation for the first stage of our estimation procedure. In this case we use the earnings
change of migrants to estimate the change in zc0 + pι,c0 , where pι,c0 is the price of type ι
labor in c0 . We can then net off the effect of country effect and relative price in the second
stage, as long as the types of workers used in the first and second stage are suitably
12 We also explore specifications that allow for higher-order interactions and find similar results.
20You can also read