Effects of Dietary Carbohydrate Levels on the Growth and Glucose Metabolism of Juvenile Swimming Crab, Portunus trituberculatus
←
→
Page content transcription
If your browser does not render page correctly, please read the page content below
Hindawi
Aquaculture Nutrition
Volume 2022, Article ID 7110052, 15 pages
https://doi.org/10.1155/2022/7110052

Research Article
Effects of Dietary Carbohydrate Levels on the Growth and
Glucose Metabolism of Juvenile Swimming Crab,
Portunus trituberculatus

 Xiangsheng Zhang, Min Jin , Jiaxiang Luo, Shichao Xie, Chen Guo, Tingting Zhu,
 Xiaoying Hu, Ye Yuan, and Qicun Zhou
 Laboratory of Fish and Shellfish Nutrition, School of Marine Sciences, Ningbo University, Ningbo 315211, China

 Correspondence should be addressed to Min Jin; jinmin@nbu.edu.cn and Qicun Zhou; zhouqicun@nbu.edu.cn

 Received 8 October 2021; Accepted 23 November 2021; Published 1 February 2022

 Academic Editor: Liqiao Chen

 Copyright © 2022 Xiangsheng Zhang et al. This is an open access article distributed under the Creative Commons Attribution
 License, which permits unrestricted use, distribution, and reproduction in any medium, provided the original work is
 properly cited.

 This experiment was conducted to evaluate the effects of different carbohydrate levels on the growth performance, glycogen
 accumulation in tissue, enzyme activities, and expression levels of genes related to hepatopancreatic glucose and lipid
 metabolism and insulin signaling pathway in swimming crab, Portunus trituberculatus for 8 weeks. The results indicated that
 crabs fed with the 60.0 g kg-1 carbohydrate diet exhibited the highest final body weight (FBW), percent weight gain (PWG),
 and specific growth rate (SGR) among all treatments. FBW, PWG, and SGR significantly decreased when dietary carbohydrate
 levels exceeded 240.0 g kg-1. Light microscopy results showed that dietary excessive carbohydrate levels will lead to vacuole,
 hepatopancreatic tubule lysis, and lipid droplets in hepatopancreas. Expression levels of genes involved into glucose transport,
 glucose and lipid metabolism, and insulin-like metabolism in the hepatopancreas were significantly influenced by dietary
 carbohydrate levels. In general, the results of present study demonstrated that dietary optimal carbohydrate levels could not
 only improve PWG and SGR but also influence the expression of genes involved in glucose, lipid, and insulin-like metabolism.
 The optimal actual carbohydrate level was estimated to be 87.8-98.4 g kg-1 based on broken-line and second-order polynomial
 regression analysis between PWG against dietary carbohydrate levels for juvenile Portunus trituberculatus.

1. Introduction have shown that about 20 g kg-1 carbohydrate level in the
 feed formula is the most appropriate for crustaceans
As one of the three major nutrients, carbohydrates are pref- [13–16]. Excessive carbohydrate intake will reduce growth
erentially broken down when supplying energy to the body rate and affect glucose and lipid metabolism, resulting in
[1]. Providing adequate amounts of digestible carbohydrates high mortality [5, 17, 18]. Thus, it is important to determine
in diets formulated for aquatic species is important to avoid the appropriate carbohydrate level in order to reduce aqua-
the use of lipids and proteins as energy sources [1, 2], as well feed costs and improve growth performance.
as decrease ammonia excretion and water pollution [3]. In Carbohydrate provides the major part of energy in the
addition, appropriate levels of dietary carbohydrates can also diets for human and most farmed animals, and when cata-
reduce the cost of aquafeeds [4] and promote better growth bolised, available polysaccharides in different forms are
performance [5, 6]. Compared with mammals, such as mice completely hydrolyzed into glucose and absorbed by various
[7], pigs [8], and lambs [9], aquatic animals cannot effi- organs [1, 19]. Glucose is the major product of carbohydrate
ciently utilize carbohydrates [10], especially crustaceans digestion, although other monosaccharides, such as fructose,
[11]. In crustaceans, carbohydrates are not essential nutri- galactose, and xylose, may be present in small quantities [1].
ents because they only supply energy, which a crustacean Glucose is usually stored in the hepatopancreas and muscles
can obtain from proteins and lipids [12], while many studies in the form of glycogen [18]. Glycogen is a rapidly mobilized
2 Aquaculture Nutrition

short-term reserve fuel, which plays an important role in and the actual contents were 29.5, 83.9, 147.7, 200.7, 262.8,
maintaining the stability of hemolymph glucose. Glycogen and 321.5 g kg-1, respectively. Corn starch was proved to be
synthase (GS) is the rate-limiting enzyme for the synthesis the best carbohydrate source through another experiment
of glycogen from glucose [20]. However, excessive glycogen (unpublished) and it was used as the carbohydrate source
and lipid accumulation in the tissues may result in poor of this experimental diet (Table 1). All ingredients were
growth, weaken immunity, and ultimately cause death of ground into fine powder by ultrafine grinder. The micro-
crustaceans [21–23]. When fish or crustaceans go without components, such as vitamin mixture, mineral mixture,
food for long periods, it first consumes hepatopancreatic gly- sodium alginate, and various oil sources, were mixed using
cogen for energy, which is hydrolyzed into glucose by the progressive enlargement method firstly (premix the raw
glucose-6-phosphatase [18]. Since there is no glucose-6- materials with less than 100 g addition amount and then
phosphatase in muscle, muscle glycogen can only be broken mix with the large amount of raw materials). Extruding the
down into glucose through glycolysis or aerobic oxidation. plasmids of the raw materials through the extruder and the
Glycolysis is a series of reactions that decompose glucose granulator, respectively, two sizes of pellets (diameters
into pyruvate under the action of two key enzymes, glucoki- 2 mm and 4 mm) are produced, steamed for 30 min at
nase (GK) and hexokinase (HK). Moreover, glucose-6- 90°C, and finally air-dried to approximately 100.0 g kg-1
phosphatase (G6Pase), fructose-1,6-bisphosphatase (FBPase), moisture. The dried diets were sealed in vacuum-packed
and phosphoenolpyruvate carboxykinase (PEPCK) are the bags and stored at -20°C until used.
important rate-limiting enzyme of the gluconeogenesis path-
way [24, 25]. Meanwhile glucose metabolism is closely related 2.3. Feeding Trial and Experimental Conditions. Swimming
to lipid accumulation and synthesis, many previous studies crab juveniles were purchased from a local crab breeding
have confirmed that high carbohydrate diets can increase lipid farm (Xiangshan, Ningbo, China). Feeding trial was con-
deposition by pentose-phosphate pathway [6, 26, 27]. ducted in Ningbo Xiangshan Harbor Aquatic Seed Co. Ltd.
 Swimming crab, Portunus trituberculatus, widely distrib- Prior to the start of the feeding trial, healthy and the
uted in coastal seawater of China, South Korea, and Japan, similar-sized swimming crab juveniles were acclimated for
has become one of the most important culture crustacean 7 days and fed with a commercial diet (450 g kg−1 dietary
species [28]. Due to its rapid growth, delicious meat, rich protein and 80 g kg−1 crude lipid, Ningbo Tech-Bank Feed
nutrition, resilience to handling, and great market value Co. Ltd., Ningbo, China). The initial average weight of 180
and potential, swimming crab production in 2018 has swimming crab juveniles was 7:87 ± 0:03 g and randomly
reached up to 116,251 tons (China Fishery Statistical [29]). sorted into 180 individual rectangle plastic baskets (35 ×
However, in traditional aquaculture, swimming crabs cul- 30 × 35 cm) in three cement pools (6:8 × 3:8 × 1:7 m). There
ture mainly depended on trash fish and shellfish, which was a partition in the middle of each basket, which divided
may lead to water pollution and diseases outbreak [28, 30]. the basket into two equal sections. One section is filled with
Therefore, it is necessary to develop a suitable commercial sand 1/2 and used as a habitat. The other area is empty
aquafeed in order to promote the healthy, environmentally which is used as a feeding area. Each diet was randomly
friendly, and efficient modern farming of swimming crabs. assigned to three replicates, and each replicate had 10 plastic
So far, the studies focused on the nutritional requirements baskets that supported with a foam frame so that it does not
of key nutrients such as protein and lipid requirements of sink to the bottom. All plastic baskets were lined up in the
swimming crabs [28, 31, 32]. However, the effect of dietary cement pool and fixed them with a nylon rope to prevent
carbohydrate levels on growth and the regulation of glucose the plastic baskets from floating to the center of the pool.
digestion, absorption, transportation, and glucose anabolism All of the crabs were fed twice daily at 7:00 and 17:30,
and catabolism has not been studied in P. trituberculatus. respectively, and feeding about 1/5 of the total amount in
Therefore, the present study is aimed at determining the the morning and 4/5 of the total amount in the evening.
optimal carbohydrate supplementation and evaluated the Newly molted crabs were not fed for one day. Feces, uneaten
influence of different carbohydrate levels on the growth per- feed, and crab shells were removed, and about 30% of seawa-
formance, feed utilization, glucose metabolism enzyme ter in the cement pool was daily exchanged to maintain sea-
activity, and gene expression of key enzymes involved in glu- water quality. Furthermore, the amounts of uneaten
cose transport and insulin pathway in swimming crabs. complete pellets (crushed residue feeds are few, which can
 basically be not counted) and dead crabs were recorded,
2. Materials and Methods weighed, and calculated. In order to continuously supply
 oxygen, 12 air pipes connected to air stones were placed in
2.1. Ethics Statement. All experimental procedures were per- the cement pool for continuous aeration. During the exper-
formed in strict accordance with the Standard Operation imental period, the temperature of the cement pool was 27-
Procedures (SOPs) of the Guide for Use of Experimental 30.5°C, the salinity was 22.5-25.5 g l-1, pH was 7.3-8.0, and
Animals of Ningbo University. The experimental protocol ammonia nitrogen was lower than 0.05 mg L-1.
and procedures were approved by the Institutional Animal
Care and Use Committee of Ningbo University. 2.4. Sample Collection. At the end of the trial, the survival,
 final body weight (FBW), percent weight gain (PWG), spe-
2.2. Experimental Design. Six diets were designed to be 0.0, cific growth rate (SGR), and molting ratio (MR) were
60.0, 120.0, 180.0, 240.0, and 300.0 g kg-1 carbohydrate levels, measured. Hemolymph samples from six crabs in each
Aquaculture Nutrition 3

 Table 1: Ingredients and proximate composition of the experimental diets (g kg-1, dry matter).

 Dietary carbohydrate levels (g kg-1)
Ingredients (g kg-1)
 0 60 120 180 240 300
 a
Fish meal 280.0 280.0 280.0 280.0 280.0 280.0
Shrimp meala 30.0 30.0 30.0 30.0 30.0 30.0
Soybean meala 150.0 150.0 150.0 150.0 150.0 150.0
Soy protein concentratea 130.0 130.0 130.0 130.0 130.0 130.0
Poultry byproduct meala 20.0 20.0 20.0 20.0 20.0 20.0
Corn starch 0.0 60.0 120.0 180.0 240.0 300.0
Fish oila 15.0 15.0 15.0 15.0 15.0 15.0
Soybean oila 15.0 15.0 15.0 15.0 15.0 15.0
Soy lecithina 20.0 20.0 20.0 20.0 20.0 20.0
Choline chloride 5.0 5.0 5.0 5.0 5.0 5.0
Ca(H2PO4)2 10.0 10.0 10.0 10.0 10.0 10.0
Vitamin mixturea 5.0 5.0 5.0 5.0 5.0 5.0
Mineral mixturea 10.0 10.0 10.0 10.0 10.0 10.0
Sodium alginate 10.0 10.0 10.0 10.0 10.0 10.0
Cellulose 300.0 240.0 180.0 120.0 60.0 0.0
Proximate composition (g kg-1)
Moisture 97.4 92.1 85.7 93.5 98.8 92.0
Crude protein 428.4 428.0 428.1 429.3 421.9 422.6
Crude lipid 79.8 78.8 80.4 81.0 80.8 80.1
Ash 62.3 68.7 67.6 67.0 67.4 68.9
Crude fiber 306.4 249.3 190.5 127.5 68.3 10.9
NFEb 29.5 83.9 147.7 200.7 262.8 321.5
Gross energy (kJ g-1)c 13.62 14.62 15.82 16.82 17.67 18.82
a
 All raw materials are purchased from Tianbang Co., Ltd. bNitrogen − free extract = 100% − ðmoisture% + crude protein% + crude lipid% + ash% + crude
fiber%Þ. cEnergy = ðcrude protein% × 23:6 + crude lipid% × 39:50 + starch% × 17:2Þ/100.

replicate were taken from the pericardial cavity using 2 ml measured using assay kits (Shanghai Qiaodu Biological
syringes, sorted into 1.5 ml Eppendorf tubes at 4°C over- Technology Co., Ltd., China).
night, and centrifuged for 10 min at 3500 rpm (Eppendorf Briefly, moisture content was determined by drying the
centrifuge 5810R, Germany). Then, the supernatant was col- samples to a constant weight at 105°C. Crude protein
lected and stored at -80°C until analysis of serum biochemi- (N × 6:25) was determined via the Dumas combustion
cal index and carbohydrate metabolic enzyme activity. The methods with a protein analyzer (FP-528, Leco, USA). Crude
hepatopancreas from six same crabs after being taken blood lipid was determined by the ether extraction method using
were collected into two 2 ml Eppendorf tubes and four 1.5 ml Soxtec System HT (Soxtec System HT6, Tecator, Sweden),
Eppendorf tubes immediately, 2 ml Eppendorf tubes were and ash content was determined using a muffle furnace at
frozen in liquid nitrogen and stored at -20°C until analysis 550°C for 8 h. Lactic acid, pyruvate, insulin-like, and hypergly-
of composition, and the 1.5 ml Eppendorf tubes were stored cemic hormone were determined spectrophotometrically.
at -80°C for the gene expression, content of glycogen, and Lactic acid and pyruvate were determined by colorime-
ATP. The muscles from six same crabs were collected for try. Lactic acid uses NAD+ as the hydrogen acceptor. Lactate
composition analysis and content of glycogen. dehydrogenase promotes the dehydrogenation of lactic acid
 to produce pyruvate, which converts NDH+ into NADH.
2.5. Chemical Analysis. The proximate compositions in Among them, PMS transfers hydrogen to reduce NBT to a
experimental diets, whole body, hepatopancreas, and muscle purple color. The absorbance of the color is at 530 nm, and
were determined according to AOAC [33]. The total protein, the content of lactic acid has a linear relationship. Pyruvate
glucose, and triglyceride contents in hemolymph were is a product of anaerobic metabolism of sugar and is usually
assayed using an automatic biochemistry analyzer (Vitalab determined together with lactic acid.
Selectra Junior Pros, Netherlands). The contents of lactic Insulin-like peptide was determined by used double-
acid and pyruvate were determined using assay kits (Nanjing antibody one-step sandwich enzyme-linked immunosorbent
Jiancheng Bioengineering Institute, China). And the concen- assay (ELISA). Add the specimen, standard, and HRP-
trations of insulin-like and hyperglycemic hormone were labeled detection antibody to the precoated insulin-like
4 Aquaculture Nutrition

peptide antibody-coated microwells, incubate, and wash images were obtained under a microscope at 400 times
thoroughly. The color is developed with the substrate (Nikon Eclipse CI, Tokyo, Japan). Further measures, such
TMB. TMB is converted into blue under the catalysis of per- as area and number of hepatopancreatic B cell and number
oxidase and into the final yellow under the action of acid. of hepatopancreatic R cell, were calculated by ImageJ. In
The intensity of the color is positively correlated with the each of these indicators, 10 measurements were acquired
glucagon (GC) in the sample. Measure the absorbance (OD (n = 30) per tissue sample.
value) with a microplate reader at a wavelength of 450 nm
to calculate the sample concentration. Hyperglycemia hor- 2.8. RNA Extraction and Real-Time Quantitative PCR. RNA
mones were determined using the same method as insulin- extraction and PCR analysis completely referred to Yuan
like peptides and used hyperglycemic hormone antibodies. et al. [35]. RNA was extracted and reverse transcribed by
 TRIzol Reagent and HiScript RT SuperMix Reagent kit
2.6. Tissue Glycogen and Enzyme Activity Parameter Assays. (Vazyme, China), respectively. All specific primers and
The hepatopancreas samples need to be homogenized in ice housekeeping genes were designed by Primer Premier 5.0,
bath with 9 volumes (w/v) of normal saline and then centri- synthesized by BGI (Beijing Genomics Research Institute,
fugated at 3000 rpm for 10 min at 4°C (Eppendorf centrifuge Shenzhen, China), and verified to be usable (including those
5810R, Germany), and serum can be directly measured cited from other literature) (Table 2). In the present study,
according to the instructions. The alpha-amylase content the expression of genes related to hepatopancreatic glucose
in hepatopancreas and the activities of pyruvate kinase, lac- and lipid metabolism key enzymes and insulin signaling
tate dehydrogenase, and hexokinase in serum were analyzed pathway in swimming crab juveniles was studied. All gene
using assay kits (Nanjing Jiancheng Bioengineering Institute, expression data were expressed relative to the expression of
China). The contents of glycogen in muscles and hepatopan- the 0.0 g kg-1 carbohydrate level treatment. The fluorescence
creas and ATP in hepatopancreas also use assay kits (Nanjing data were normalized to β-actin and quantified by the 2−ΔΔCt
Jiancheng Bioengineering Institute, China) to determine method [36].
according to corresponding protocols.
 Alpha-amylase, pyruvate kinase, and lactate dehydroge-
nase were also determined by colorimetry. Amylase can be 2.9. Calculations and Statistical Analysis. The parameters
hydrolyzed into glucose, maltose, and dextrin by alpha- were calculated as follows: PWG ð%Þ = 100 × ðfinal body
amylase. When the substrate concentration is known and weight − initial body weightÞ/initial body weight, SGR ð%da
excessive, iodine solution is added to combine with unhy- y−1 Þ = 100 × Ln ðfinal body weight/initial body weightÞ/days,
drolyzed starch to form a blue complex, which can be calcu- Survival ð%Þ = 100 × final crab number/initial crab number,
lated based on the shade of blue starch content. Pyruvate can and MI ðdayÞ = total days spent molting/total molting times.
be catalyzed into PEP by pyruvate kinase in the presence of Data are presented as the means and standard errors of
ADP. Pyruvate can be catalyzed into lactic acid by lactate three replicates (n = 3) and analyzed by one-way ANOVA
dehydrogenase, which reacts with 2,4-dinitrophenylhydra- followed by Tukey’s multiple-range test. All statistical analy-
zine, which is brown-red in alkaline solution. ses were conducted using SPSS 16.0 for Windows.
 Hexokinase was determined by the UV method. Under For heat map visualisation analysis, all data were homog-
the catalysis of hexokinase, glucose 6-phosphate is synthe- enized and performed using the online programme Image
sized from glucose, and glucose 6-phosphate is dehydroge- GP (http://www.ehbio.com/ImageGP/index.php/).
nated to NADPH under the action of glucose 6-phosphate
dehydrogenase. NADPH has a characteristic absorption 3. Results
peak at 340 nm.
 Glycogen and ATP were determined by colorimetry. 3.1. Growth Performance, Survival, and Molting Ratio. The
Under the action of concentrated sulfuric acid, glycogen effects of different dietary carbohydrate levels on growth
can generate aldehyde derivatives and then react with performance, survival, and molting ratio of swimming crab
anthrone to generate blue compounds, which are colorimet- juveniles are presented in Table 3. Final body weight
rically compared with the standard glucose solution treated (FBW), percent weight gain (PWG), and specific growth rate
by the same method. ATP and creatine are catalyzed by cre- (SGR) are significantly influenced by dietary carbohydrate
atine kinase to generate creatine phosphate, which is deter- levels (P < 0:05). Crabs fed with the 60.0 g kg-1 carbohydrate
mined by the phosphomolybdic acid colorimetric method. level had the highest FBW, PWG, and SGR and that signifi-
 cantly decreased with dietary carbohydrate levels increasing
2.7. Tissue Section and Observation. All hepatopancreatic from 180.0 to 300.0 g kg-1. Based on broken-line and second-
slice samples were taken near from the heart of the crabs. order polynomial regression analysis between PWG against
Determinations of the hepatopancreas histology were proc- dietary carbohydrate levels, the optimal actual carbohydrate
essed as described by Liu et al. [34] with some modifications. levels were estimated to be 87.8-98.4 g kg-1 for juvenile
Briefly, hepatopancreas tissues were immediately immersed swimming crab (Figure 1). The molting interval (MI) of
in 4% tissue fixative (paraformaldehyde), then fixed (at least crabs fed with the 240.0 and 300.0 g kg-1 carbohydrate levels
24 h), trimmed, and dehydrated in ethanol. Subsequently, was significantly longer than the 240.0 and 300.0 g kg-1 car-
they were embedded in paraffin and cut into 4 μm sections bohydrate levels (P < 0:05). Survival among all treatments
and finally stained with hematoxylin and eosin (H&E); the had no significant differences (P > 0:05).
Aquaculture Nutrition 5

 Table 2: Real-time PCR primer sequences for analysis of gene expression in hepatopancreas of swimming crab.

 Primers
Gene names Access no.
 Forward (5 ′ -3 ′ ) Reverse (5 ′ –3 ′ )
gk AGGTGGACCAACACTCTCGC TCCAGCAAGCCACAGGTCTC XP_023223115
pk ACACCAAAGGACCCGAAATC ATGCCGCCATTCTCTACCTC ALK82311
hk TATGTGGCAGGAATCGTGTC GGAGTCTATCAGCAATGGCG ABO21409
g6pase ATGTGGACGCTGCTCTTCTG CACCATCCAAGTGGCATACC ALK82315
fbpase CAGAAGAAAATCCCTCACGC CCACATACTTCCCCTGACGA AMJ52089
pepck CGAGCCGCTACCCAAATA CGAAGTCGTCCTCGTTGA AAL78163
glut1 TGGTGCGGAACTCCAATCTA GAAGCCTATGCCGACAATGA AIT97017
glut2 CGATGGGAGCCTTGAGTTTT ACAGGATTCCAACCACGACC ALG65274
gsk AGGTGCTCCAGGATAAACGG ACACACCCAGCGAGTGAATG ASW35107
foxo CATAAGTTCTCGCCAGCCTC TAACCTTCAGGACACGGGAG XP_023216972
igf1r CACTCACCAGGAGCCCATCTA TCAGAGAGTTTCACAACCCGC XP_023716772
pi3k AGCCACCACTCGCTGAACA GGGATGGGACTCTGCTGAAG ADE44090
fas CTTCAATACCCACCAAACC CCTCAATGATGCCAGACAC Sun et al. [72]
acc TCTCAGGGCAACCTTACGCT CGGGAGGCAGTAACCATTCA Sun et al. [72]
srebp1 GTGATGTGTGCCTTGCGAGT CCAGGGTTCACCAGTGTAGT Sun et al. [72]
6pgd GGGTGGAACCTCAACTATGG CGATAGCCATCATAGAAAGCC Sun et al. [72]
g6pd TGAAAAGGTGAAGGTGCTGA CGGTGGAGTCATCAAGGTAAC Sun et al. [72]
cpt1 GCTTGCCTACTACCGACAC CCTTGGACATCTTACTGCTC Sun et al. [72]
cpt2 TGGGACAAGGTTTTGATAGGC TGGAGATGATGATGTGGTTGA Sun et al. [72]
tor TGTGGACATAGGGCAAACTG GACCGCTTCACCAAATCATC Zhan et al. [18]
s6k1 CGCCCCTCAGATTTCCAGT TCTCAGCCTTTGTGTGCG Zhan et al. [18]
akt GGACTACGAGGCACCAAGAA TGGACCACTTCATCACGCTC Zhan et al. [18]
β-actin GAAGTAGCCGCCCTGGTTGT GAATACCTCGCTTGCTCTGC Sun et al. [72]

Table 3: Growth performance, feed utilization, and molting rate of Portunus trituberculatus fed with different carbohydrate levels for 8
weeks.

 Dietary carbohydrate levels (g kg-1)
Parameters
 0 60 120 180 240 300
Initial body weight (g) 7:86 ± 0:03 7:92 ± 0:04 7:85 ± 0:05 7:87 ± 0:01 7:84 ± 0:03 7:87 ± 0:02
Final body weight (g) 69:38 ± 0:69bc 74:13 ± 2:00c 68:35 ± 2:87bc 70:47 ± 3:47bc 63:00 ± 3:94ab 58:31 ± 1:41a
Percent weight gain (%) 782:45 ± 11:76 836:68 ± 29:34 771:39 ± 40:25 795:11 ± 44:81 703:16 ± 50:00 640:65 ± 19:64a
 bc c bc bc ab

Specific growth rate (% day ) 3:76 ± 0:02bc
 -1
 3:86 ± 0:05c 3:73 ± 0:08bc 3:77 ± 0:09bc 3:58 ± 0:10ab 3:45 ± 0:05a
Survival (%) 90:00 ± 0:00 76:67 ± 6:67 76:67 ± 3:33 73:33 ± 6:67 83:33 ± 3:33 76:67 ± 3:33
Molting interval (day) 13:99 ± 0:05a 14:94 ± 0:19a 15:28 ± 0:20ab 15:30 ± 0:41ab 16:75 ± 0:55bc 16:98 ± 0:26c
Data are reported as the mean ± SEM of three replicates (n = 3). Means in each line with different superscript letters are significantly different (P < 0:05).

3.2. Proximate Composition in Whole Body, Hepatopancreas, 0.0 g kg-1 carbohydrate level exhibited the lowest glucose
and Muscle. Moisture, lipid, and protein contents in hepato- content (P < 0:05). Crabs fed with the 240.0 and 300.0 g kg-
 1
pancreas and muscles as well as moisture and protein con- carbohydrate levels had lower lactic acid content in serum
tents in the whole body had no significant differences than those fed with the other diets (P < 0:05). The hypergly-
(Table 4). However, crabs fed with the 0.0 g kg-1 carbohy- cemic hormone content in serum significantly increased
drate level had lower lipid content in whole body than those with dietary carbohydrate levels increasing from 0.0 to
fed with the other diets (P < 0:05). The ash content in whole 120.0 g kg-1 and then significantly decreased with further
body was significantly influenced by dietary carbohydrate increase of dietary carbohydrate levels (P < 0:05). However,
levels (P < 0:05). the total protein, triglyceride, and insulin-like contents had
 no significant differences among all diets (P > 0:05).
3.3. Hemolymph Biochemistry Parameters. The hemolymph
biochemistry parameters of crabs fed with different carbohy- 3.4. Glycogen, ATP, and Enzyme Activities in Hepatopancreas.
drate levels are presented in Table 5. Crabs fed with the As shown in Figure 2, crabs fed with the 240.0 and 300.0 g kg-1
6 Aquaculture Nutrition

 900 y = 0.9038x + 782.45
 R2 = 1
 850

 800
 Percent weight gain (%) y = –0.7903x + 891.04
 750 R2 = 0.8416

 700

 650

 600 y = –0.3424x2 + 5.1022x + 791.38
 Xopt = 63.9 Xopt = 74.5 R2 = 0.8983
 550

 500
 0 50 100 150 200 250 300 350
 Dietary carbohydrate levels (g kg –1)

Figure 1: Relationship of percent weight gain (PWG) and dietary carbohydrate levels of Portunus trituberculatus based on broken-line and
second-order polynomial regression analysis, where Xopt represents the optimal dietary carbohydrate level for the maximum PWG.

Table 4: Proximate composition in whole body, muscle, and hepatopancreas of Portunus trituberculatus fed with different carbohydrate
levels for 8 weeks (g kg-1, wet weight).

 Dietary carbohydrate levels (g kg-1)
Proximate composition (g kg-1)
 0 60 120 180 240 300
Whole body
Moisture 75.11±0.03 72.21±0.03 72.48±0.01 75.43±0.00 72.40±0.01 75.32±0.03
Protein 11.46±0.27 11.59±0.12 12.27±0.23 12.58±0.18 11.92±0.14 11.44±0.11
Lipid 1.38±0.08a 2.28±0.14b 1.95±0.06b 1.95±0.16b 2.08±0.10b 1.89±0.19b
Ash 9.19±0.13a 10.00±0.14b 10.17±0.08b 10.14±0.13b 9.16±0.21a 9.14±0.24a
Hepatopancreas
Moisture 72:68 ± 1:65 72:74 ± 1:25 75:44 ± 1:24 72:86 ± 1:47 72:99 ± 0:62 71:44 ± 0:98
Protein 11:58 ± 0:65 11:42 ± 0:27 11:23 ± 0:45 11:62 ± 0:57 10:94 ± 0:20 10:91 ± 0:21
Lipid 12:26 ± 0:43 12:28 ± 0:26 11:43 ± 0:12 11:71 ± 0:48 12:65 ± 0:50 13:05 ± 0:63
Muscle
Moisture 79:59 ± 0:19 79:59 ± 0:27 79:58 ± 0:88 79:86 ± 0:14 80:14 ± 0:19 80:15 ± 0:40
Protein 17:57 ± 0:17 17:50 ± 0:16 17:45 ± 0:12 17:15 ± 0:16 16:99 ± 0:41 17:22 ± 0:02
Lipid 0:99 ± 0:04 1:04 ± 0:14 0:89 ± 0:08 1:12 ± 0:11 1:03 ± 0:12 1:02 ± 0:03
Data are presented as the means ± SEM of three replicates (n = 3). Means in each line with different superscript letters are significantly different (P < 0:05).

carbohydrate diets had lower alpha-amylase activity in hepa- 3.5. Histopathological Analysis. Figure 4 shows the hepato-
topancreas than those fed with the low carbohydrate level diets pancreas histology of Portunus trituberculatus in different
(P < 0:05). The activities of pyruvate kinase, lactate dehydro- treatments. Many complete hepatopancreatic tubules with
genase, and hexokinase in serum were not significantly a structural feature of epithelial cells that included R (restzel-
affected by dietary carbohydrate levels (P > 0:05). Glycogen len) cell, B (blasenzellen) cell, F (fibrous) cell, hepatopan-
contents in muscle and hepatopancreas and carbohydrate creatic tubule lumen (Lu) structure, and striated border
were positively correlated, and crabs fed with the 300.0 g kg-1 (SB) have been observed. And, the 0.0 and 60.0 g kg-1 carbo-
carbohydrate diet exhibited the highest glycogen content hydrate level treatments had more B cells and fewer F cells.
among all treatments (Figure 3, P < 0:05). ATP content in The SB of the treatments with 240.0 and 300.0 g kg-1 carbo-
hepatopancreas significantly increased with dietary carbohy- hydrate levels was weakened, and the hepatopancreas
drate levels increasing from 0.0 to 60.0 g kg-1 and then tubules were severely lysed. Besides, the quantitative indica-
decreased with further increase of dietary carbohydrate levels tors of B and R cells are displayed that the number of B cell
(P < 0:05). was significantly decreased as well as the areas of B cell were
Aquaculture Nutrition 7

 Table 5: Hemolymph metabolites of Portunus trituberculatus fed with different carbohydrate levels for 8 weeks.

 Dietary carbohydrate levels (g kg-1)
Index
 0 60 120 180 240 300
 -1
Total protein (g l ) 28:35 ± 2:06 30:49 ± 0:45 29:45 ± 4:20 26:51 ± 2:31 23:47 ± 2:39 22:82 ± 3:75
Glucose (mmol l-1) 1:66 ± 0:02a 2:01 ± 0:05b 2:02 ± 0:12b 2:05 ± 0:04b 1:88 ± 0:09ab 1:86 ± 0:04ab
Triglyceride (mmol l-1) 0:06 ± 0:01 0:05 ± 0:01 0:04 ± 0:01 0:05 ± 0:01 0:05 ± 0:00 0:04 ± 0:00
Lactic acid (mmol l-1) 3:37 ± 0:19abc 3:78 ± 0:08c 3:83 ± 0:39c 3:72 ± 0:34bc 2:68 ± 0:22a 2:82 ± 0:35ab
Pyruvate (μmol ml-1) 0:13 ± 0:02ab 0:11 ± 0:01ab 0:08 ± 0:02a 0:07 ± 0:00a 0:20 ± 0:02b 0:15 ± 0:04ab
Insulin-like (mU l-1) 59:53 ± 3:52 61:53 ± 2:83 58:22 ± 0:86 67:75 ± 1:28 58:17 ± 1:77 60:97 ± 3:38
CHH (mU l-1) 128:92 ± 6:08a 172:80 ± 5:81bc 202:95 ± 4:45c 148:73 ± 5:64ab 141:48 ± 6:09ab 117:05 ± 6:95a
Data are presented as the means ± SEM of three replicates (n = 3). Means in each line with different superscript letters are significantly different (P < 0:05).
CHH: crustacean hyperglycemic hormone.

 100 50
 B
 -Amylase (U mgprot –1)

 Pyruvate kinase (U L–1)
 80 AB 40
 AB
 AB
 60 30
 A A
 40 20

 20 10

 0 0
 0 60 120 180 240 300 0 60 120 180 240 300

 500 20
 Lactate dehydrogenase (U L –1)

 Hexokinase (U mL –1)

 400
 15
 300
 10
 200
 5
 100

 0 0
 0 60 120 180 240 300 0 60 120 180 240 300

Figure 2: Effects of dietary carbohydrate levels on alpha-amylase activity in hepatopancreas and serum enzyme activities related to
carbohydrate metabolism in Portunus trituberculatus. Values are expressed as the means of three replicates. Means in each bar with
different superscript letters are significantly different (P < 0:05).
 Hepatopancreatic glycogen (mg g –1)

 20 B 6 200 C
 Muscle glycogen (mg g –1)

 AB A
 AB AB AB
 ATP (umol gprot –1)

 15 150 B
 A 4 AB
 AB AB AB AB
 10 A A 100 AB
 A
 2
 5 50

 0 0 0
 0 60 120 180 240 300 0 60 120 180 240 300 0 60 120 180 240 300

Figure 3: Effects of dietary carbohydrate levels on the glycogen contents in tissue and ATP in hepatopancreas for Portunus trituberculatus.
Values are expressed as the means of three replicates. Means in each bar with different superscript letters are significantly different (P < 0:05).
8 Aquaculture Nutrition

 D1 D2 D3

 D4 D5 D6

 Number of R cell (n/mm2)
 Number of B cell (n/mm2)

 1500 150 6000
 Areas of B cell ( m2)

 D C BC
 C C
 1000 BC 100 4000
 B
 B B AB
 AB AB A A A A
 500 50 2000
 A A
 0 0 0
 D1 D2 D3 D4 D5 D6 D1 D2 D3 D4 D5 D6 D1 D2 D3 D4 D5 D6

Figure 4: Effects of different dietary carbohydrate levels on hepatopancreas histological structure of Portunus trituberculatus. R: R
(restzellen) cell; B: B (blasenzellen) cell; F: F (fibrous) cell; Lu: lumen structure; SB: striated border. Areas of B cell, number of B cell, and
number of R cell are calculated. D1: 0.0 g kg-1 carbohydrate level; D2: 60.0 g kg-1 carbohydrate level; D3: 120.0 g kg-1 carbohydrate level;
D4: 180.0 g kg-1 carbohydrate level; D5: 240.0 g kg-1 carbohydrate level; D6: 300.0 g kg-1 carbohydrate level. Values were expressed as the
means of three replicates. Means in each bar with different superscript letters were significantly different (P < 0:05).

significantly reduced with carbohydrate levels increased The expression levels of genes related to glucose transport
(P < 0:05). Conversely, the number of R cell was significantly and glycogen synthesis in hepatopancreas of P. trituberculatus
increased, but a drop appeared in 240.0 and 300.0 g kg-1 car- fed with dietary carbohydrate levels are shown in Figure 6.
bohydrate levels (P < 0:05). The expression level of glut2 was not significantly influenced
 by dietary carbohydrate levels (P > 0:05); however, crabs fed
3.6. Relative Expression of Genes Related to Glucose and Lipid with 60.0 g kg-1 carbohydrate diet had the lowest expression
Metabolism in Hepatopancreas. The expression levels of level of glut1 and gsk among all treatments (P < 0:05).
genes involved in glycolysis and gluconeogenesis are pre- The expression levels of genes related to glucose and
sented in Figure 5. The expressions of pk, fbpase, and pepck lipid metabolism are presented in Figure 7. The expression
were significantly upregulated in crabs with the increase of levels of srebp1 and cpt1 significantly upregulated with
carbohydrate levels (P < 0:05); however, the expressions of increase of dietary carbohydrate levels (P < 0:05); however,
hk and g6pase were significantly downregulated with dietary crabs fed with the 0.0, 240.0, and 300.0 g kg-1 carbohydrate
carbohydrate levels increasing from 0.0 to 60.0 g kg-1, and diets exhibited higher expression levels of cpt2 and acc than
crabs fed with the 0.0 g kg-1 carbohydrate diet had higher those fed with the 60.0, 120.0, and 180.0 g kg-1 carbohydrate
expression levels of hk and g6pase than those fed with the diets (P < 0:05). Meanwhile, the expression levels of fas,
other diets (P < 0:05). Crabs fed with the 60.0 and 6pgd, and g6pd were significantly downregulated with die-
120.0 g kg-1 carbohydrate diets exhibited lower expression tary carbohydrate levels increasing (P < 0:05).
level of gk than those fed with the 0.0 and 240.0 g kg-1 carbo- The expression levels of genes related to insulin-like path-
hydrate diets (P < 0:05). way are showed in. Crabs fed with 60.0 g kg-1 carbohydrate
Aquaculture Nutrition 9

 5
 C

 Relative gene expression
 C B
 4

 3 BC
 B
 2 AB
 AB
 B B AB B AB B AB AB
 1 A AAB A
 A A AB A
 AA
 AA A
 AAAAA A AA
 0
 gk hk pk g6pase fbpase pepck

 0 180
 60 240
 120 300

Figure 5: The expression levels of genes related to glycolysis and gluconeogenesis in the hepatopancreas of Portunus trituberculatus fed with
dietary carbohydrate levels. Values are expressed as the means of three replicates. Means in each bar with different superscript letters are
significantly different (P < 0:05). gk: glucokinase; pk: pyruvate kinase; hk: hexokinase; g6pase: glucose-6-phosphatase; fbpase: fructose-1,6-
bisphosphatase; pepck: phosphoenolpyruvate carboxykinase.

 1.5
 Relative gene expression

 B B
 AB B B
 AB
 1.0
 AB AB AB AB
 A A
 0.5

 0.0
 glut1 glut2 gsk

 0 180
 60 240
 120 300

Figure 6: The expression levels of genes related to glucose transport and glycogen synthesis in the hepatopancreas of Portunus
trituberculatus fed with dietary carbohydrate levels. Values are expressed as the means of three replicates. Means in each bar with
different superscript letters are significantly different (P < 0:05). glut1: glucose transporter 1; glut2: glucose transporter 2; gsk: glycogen
synthase kinase.

 3 C
 Relative gene expression

 2 B
 B B B
 B AB B C B
 B B B AB AA B B BC
 1 AB A A A AB ABC AB AB
 AA A A A AB
 AAA AA
 AAAA
 0
 fas acc srebp1 cpt1 cpt2 6pgd g6pd

 0 180
 60 240
 120 300

Figure 7: The expression levels of genes related to glucose and lipid metabolism in the hepatopancreas of Portunus trituberculatus fed with
dietary carbohydrate levels. Values are expressed as the means of three replicates. Means in each bar with different superscript letters are
significantly different (P < 0:05). fas: fatty acid synthase; acc: acetyl-CoA carboxylase; srebp1: sterol regulator element-binding protein 1;
cpt1: carnitine palmitoyltransferase 1; cpt2: carnitine palmitoyltransferase 2; g6pd: glucose 6-phosphate dehydrogenase; 6pgd: 6-
phosphogluconate dehydrogenase.
10 Aquaculture Nutrition

 2.0

 Relative gene expression
 C
 BC B
 1.5 B B

 AB B B AB AB B
 B AB AB ABC
 1.0 B AB AB
 AB AB
 AB AB A
 AB
 AB
 AB A AB AB
 A
 A A
 A A
 0.5 A
 A

 0.0
 igf1r pi3k foxo akt tor s6k1

 0 180
 60 240
 120 300

Figure 8: The expression levels of genes related to insulin-like metabolism in the hepatopancreas of Portunus trituberculatus fed with
dietary carbohydrate levels. Values are expressed as the means of three replicates. Means in each bar with different superscript letters are
significantly different (P < 0:05). igf1r: insulin-like growth factor 1 receptor; pi3k: phosphoinositide-3-kinase; foxo: forkhead-box class O;
akt: protein kinases B; tor: target of rapamycin; s6k1: ribosomal protein S6 kinase1.

diet had the lowest expression levels of igf1r, pi3k, foxo, ak In the present study, although the energy of each diet in
Figure 8 t, tor, and s6k1 among all treatments (P < 0:05), and this experiment is not equal, the energy level of each feed in
the highest expression levels of igf1r, akt, and tor were this experiment can meet the requirements of normal
observed at crabs fed with 300.0 g kg-1 carbohydrate diet growth of P. trituberculatus from the perspective of growth
among all treatments (P < 0:05). performance. The MI of crabs fed with the 240.0 and
 300.0 g kg-1 carbohydrate levels was significantly longer than
3.7. Heat Map Visualisation Analysis of Glucose and Lipid other carbohydrate diets. It was well known that crustacean
Metabolism and Insulin-Like Metabolism. Heat map visuali- growth depends on the molting process [39]. However, high
sation was conducted to present the macroscopic effects of carbohydrate aquafeed affected the health of crabs [5] and
dietary carbohydrate levels on glucose, lipid, and insulin- extended its molting cycle, which may be one of the main
like metabolism of swimming crab (Figure 9). All data were reasons for the poor growth performance of crabs fed with
normalized with red color representing higher values and the 240.0 and 300.0 g kg-1 carbohydrate levels.
blue color representing lower values. The results clearly indi- Dietary excessive carbohydrate levels can lead to the
cated that lower values of activities and expression levels of accumulation of lipids in aquatic animals [6, 40, 41]. In the
genes resolved into glucose, lipid, and insulin-like metabo- present study, crabs fed with the diet without carbohydrate
lism were observed in crabs fed with the diets containing supplementation showed the lower lipid content in whole
60.0 and 120.0 g kg-1 carbohydrate. body than those fed with the other diets; however, lipid con-
 tent in muscle and hepatopancreas was not significantly
4. Discussion influenced by dietary carbohydrate levels. Many studies
 demonstrated that excessive glucose can synthesize more
In the present study, based on broken-line and second-order glycogen which is first consumed when the body supplies
polynomial regression analysis between PWG against die- energy [6, 18, 41]. In this study, the glycogen content in
tary carbohydrate levels, the optimal actual carbohydrate muscle and hepatopancreas significantly increased with
level was estimated to be 87.8-98.4 g kg-1 for juvenile Portu- increase of dietary carbohydrate levels. However, excessive
nus trituberculatus. Meanwhile, dietary 180.0 g kg-1 carbohy- glycogen accumulation can cause lipid deposition and tissue
drate level did not lead to growth inhibition, and the PWG damage, especially in hepatopancreas [10, 42]. It can be seen
and SGR significantly decreased with the further increase from the light microscope section in hepatopancreas that the
of dietary carbohydrate levels. In recent years, due to the number of R cell, which is a primary place in lipid deposition
high price of protein sources such as fish meal, aquafeed and storage [43, 44], significantly increased with the dietary
enterprises try to reduce feed cost from the perspective of carbohydrate levels increasing from 0.0 to 180.0 g kg-1; the
reducing feed protein content and increasing energy level, decrease of R cells at crabs fed with the 240.0 and
while carbohydrate is the cheapest energy source. For this pur- 300.0 g kg-1 carbohydrate diets may be caused by the severe
pose, many research results showed that about 180.0- lysis of hepatopancreatic tubules and the inability. The
200.0 g kg-1 of the carbohydrate content in the feed formula results also indicated that dietary excessive carbohydrate
is suitable for crustaceans, such as Pacific white shrimp (Lito- levels will lyse hepatopancreatic tubules. Meanwhile, in the
penaeus vannamei) [6, 37], Penaeus monodon (Fabricius) present study, dietary excessive cellulose might also lead to
[13], mud crab (Scylla serrata) [38], and Chinese mitten crab more vacuoles in the hepatopancreas, because crabs fed with
(Eriocheir sinensis) [15], without significantly reducing the the 0.0 and 60.0 g kg-1 carbohydrate diets had more B cells
growth efficiency. This was similar to our research results. than those fed with the other diets.
Aquaculture Nutrition 11

 gk 4

 hk

 pk

 g6pase

 fbpase

 pepck

 glut1
 3
 glut2

 gsk

 fas

 acc

 srebp1

 cpt1

 cpt2
 2
 6pgd

 g6pd

 igf1r

 pi3k

 foxo

 akt

 tor 1

 s6k1
 D0-1

 D0-2

 D0-3

 D6-1

 D6-2

 D6-3

 D12-1

 D12-2

 D12-3

 D18-1

 D18-2

 D18-3

 D24-1

 D24-2

 D24-3

 D30-1

 D30-2

 D30-3

Figure 9: Heat map analysis of gene expressions related to glucose and lipid metabolism, glucose transport, and insulin-like metabolism in
the hepatopancreas of Portunus trituberculatus fed with dietary carbohydrate levels. From dark blue to positive red, it represents the process
of gradual increase of gene expression. D0: 0.0 g kg-1 carbohydrate level; D6: 60.0 g kg-1 carbohydrate level; D12: 120.0 g kg-1 carbohydrate
level; D18: 180.0 g kg-1 carbohydrate level; D24: 240.0 g kg-1 carbohydrate level; D30: 300.0 g kg-1 carbohydrate level.

 Glycogen in tissue is synthesized from glucose in serum nase (HK) and pyruvate kinase (PK) are the key enzymes
or hemolymph. In this study, crabs fed with the diet without of glycolysis pathway; when the body consumes more energy
carbohydrate supplementation had the lowest glucose con- and the content of ATP in the cell decreases, related glyco-
tent in hemolymph. Starch needs to be digested and broken lytic enzymes are activated to accelerate the decomposition
down to glucose by alpha-amylase before entering the ani- of glucose for energy; when the ATP storage in the cell is
mal body. Alpha-amylase is the most important enzyme abundant, the glycolytic activity is correspondingly weak-
among many enzymes that digest carbohydrates [45]. In ened. In the present study, high carbohydrate groups had
the present study, crabs fed with the 60.0 g kg-1 carbohydrate higher pyruvate content and low carbohydrate levels led to
diet had higher alpha-amylase content in hepatopancreas lower lactic acid content. The lactate dehydrogenase and
than those fed with the 240.0 and 300.0 g kg-1 carbohydrate PK and HK activities in hepatopancreas were not signifi-
diets. Pyruvate can realize the mutual conversion of glucose, cantly influenced by dietary carbohydrate levels. Many stud-
lipids, and amino acids in the body through the acetyl CoA ies in fish indicated that dietary carbohydrate level has no
and tricarboxylic acid cycle which plays an important pivotal significant effect on the activity of HK enzymes [24, 48–50].
role in the metabolic connection of the three major nutrients In addition to carbohydrate metabolizing enzymes,
[1]. Pyruvate and lactic acid are converted into each other hormones are also a key factor in regulating glucose metabo-
under the action of lactate dehydrogenase [46, 47]. Hexoki- lism. In animals, insulin and glucagon are the key hormones
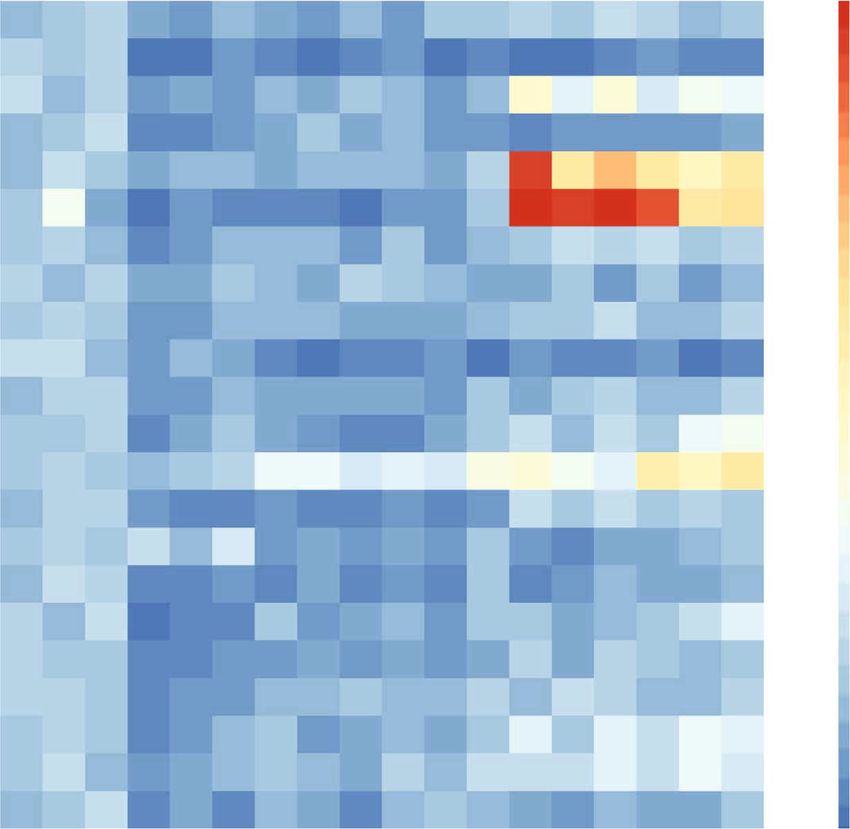
12 Aquaculture Nutrition

that regulate glucose metabolism [51]. For decades, it has been are G6Pase, FBPase, and PEPCK. In this study, the expres-
always believed that the regulation of blood glucose was con- sion of key gluconeogenesis enzyme genes, such as fbpase
trolled by only two of them; however, with the gradual deepen- and pepck, significantly increased with the increase of dietary
ing study, it has been found that the theory could not explain carbohydrate levels. Some studies in fish showed that exces-
the precise regulation of blood glucose homeostasis, and other sive carbohydrate levels can inhibit the gluconeogenesis
regulatory hormones such as growth hormone and leptin have pathway while promoting glycolysis [61]. Unlike fish, crabs
been identified [52, 53]. However, so far, there are only two seem to be able to upregulate the expression of key genes
main hormones, insulin-like peptides and hyperglycemia hor- such as glycolysis and gluconeogenesis with increase of die-
mones, participating in the regulation of glucose [54]. Similar tary carbohydrate levels.
to insulin function, injection of insulin-like peptide recombi- The process of lipid accumulation caused by increased
nant protein has the function of lowering hemolymph glucose carbohydrate levels will inevitably cause changes in the
in Chinese mitten crab, but the specific mechanism is expression of genes related to fatty acid synthesis pathways.
unknown [54]. Crustacean hyperglycemic hormone (CHH) Acetyl-CoA carboxylase (ACC) is a cytoplasmic enzyme that
is the only known hemolymph glucose-regulating hormone, can convert acetyl-CoA into malonyl-CoA, which is an
and type I CHH has the function of increasing hemolymph important substrate involved in fatty acid biosynthesis
glucose [54]. In this study, the insulin-like peptide content in [64]. Fatty acid synthase (FAS) is an important rate-
hemolymph had no significant difference among all treat- limiting enzyme that catalyzes the de novo synthesis of fatty
ments. The CHH content in hemolymph significantly acids and converts malonyl-CoA to saturated fatty acids
increased with dietary carbohydrate levels increasing from [65]. Sterol regulatory element-binding protein 1 (SREBP
0.0 to 120.0 g kg-1 and then significantly decreased with further 1) is a transcription factor-regulating fatty acid synthesis
increase of dietary carbohydrate level. The CHH content is [66]. 6-Phosphogluconate dehydrogenase (6PGD) and
similar to growth trend because CHH family, except type I glucose-6-phosphate dehydrogenase (G6PD) are key
CHH, has the effect of regulating the swelling of the outer epi- enzymes that regulate fatty acid biosynthesis [67]. Moreover,
dermis to assist in molting and participating in the growth of G6PD can also promote the occurrence of the pentose phos-
the body after molting [55]. phate pathway, which is considered to be the main pathway
 The main nutrient metabolism organ of crustaceans is of the molting interphase in decapod [68]. Fatty acids are
hepatopancreas, which plays an indispensable role in crusta- decomposed in the form of β-oxidation and enter the mito-
ceans [56]. Glucose derived from dietary carbohydrate is chondria with the assistance of carnitine palmitoyltransfer-
first absorbed by the hepatopancreas epithelial cells of crus- ase (CPT) for oxidation and energy supply. In this study,
taceans and then transported throughout the organism by the expressions of acc, srebp1, and g6pd significantly upreg-
hemolymph [4]. However, glucose cannot pass through the ulated with dietary carbohydrate levels increasing; however,
lipid bilayer of the hemolymph membrane; it must enter excessive carbohydrate levels upregulated mRNA levels of
the cell through the glucose transporter family (GLUTs) on cpt1 and cpt2.
the cell membrane. GLUT1 is a highly conserved protein The insulin-like growth factor (IGF) polypeptides are
in evolution, is responsible for the uptake of glucose into closely related to the metabolism of carbohydrates, and they
cells, and is the first glucose transporter family to be cloned can accelerate the synthesis of glycogen to reduce glucose
[57]. GLUT2 plays a key role in glucose signaling pathway content in the blood. Insulin-like peptides have a function
for insulin secretion and biosynthesis in cells [58]. In the similar to that of insulin in vertebrates in American lobsters
present study, the expression of glut1 significantly increased which can promote glycogen synthesis [69, 70]. Gutiérrez
with the increase of dietary carbohydrate levels, but the glut2 et al. [71] found that IGF may be involved in the regulation
expression in hepatopancreas was not significantly increased carbohydrate metabolism of Pacific white shrimp. Insulin-
by dietary carbohydrate levels. After glucose enters the body, like peptides and IGF belong to the same polypeptide family.
glycogen synthase (GS) plays a key role in the process of These studies showed that high carbohydrate can activate
glycogen synthesis and glycogen synthase kinase (GSK) reg- the insulin/IGF pathway. In this study, with the increase in
ulates the conversion of glucose to glycogen through phos- dietary carbohydrate levels, the expression of insulin-like
phorylation of glycogen synthase [59]. Thus, dietary higher growth factor 1 receptor (igf1r) significantly increased; mean-
carbohydrate levels enhanced the expressions of gsk in hepa- while, the expression of genes such as phosphoinositide-3-
topancreas. In addition to synthesizing glycogen, glucose can kinase (pi3k), forkhead-box class O (foxo), protein kinases B
also be decomposed into pyruvate under the glycolytic path- (akt), target of rapamycin (tor), and ribosomal protein S6
way. The three enzymes hk, gk, and pk are the key enzymes kinase1 (s6k1) significantly upregulated with increase of die-
in the glycolysis process, and their simultaneous expression tary carbohydrate levels. The results indicated that after the
promotes the occurrence of glycolysis. Many studies indi- insulin/IGF pathway was activated, the signal may transmit
cated that high carbohydrate levels can upregulate the from igf1r to the PI3K/AKT signaling pathway, which in turn
expression of glycolysis-related genes [54, 60, 61], which is stimulated foxo and tor, and the activation of the tor signaling
consistent with the results of this experiment. However, pathway affected the expression of s6k1. But the specific mech-
HK and GK are isoenzymes, and HK has poor specificity. anism has yet to be verified.
Some study indicated that the dietary carbohydrate level In conclusion, the results of present study indicated that
had no significant effect on the expression of hk [62, 63]. the optimal actual carbohydrate level was estimated to be
The key enzymes that regulate the gluconeogenesis pathway 87.8-98.4 g kg-1. The accumulation of glycogen in muscle
Aquaculture Nutrition 13

and hepatopancreas was positively correlated with dietary rich feed ingredients combined with chyme from pigs,”
carbohydrate levels. However, excessive glycogen content Archives of Animal Nutrition, vol. 64, no. 5, pp. 394–411, 2010.
will lyse the hepatopancreas tissue and lose its complete [9] E. S. Beltrão, A. M. de Azevedo Silva, J. M. P. Filho, T. P. Dias-
shape. Dietary carbohydrate levels could upregulate the Silva, and L. R. Bezerra, “Effect of different blend levels of
expression of genes related to glucose and lipid metabolism spineless cactus and Mombasa hay as roughage on intake,
and activate the insulin/IGF signaling pathway. digestibility, ingestive behavior, and performance of lambs,”
 Tropical Animal Health and Production, vol. 53, no. 1,
 p. 140, 2021.
Data Availability
 [10] B. S. Kamalam, F. Medale, and S. Panserat, “Utilisation of die-
The data used to support the findings of this study are tary carbohydrates in farmed fishes: new insights on influenc-
included within the article. ing factors, biological limitations and future strategies,”
 Aquaculture, vol. 467, pp. 3–27, 2017.
Conflicts of Interest [11] S. Julnafe and F. M. Rex, “Comparative evaluation of different
 carbohydrates as dietary energy source for the mud crab Scylla
The authors declare that they have no known competing serrata megalopa,” AACL Bioflux, vol. 10, no. 4, pp. 797–804,
financial interests or personal relationships that could have 2017.
appeared to influence the work reported in this paper. [12] A. S. Vinagre and R. Silva, “Effects of starvation on the carbo-
 hydrate and lipid metabolism in crabs previously maintained
 on a high protein or carbohydrate-rich diet,” Comparative Bio-
Acknowledgments chemistry and Physiology Part A, vol. 102, no. 3, pp. 579–583,
This research was supported by the National Natural Science 1992.
Foundation of China (32072987), the China Agriculture [13] V. R. Alava and F. P. Pascual, “Carbohydrate requirements of
Research System of MOF and MARA (CARS-48), the Penaeus monodon (Fabricius) juveniles,” Aquaculture,
 vol. 61, no. 3, pp. 211–217, 1987.
National Key R&D Program of China (2018YFD0900400),
the Key Research Program of Zhejiang Province of China [14] C. Rosas, G. Cuzon, G. Gaxiola et al., “Influence of dietary car-
(2018C02037), and the K. C. Wong Magna Fund in Ningbo bohydrate on the metabolism of juvenile Litopenaeus styliros-
 tris,” Journal of Experimental Marine Biology and Ecology,
University.
 vol. 249, no. 2, pp. 181–198, 2000.
 [15] X. Jiang, Study on the suitable carbohydrate source, protein-
References energy ratio and the digestibility and utilization rate of raw
 materials in Chinese mitten crab feed. [M.S. thesis], East China
 [1] National Research Council (NRC), Nutrient Requirements of
 Normal University, 2013.
 Fish and Shrimp, National Academies Press, Washington,
 DC, 2011. [16] L. F. Dong, T. Tong, Q. Zhang, and M. Z. Xu, “Effects of die-
 [2] M. S. Azaza, N. Khiari, M. N. Dhraief, N. Aloui, M. M. Kraem, tary carbohydrate level on growth performance, body compo-
 and A. Elfeki, “Growth performance, oxidative stress indices sition and digestive enzyme activities of juvenile crab, Scylla
 and hepatic carbohydrate metabolic enzymes activities of juve- paramamosain,” Acta Hydrobiologica Sinica, vol. 43, no. 2,
 nile Nile tilapia, L., in response to dietary starch to protein pp. 252–257, 2019.
 ratios,” Aquaculture Research, vol. 46, no. 1, pp. 14–27, 2015. [17] K. Deng, M. Pan, J. Liu et al., “Chronic stress of high dietary
 [3] G. I. Hemre and D. F. Deng, “Carbohydrates-chapter 4,” in carbohydrate level causes inflammation and influences glucose
 Dietary Nutrients Additives and Fish Health. Dietary Nutri- transport through _SOCS3_ in Japanese flounder _Para-
 ents, Additives, and Fish Health, C. S. Lee, C. Lim, D. M. Gatlin, lichthys olivaceus_,” Scientific Reports, vol. 8, no. 1, p. 7415,
 and C. D. Webster, Eds., pp. 95–110, Wiley Blackwell, 2015. 2018.
 [4] X. Wang, E. Li, and L. Chen, “A review of carbohydrate nutri- [18] Q. Zhan, T. Han, X. Li et al., “Effects of dietary carbohydrate
 tion and metabolism in crustaceans,” North American Journal levels on growth, body composition, and gene expression of
 of Aquaculture, vol. 78, no. 2, pp. 178–187, 2016. key enzymes involved in hepatopancreas metabolism in mud
 [5] X. F. Li, Y. Wang, W. B. Liu, G. Z. Jiang, and J. Zhu, “Effects of crab _Scylla paramamosain_,” Aquaculture, vol. 529,
 dietary carbohydrate/lipid ratios on growth performance, p. 735638, 2020.
 body composition and glucose metabolism of fingerling blunt [19] A. Van Wormhoudt and P. Favrel, “Electrophoretic character-
 snout breamMegalobrama amblycephala,” Aquaculture Nutri- ization of _Palaemon elegans_ (crustacea, decapoda) α amy-
 tion, vol. 19, no. 5, pp. 701–708, 2013. lase system: Study of amylase polymorphism during the
 [6] X. Wang, E. Li, J. G. Qin et al., “Growth, body composition, intermolt cycle,” Comparative Biochemistry & Physiology Part
 and ammonia tolerance of juvenile white shrimp Litopenaeus B, vol. 89, no. 2, pp. 201–207, 1988.
 vannamei fed diets containing different carbohydrate levels [20] E. Zeqiraj and F. Sicheri, “Getting a handle on glycogen syn-
 at low salinity,” Journal of Shellfish Research, vol. 33, no. 2, thase - Its interaction with glycogenin,” Molecular Aspects of
 pp. 511–517, 2014. Medicine, vol. 46, pp. 63–69, 2015.
 [7] M. G. Stronk and P. Margaret, “The influence of pertussis vac- [21] C. Xu, E. C. Li, Y. Liu et al., “Effect of dietary lipid level on
 cine on histamine sensitivity of rabbits and guinea pigs and on growth, lipid metabolism and health status of the Pacific white
 the blood sugar in rabbits and mice,” Journal of Infectious Dis- shrimp Litopenaeus vannamei at two salinities,” Aquaculture
 eases, vol. 96, no. 2, pp. 152–161, 1955. Nutrition, vol. 24, no. 1, pp. 204–214, 2018.
 [8] E. Bauer, B. A. Williams, C. Voigt, R. Mosenthin, and W. A. [22] C. Xu, E. C. Li, S. Liu, Z. P. Huang, J. G. Qin, and L. Chen,
 Verstegen, “In vitro fermentation of various carbohydrate- “Effects of α-lipoic acid on growth performance, body
You can also read