EICS-03-21 - APPENDIX A CLIMATE PROJECTIONS FOR BURLINGTON REGION - Appendix A of Report EICS-03-21 - Prepared by: City of Burlington, Town ...
←
→
Page content transcription
If your browser does not render page correctly, please read the page content below
Appendix A of Report EICS-03-21

EICS-03-21 - APPENDIX A CLIMATE
 PROJECTIONS FOR BURLINGTON
         REGION.DOCX

        Prepared by: City of Burlington, Town of Oakville and ICLEI Canada
                                                             January 2021
Table of Contents
   List of Figures............................................................................................................................... 3
   List of Tables ................................................................................................................................ 4
Glossary ........................................................................................................................................... 5
1.0 Introduction .............................................................................................................................. 8
2.0 Climate Variables ...................................................................................................................... 8
3.0 Climate Change Modelling and Downscaling ......................................................................... 12
4.0 Emissions Scenarios ................................................................................................................ 12
   4.1 Representative Concentration Pathway Scenarios ............................................................. 12
   4.2 Time Periods ........................................................................................................................ 14
   4.3 Uncertainty.......................................................................................................................... 15
5.0 Local Climate Trends and Projections ..................................................................................... 15
   5.1 Temperature........................................................................................................................ 16
      5.1.1 Mean Temperature....................................................................................................... 16
      5.1.2 Maximum and Minimum Temperature ........................................................................ 16
   5.2 Hot Weather ........................................................................................................................ 19
      5.2.1 Very Hot Days, Extremely Hot Days and Hot Season ................................................... 19
      5.2.2 Heat Waves and Tropical Nights................................................................................... 21
      5.2.3 Cooling Degree Days ..................................................................................................... 23
   5.3 Cold Weather ...................................................................................................................... 24
      5.3.1 Mild Winter Days and Winter Days .............................................................................. 24
      5.3.2 Frost Days and Icing Days ............................................................................................. 25
      5.3.3 Freeze-Thaw Cycles....................................................................................................... 26
      5.3.4 Heating Degree Days and Freezing Degree Days.......................................................... 27
   5.4 Precipitation ........................................................................................................................ 29
      5.4.1 Mean Precipitation ....................................................................................................... 29
      5.4.2 Dry Days and Wet Days................................................................................................. 30
      5.4.3 Heavy Precipitation....................................................................................................... 31
   5.5 Agriculture ........................................................................................................................... 33
      5.5.1 Frost Variables .............................................................................................................. 33
      5.5.2 Corn Heat Units............................................................................................................. 35

                                                                                                                                                    1
5.5.3 Growing Degree Days ................................................................................................... 35
   5.6 Extreme Weather Events .................................................................................................... 36
      5.6.1 Rainfall Intensity-Duration-Frequency ......................................................................... 36
           5.6.1.1 City of Burlington .................................................................................................. 36
           5.6.1.2 Town of Oakville ................................................................................................... 39
      5.6.2 Freezing Rain................................................................................................................. 41
      5.6.3 Wind Gusts.................................................................................................................... 41
   5.7 Lake Ontario ........................................................................................................................ 42
      5.7.1 Lake Levels .................................................................................................................... 42
      5.7.2 Lake Temperature......................................................................................................... 44
      5.7.3 Ice Cover ....................................................................................................................... 45
6.0 Conclusion ............................................................................................................................... 47
Appendix A: Summary of Local Climate Variables and Trends ..................................................... 49
Appendix B: Rainfall IDF Curves for the City of Burlington........................................................... 52
   Rainfall Intensity Rates - RCP4.5 (2021-2050)........................................................................... 53
   Rainfall Intensity Rates - RCP4.5 (2051-2080)........................................................................... 54
   Rainfall Intensity Rates - RCP8.5 (2021-2050)........................................................................... 55
   Rainfall Intensity Rates - RCP8.5 (2051-2080)........................................................................... 56
Appendix C: Rainfall IDF Curves for the Town of Oakville ............................................................ 57
   Rainfall Intensity Rates - RCP4.5 (2015-2065)........................................................................... 58
   Rainfall Intensity Rates - RCP4.5 (2045-2095)........................................................................... 59
   Rainfall Intensity Rates - RCP8.5 (2015-2065)........................................................................... 60
   Rainfall Intensity Rates - RCP8.5 (2045-2095)........................................................................... 61
References..................................................................................................................................... 62

                                                                                                                                                2
List of Figures
Figure 1: Map of Burlington Region ................................................................................................ 8
Figure 2: Global Temperature Change Relative to 1986-2005 for the RCP Scenarios Run by
Coupled Model Intercomparison Project (CMIP5) ....................................................................... 14
Figure 3: Annual Temperature for Burlington Region - RCP8.5.................................................... 18
Figure 4: Annual Number of Heat Waves for Burlington Region - RCP4.5 and 8.5 ...................... 22
Figure 5: Annual Tropical Nights for Burlington Region - RCP4.5 and 8.5.................................... 23
Figure 6: Icing Days for Burlington Region - RCP4.5 and 8.5 ........................................................ 26
Figure 7: Freeze-Thaw Cycles for Burlington Region - RCP4.5 and 8.5......................................... 27
Figure 8: Heating Degree Days for Burlington Region - RCP4.5 and 8.5....................................... 28
Figure 9: Freezing Degree Days for Burlington Region - RCP4.5 and 8.5 ..................................... 29
Figure 10: Annual Precipitation for Burlington Region - RCP4.5 and 8.5 ..................................... 29
Figure 11: Seasonal Precipitation for Burlington Region - RCP8.5 ............................................... 30
Figure 12: Heavy Precipitation Days for Burlington Region - RCP8.5 ........................................... 32
Figure 13: Max 1-Day and 5-Day Precipitation for Burlington Region - RCP8.5 ........................... 33
Figure 14: Length of Frost-Free Season for Burlington Region - RCP4.5 and 8.5 ......................... 34
Figure 15: Historical IDF Curve for the City of Burlington (1962-2016)........................................ 38
Figure 16: City of Burlington 2020 IDF curve ................................................................................ 39
Figure 17: Historic and Current IDF Curve for the Town of Oakville (1946-2007) ....................... 40
Figure 18: Annual Water Levels (2009-2019) Compared to the Baseline .................................... 43
Figure 19: Baseline Water Levels Compared to the Record-Breaking Lake Levels of 2017 and
2019............................................................................................................................................... 43
Figure 20: Summer Surface Water Temperature ( oC/year) (1994-2013) ..................................... 44
Figure 21: Time Series of Yearly Maximum Ice Cover in the Great Lakes (1973-2018) ............... 45
Figure 22: Seasonal Ice Cover Duration (days/year) (1973-2013) ................................................ 46
Figure 23: Projected Ice Conditions for Lake Ontario (2011-2100), based on RCP4.5 (top) and
RCP8.5 (bottom), including the Baseline Time-Period for Context .............................................. 47

                                                                                                                                                    3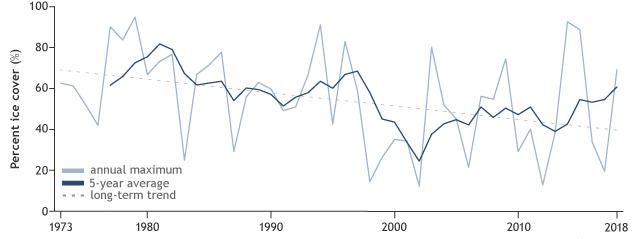
List of Tables
Table 1: Summary of Climate Variables .......................................................................................... 9
Table 2: IPCC Fifth Assessment Report Climate Change Scenario Characteristics ....................... 13
Table 3: Seasonal Timeframes ...................................................................................................... 15
Table 4: Mean Temperature for Burlington Region – RCP4.5 and 8.5 ......................................... 16
Table 5: Minimum Temperature for Burlington Region – RCP4.5 and 8.5................................... 17
Table 6: Maximum Temperature for Burlington Region – RCP4.5 and 8.5 .................................. 18
Table 7: Very Hot and Extremely Hot Days (30, 32 and 34°C) for Burlington Region - RCP4.5 and
8.5.................................................................................................................................................. 20
Table 8: Length of the Hot Season (30°C) for Burlington Region - RCP4.5 and 8.5 ...................... 20
Table 9: Annual Number of Heat Waves for Burlington Region - RCP4.5 and 8.5 ....................... 21
Table 10: Annual Average Length of Heat Waves for Burlington Region - RCP4.5 and 8.5 ......... 22
Table 11: Longest Spell of +30°C Days for Burlington Region - RCP4.5 and 8.5 ........................... 22
Table 12: Annual Tropical Nights for Burlington Region – RCP4.5 and 8.5 .................................. 23
Table 13: Cooling Degree Days for Burlington Region – RCP4.5 and 8.5 ..................................... 24
Table 14: Mild Winter Days (-5°C) for Burlington Region - RCP4.5 and 8.5 ................................. 25
Table 15: Winter Days (-15°C) for Burlington Region - RCP4.5 and 8.5........................................ 25
Table 16: Frost Days for Burlington Region - RCP4.5 and 8.5....................................................... 25
Table 17: Icing Days for Burlington Region - RCP4.5 and 8.5 ....................................................... 26
Table 18: Freeze-Thaw Cycles for Burlington Region - RCP4.5 and 8.5........................................ 27
Table 19: Annual and Seasonal Precipitation for Burlington Region – RCP4.5 and 8.5 ............... 30
Table 20: Number of Annual Wet Days for Burlington Region - RCP4.5 and 8.5 ......................... 31
Table 21: Number of Annual Dry Days for Burlington Region - RCP4.5 and 8.5 .......................... 31
Table 22: Heavy Precipitation Days for Burlington Region - RCP4.5 and 8.5 ............................... 32
Table 23: Maximum 1-Day and 5-Day Precipitation for Burlington Region- RCP4.5 and 8.5....... 32
Table 24: Length of Frost-Free Season for Burlington Region - RCP4.5 and 8.5 .......................... 34
Table 25: Date of First and Last Frost for Burlington Region - RCP 4.5 and 8.5 ........................... 35
Table 26: Corn Heat Units for Burlington Region - RCP4.5 and 8.5 .............................................. 35
Table 27: Growing Degree Days for Burlington Region - RCP4.5 and 8.5..................................... 36
Table 28: Historical Precipitation Intensity Rates (mm/h) for City of Burlington (1962-2016) .... 37
Table 29: City of Burlington 2020 IDF curve (mm/h) .................................................................... 38
Table 30: Historic and Current Precipitation Intensity Rates for the Town of Oakville (1946-
2007) ............................................................................................................................................. 40
Table 31: Percentage Increase in the Frequency of Future Daily and Hourly Wind Gust Events
from Current Conditions – A2 scenario ........................................................................................ 42

                                                                                                                                                      4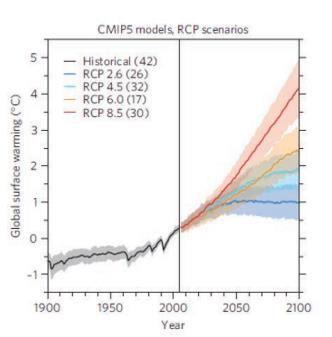
Glossary
The definitions below have been taken from the Intergovernmental Panel on Climate Change
(IPCC)i and Natural Resources Canada ii unless otherwise cited.

Baseline - A climatological baseline is a reference period, typically three decades (or 30 years),
that is used to compare fluctuations of climate between one period and another. Baselines can
also be called references, reference periods or climate normal.

Burlington Region – The geographic area identified as ‘030M05’ in Government of Canada’s
National Topographic System which includes the City of Burlington and most of the Town of
Oakville. All grid squares in the Climate Atlas of Canada are usually named after cities, towns or
landmarks within the area, to make it easier to identify where a grid square is located – in this
case Burlington Region. All the data associated with each grid is the average of all the climate
model grid points (which are 10 km x 10 km) within the grid square. iii

Climate Atlas of Canada – First launched in April 2018 and created by the Prairie Climate Centre
at the University of Winnipeg with financial support from Environment and Climate Change
Canada, Health Canada and others. It is an innovative climate science and communications tool
that allows users to visualize and interact with climate data as well as the human stories about
climate change and climate action on the landscape from coast to coast to coast. iv

Version 2 was released on July 10, 2019. Twenty-four different global climate models are used
along with advanced statistical techniques that preserve daily patterns in the global models to
downscale temperature and precipitation data to smaller geographical grids , as identified by
the Government of Canada’s National Topographic System, for two emission scenarios (RCP4.5
and RCP8.5).v Climate Atlas of Canada is often referred to as Climate Atlas in this report.

Climate Change - Changes in long-term weather patterns caused by natural phenomena and
human activities that alter the chemical composition of the atmosphere through the build-up of
greenhouse gases which trap heat and reflect it back to the earth’s surface, also known as the
greenhouse effect.

Climate Model – Models of varying complexity are used to represent the climate system. They
are used as a research tool to study and simulate the climate and for operational purposes,
including monthly, seasonal and interannual climate predictions. They are a numerical
representation of the climate system based on the physical, chemical and biological properties
of its components, their interactions and feedback processes and accounting for some of its
known properties. The data presented in this report is based on global climate models (GCMs).

Climate Projections - The simulated response of the climate system to a scenario of future
emission or concentration of greenhouse gases (GHGs) and aerosols, generally derived using
climate models.

                                                                                                 5
Coupled Model Intercomparison Project (CMIP) - A climate modelling activity from the World
Climate Research Programme coordinates and archives climate model simulations based on
shared model inputs by modelling groups from around the world. The CMIP3 multimodel data
set includes projections using Special Report on Emissions Scenarios (SRES) as used in the IPCC
Fourth Assessment Report (AR4). The CMIP5 data set includes projections using
the Representative Concentration Pathways (RCPs) as identified in the IPCC Fifth Assessment
Report (AR5).

Emissions Scenarios - A simplified representation of future climate based on comprehensive
scientific analyses of the potential consequences of anthropogenic climate change. It is meant
to be a plausible representation of the future emission amounts based on a coherent and
consistent set of assumptions about driving forces (such as demographic and socioeconomic
development and technological change) and their key relationships.

Ensemble Approach - A system that runs multiple climate models at once, to represent the
uncertainty associated with the modelling process. Research has shown that this provides a
more accurate projection of annual and seasonal temperatures and precipitation than a single
model would on its own. The Climate Atlas uses the mean or average of the 24 climate models.

Greenhouse Gas (GHG) - Those gaseous constituents of the atmosphere, both created by
natural and human activity, that absorb and emit radiation at specific wavelengths within the
spectrum of thermal (heat) infrared radiation, emitted by the Earth’s surface, the atmosphere
itself, and by clouds. Water vapour (H 2O), carbon dioxide (CO 2), methane (CH4), nitrous oxide
(N2O), ozone (O 3), and chlorofluorocarbons (CFCs) are the six primary greenhouse gases in the
Earth’s atmosphere in order of abundance. In addition, there are a number of entirely human-
made GHGs in the atmosphere.

Intergovernmental Panel on Climate Change (IPCC) - Created in 1988 by the World
Meteorological Organization and the United Nations Environment Programme, the objective of
the IPCC is to provide governments at all levels with scientific information that they can use to
develop climate policies. The IPCC currently has 195 members. Thousands of people from all
over the world contribute to the work of the IPCC. vi

Radiative forcing - The change in the value of the net radiative flux (i.e. the incoming flux minus
the outgoing flux represented as W/m2) at the top of the atmosphere in response to some
perturbation, in this case, the presence of greenhouse gases.

Representative Concentration Pathway (RCP) - Four greenhouse gas concentration trajectories
were adopted by the IPCC for its Fifth Assessment Report (AR5) vii in 2014 to simulate how
climate might change in response to different levels of human activity. It supersedes Special
Report on Emissions Scenarios (SRES) projections published in 2000. viii RCPs usually refer to the
portion of the concentration pathway extending up to the year 2100.

                                                                                                  6
RCP4.5 - Moderate projected GHG concentrations, resulting from substantial climate change
mitigation measures. It represents an increase of 4.5 W/m2 in radiative forcing to the climate
system. Climate Atlas of Canada and this report consider this pathway to be the ‘Low Carbon
Scenario.’

RCP8.5 - Highest projected GHG concentrations, resulting from business-as-usual emissions. It
represents an increase of 8.5 W/m2 in radiative forcing to the climate system. Climate Atlas of
Canada and this report consider this pathway to be the ‘High Carbon Scenario.’

Special Report on Emissions Scenarios (SRES) – SRES refers to the scenarios described in the
IPCC SRES.ix These scenarios are grouped into four scenario families (A1, A2, B1 and B2) that
explore alternative development pathways, covering a wide range of demographic, economic
and technological driving forces and resulting GHG emissions. These scenarios were used in the
Fourth Assessment Report (AR4) in 2007.x

                                                                                                  7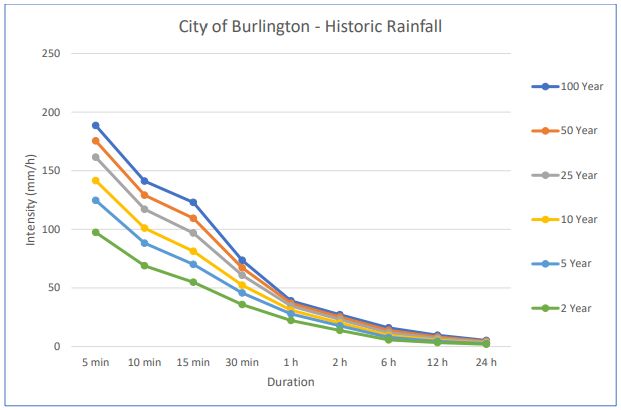
1.0 Introduction
The purpose of this report is to summarize climate projections for Burlington Region. It
presents how local climate has and is projected to change from the baseline timeframe of 1976-
2005 until predominantly 2080 for the climate variables listed in Table 1. This report is a
necessary first step towards the development of a climate adaptation plan. It will be used to
apply a climate lens to corporate and community master plans and programs to reduce
vulnerability and increase resiliency.

For consistency, this report uses terminology as identified in the Climate Atlas of Canada
including the term Burlington Region which encompasses both the City of Burlington and the
Town of Oakville as shown in Figure 1.

Figure 1: Map of Burlington Region

2.0 Climate Variables
The broad range of climate variables impacting Burlington Region are listed and defined in
Table 1. Definitions within the Temperature, Hot Weather, Cold Weather, Precipitation and
Agriculture categories were taken from the Climate Atlas of Canada (climateatlas.ca), including
the name and description of the climate variables.xi Definitions for the variables within the
Extreme Weather and Lake Ontario categories are taken from references sourced within
sections 5.6 and 5.7 below.

                                                                                              8
Table 1: Summary of Climate Variables
Category Climate Variable Description Unit
Temperature Mean The average temperature of the day. oC
Temperature
Minimum The lowest temperature of the day. oC
Temperature
Maximum The highest temperature of the day. oC
Temperature
Hot Weather Warmest The highest temperature of the year. oC
Maximum
Temperature
Number of Heat The total number of heat waves per year. A # of Heat
Waves heat wave occurs when at least three days in Waves
a row reach or exceed 30°C.
Average Length The average length of a heat wave. A heat Days
of Heat Waves wave occurs when at least three days in a
row reach or exceed 30°C so this number
will always be three or greater.
Longest Spell of The maximum number of days in a row with Days
+30oC Days temperatures 30°C or higher.
Hot (+30oC) Number of days per year when 30°C Days
Season temperatures can be expected.
Very Hot Days A day when the temperature rises to at least Days
(+30oC) 30°C.
Extremely Hot A day when the temperature rises to at least Days
Days (+32oC) 32°C.
Extremely Hot A day when the temperature rises to at least Days
Days (+34oC) 34°C.
Tropical Nights The lowest temperature of the day does not Nights
go below 20°C.
Cooling Degree Annual sum of the number of degrees # of oC
Days (CDD) Celsius that each day’s mean temperature is
above 18°C. It is a measurement designed to
quantify the demand for energy needed to
cool buildings.
Cold Freeze-Thaw Number of days when the air temperature Days
Weather Cycles fluctuates between freezing and non-
freezing temperatures.
Frost Days A day when the coldest or minimum Days
temperature is lower than 0°C.
Icing Days A day when the maximum temperature is at Days
or below 0°C.
9Category Climate Variable Description Unit
Coldest Minimum The very coldest temperature of the year. oC
Temperature
Heating Degree Annual sum of the number of degrees # of oC
Days (HDD) Celsius that each day’s mean temperature is
below 18°C. It is a measurement designed to
quantify the demand for energy needed to
heat a building.
Freezing Degree Annual sum of the number of degrees # of oC
Days (FDD) Celsius that each day’s mean temperature is
below 0oC.
Mild Winter Days A day when the temperature drops to at Days
(-5oC) least -5°C.
Winter Days A day when the temperature drops to at Days
(-15oC) least -15°C.
Precipitation Precipitation The total amount of rain, drizzle, snow, mm
sleet, etc. Frozen precipitation is measured
according to its liquid equivalent: 10 cm of
snow is usually about 10 mm of
precipitation.
Heavy A day on which at least a total of 10 mm of Days
Precipitation rain or frozen precipitation falls.
Days (10 mm)
Heavy A day on which at least a total of 20 mm of Days
Precipitation rain or frozen precipitation falls.
Days (20 mm)
Wet Days The number of days in a year with at least Days
0.2 mm of rain/snow.
Dry Days The number of days in a year with less than Days
0.2 mm of rain/snow.
Max 1-day The amount the precipitation that falls on mm
Precipitation the wettest day of the year.
(mm)
Max 5-day The wettest consecutive five-day period. mm
Precipitation
(mm)
Agriculture Frost-Free Season The approximate length of the growing Days
season (from the last spring frost to the first
fall frost), during which there are no freezing
temperatures to kill or damage plants.
Date of First Fall The first date in the fall or late summer Date
Frost when the daily minimum temperature is at
or less than 0oC. This date marks the
10Category Climate Variable Description Unit
approximate end of the growing season for
frost-sensitive crops and plants.
Date of Last The spring date after which there are no Date
Spring Frost daily minimum temperatures at or less than
0oC. This marks the approximate beginning
of the growing season for frost-sensitive
crops and plants.
Corn Heat Units A temperature-based index of growing- # of oC
(CHU) season heat to estimate whether the climate
is warm enough but not too hot to grow
corn.
Growing Degree Annual sum of the number of degrees # of oC
Days (GDD) (Base Celsius that each day’s mean temperature is
5oC) above 5oC. Generally, 5°C GDDs are used for
assessing the growth of canola and forage
crops.
Growing Degree Annual sum of the number of degrees # of oC
Days (Base 10oC) Celsius that each day’s mean temperature is
above 10°C. Generally, 10°C GDDs are used
for assessing the growth of corn and beans.
Growing Degree Annual sum of the number of degrees # of oC
Days (Base 15oC) Celsius that each day’s mean temperature is
above 15oC. Generally, 15°C GDDs are used
to assess the growth and development of
insects and pests.
Extreme Freezing Rain Average percentage change in the number %
Weather Events of annual freezing rain events.
Wind Gusts A relationship between the peak gust speed km/h
and mean wind speed.
Rainfall Intensity- The annual maximum rainfall intensity for mm/h
Duration- specific durations. Common durations are: 5-
Frequency (IDF) min, 10-min, 15-min, 30-min, 1-hr, 2-hr, 6-
hr, 12-hr, and 24-hr.
Lake Ontario Lake Levels Annual changes in lake water levels as m
compared to an average.
Lake Change in water temperatures, oC
Temperature predominantly summer surface water
temperatures.
Ice Cover Trend in ice coverage relative to a baseline. Days/year
113.0 Climate Change Modelling and Downscaling
Unless otherwise stated, the data presented in this report is based on global climate models
(GCMs) and emission scenarios defined by the Intergovernmental Panel on Climate Change
(IPCC), drawing from the Fifth Assessment Report (AR5) publications.
Many different methods exist to construct climate change scenarios. However, GCMs are the
most conclusive tools available for simulating responses to increasing greenhouse gas (GHG)
concentrations, as they are based on mathematical representations of atmosphere, ocean, ice
cap, and land surface processes. xii Wherever possible, the data presented in this report uses an
ensemble approach, which refers to a system that runs multiple climate models at once.
Research has shown that this provides a more accurate projection of annual and seasonal
temperatures and precipitation than a single model would on its own.
GCMs use grid cells often larger than 100 kilometres. To better understand local impacts and
vulnerabilities, climate data is often needed at a smaller resolution. To get finer resolution data,
climate modellers use dynamic or statistically downscaling methods. Dynamically downscaled
models, also known as regional climate models (RCMs), simulate the climate of a smaller region
(grid cells are usually 10 to 50 kilometres in size) and rely on information provided by GCMs.
Statistically downscaled models use statistical relationships between local climate variables
(such as precipitation) and large-scale variables (such as atmospheric pressure). The
relationship is then applied to projections from GCMs to simulate local climate.xiii The climate
model data presented in the Climate Atlas used a statistically downscaled method - specifically
the Bias-Correction/Constructed Analogues with Quantile mapping reordering, Version 2
(BCCAQv2) method which preserved daily patterns in the global climate models.xiv This work
was done by the Pacific Climate Impacts Consortium.
4.0 Emissions Scenarios
Emissions scenarios are based on models developed by a series of international climate
modeling centers. Each emission scenario presents a different possible future based on
socioeconomic storylines used by analysts to make projections about future GHGs and to assess
future vulnerability to climate change. Producing scenarios requires estimates of future
population levels, economic activity, the structure of governance, social values, and patterns of
technological change.
4.1 Representative Concentration Pathway Scenarios
Representative Concentration Pathways (RCPs) are the newest set of climate change scenarios
that provide the basis for the IPCC Fifth Assessment Report (AR5).xv The new RCPs have
replaced the Special Report on Emissions Scenarios (SRES) to be more consistent with new data,
new models, and updated climate research from around the world. The RCPs contain
12information regarding emission concentrations and land-use trajectories and are meant to be
representative of the current literature on emissions and concentration of GHGs. The premise is
that every radiative forcing pathway can result from a diverse range of socioeconomic and
technological development scenarios. xvi RCPs are identified by their approximate total radiative
forcing in the year 2100 relative to 1750, and are labeled as RCP2.6, 4.5, 6.0 and 8.5. These four
RCPs include one mitigation scenario leading to a very low forcing level (RCP2.6), two
stabilization scenarios (RCP4.5 and RCP6.0), and one scenario with continued rising GHG
concentrations (RCP8.5).xvii The RCPs also consider the presence of 21st century climate
policies, as compared with the no-climate policy assumption of the SRES in the Third and Fourth
Assessment Reports.xviii
For this report, projections will use RCP4.5 representing a moderate increase in projected GHG
concentrations and RCP8.5 representing the highest projected GHG concentration, as that data
is publicly available for many climate indicators. RCP8.5 is referred to as a ‘business as usual’
pathway, representing a future where regular economic growth continues with emissions
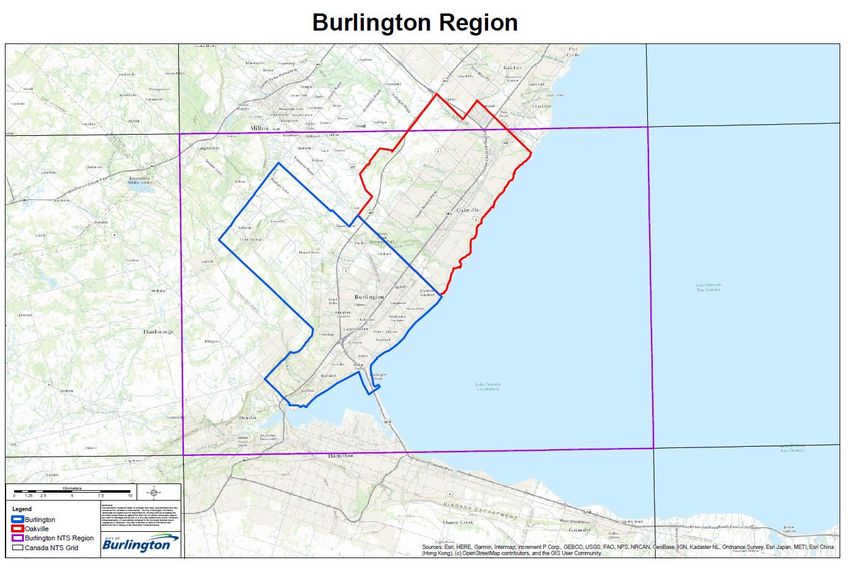
continuing to increase. Table 2 provides a description of each RCP scenario, while Figure 2
illustrates the projected global warming associated with the four scenarios. xix
Table 2: IPCC Fifth Assessment Report Climate Change Scenario Characteristics
Scenario Description Pathway CO2 Temp
equivalent anomaly
(ppm) (oC)
RCP2.6 Lowest projected GHG concentrations, Peak and ~490 1.5
resulting from dramatic climate change decline
mitigation measures implemented
globally. It represents an increase to 3.0
W/m2 mid-century and a decline to 2.6
W/m2 in radiative forcing to the climate
system by 2100.
RCP4.5 Moderate projected GHG concentrations, Stabilizing ~650 2.4
resulting from substantial climate change without
mitigation measures. It represents an overshoot
increase of 4.5 W/m2 in radiative forcing
to the climate system. The Climate Atlas
refers to this scenario as the ‘Low
Emissions Scenario.’
RCP6.0 Moderate projected GHG concentrations, Stabilizing ~850 3.0
resulting from some climate change without
mitigation measures. It represents an overshoot
13Scenario Description Pathway CO2 Temp
equivalent anomaly
(ppm) (oC)
increase of 6.0 W/m2 in radiative forcing
to the climate system.
RCP8.5 Highest projected GHG concentrations, Rising ~1370 4.9
resulting from business-as-usual
emissions. It represents an increase of
8.5 W/m2 in radiative forcing to the
climate system. The Climate Atlas refers
to this scenario as the ‘High Emissions
Scenario.’
Note that the number of models used is given in brackets and the shading (coloured envelopes)
represents all model results.
Figure 2: Global Temperature Change Relative to 1986-2005 for the RCP Scenarios Run by
Coupled Model Intercomparison Project (CMIP5)
4.2 Time Periods
Climatic projections are typically provided within time periods of 30 years. Additionally, a
consistent baseline period is established so that projections can be accurately compared with
historical trends. In this report, the time periods of 2021-2050 (immediate future) and 2051-
2080 (near future) are used most frequently as well as 1976-2005 for the baseline (recent past).
Many climate variables are also divided into seasonal timeframes, defined below in Table 3.
14Table 3: Seasonal Timeframes
Season Months
Winter December, January, February
Spring March, April, May
Summer June, July, August
Fall September, October, November
4.3 Uncertainty
While it is not possible to anticipate future climatic changes with absolute certainty, climate
change scenarios help to create plausible representations of future climate conditions. These
conditions are based on assumptions of future atmospheric composition and on an
understanding of the effects of increased atmospheric concentrations of GHGs, particulates,
and other pollutants. Uncertainty is factored into climate change scenarios, models, and data,
and reflects the complex reality of environmental change and the evolving relationship
between humans and the planet.
The Climate Atlas identified some important limitations with specific climate variables.
1. Precipitation is more difficult to model than temperature. However, longer-term
averages of monthly, seasonal and annual precipitation totals are produced with greater
confidence than point- or time-specific precipitation projections.
2. Heavy Precipitation Days are likely underestimated for frequency and intensity as
climate models likely don’t capture the intense, localized events such as thunderstorms.
However, there is greater confidence in longer-term averages of monthly, seasonal and
annual precipitation totals.
3. Daily Mean Temperature is often calculated taking the average of 24 individual hourly
measurements made in a day. However, since only daily maximum and daily minimum
temperatures were available, the Climate Atlas uses the averages of those.
4. Date of First Fall Frost, Last Spring Frost and Frost-Free Season are calculated using
standard weather station observations, which are usually at 1.2 m above the ground.
Since ground level temperature can be colder than surface air temperature (1.2 m), the
length of the Frost-Free Season presented is likely longer than the actual length of the
season at ground level.xx
5.0 Local Climate Trends and Projections
The Climate Atlas presents data related to climate change for Burlington Region under five
different categories: Temperature, Hot Weather, Cold Weather, Precipitation and Agriculture.
Within each category, multiple climate variables are presented under a low and high emissions
15scenario for different time periods compared to the baseline. Appendix A provides a summary
of local climate variables and trends in the five climatic categories under a high emissions
scenario.
Two additional categories – Extreme Weather and Lake Ontario – are also included in the
section below with information based on other sources and referenced accordingly.
5.1 Temperature
All temperature variables for Burlington Region are projected to experience warming for RCP4.5
and RCP8.5. Documenting general trends in temperature change can be helpful for
understanding the future distribution of ecological communities including invasive species
migration and vector-borne diseases, temperature-related morbidity (disease) and mortality
(death), cooling and heating requirements for buildings, and much more. xxi
5.1.1 Mean Temperature
Mean Temperature shows the average temperature in an area over a given period. As shown in
Table 4 below, the baseline seasonal Mean Temperature over Burlington Region was 6.8°,
20.3°, 10.5° and -3.4˚C for spring, summer, fall and winter respectively. This gives a year-round
average temperature of 8.6˚C for 1976-2005. According to RCP8.5, Burlington Region could
experience an increase of 4.2˚C in average annual temperature and 4.7˚C in average winter
temperature in the near future (2051-2080).
Table 4: Mean Temperature for Burlington Region – RCP4.5 and 8.5
Emissions Scenario Baseline 2021-2050 2051-2080
Period 1976-2005 (oC) (oC)
(oC) Low Mean High Low Mean High
RCP4.5 Spring 6.8 6.5 8.6 10.5 7.4 9.4 11.7
Summer 20.3 20.6 22.1 23.6 21.3 23.2 25.1
Fall 10.5 10.8 12.4 14.0 11.5 13.3 15.0
Winter -3.4 -3.8 -1.2 1.3 -2.7 0.0 2.6
Annual 8.6 9.3 10.5 11.8 10.0 11.5 13.1
RCP8.5 Spring 6.8 6.5 8.6 10.8 8.4 10.6 12.9
Summer 20.3 21 22.4 24 22.8 24.6 26.5
Fall 10.5 11 12.7 14.3 12.8 14.6 16.3
Winter -3.4 -3.5 -1 1.6 -1.3 1.3 4
Annual 8.6 9.4 10.7 12 11.4 12.8 14.4
5.1.2 Maximum and Minimum Temperature
Maximum and Minimum Temperature trends show the average high temperature and the
average low temperature for a given period.
16In terms of Minimum Temperature, Table 5 shows the baseline Minimum Temperature across
each season at 2.0°, 14.9°, 6.1° and -7.0°C for spring, summer, fall and winter respectively.
Seasonal Minimum Temperature is projected to increase substantially under RCP8.5, with an
increase of 3.6°C in spring, 4.0°C in summer, 3.9°C in fall and 5.2°C in winter by 2051-2080.
The increases in average Minimum Temperature in the summer and winter months are
particularly noteworthy. With the summer Minimum Temperature rising from an average of
14.9oC to 18.9oC, this could result in an increase of Tropical Nights which are described below.
In addition, with average winter Minimum Temperature rising from an average of -7.0oC to -
1.8oC, this could result in less snow and more mixed precipitation.
Table 5: Minimum Temperature for Burlington Region – RCP4.5 and 8.5
Emissions Scenario Baseline 2021-2050 2051-2080
Period 1976-2005 (˚C) (˚C)
(˚C) Low Mean High Low Mean High
RCP4.5 Spring 2.0 1.9 3.7 5.3 2.7 4.5 6.6
Summer 14.9 15.2 16.5 17.8 15.8 17.5 19.3
Fall 6.1 6.3 7.8 9.3 7.1 8.6 10.2
Winter -7.0 -7.4 -4.6 -2.0 -6.1 -3.3 -0.5
Annual 4.0 4.7 5.9 7.1 5.5 6.9 8.4
RCP8.5 Spring 2.0 1.9 3.8 5.8 3.7 5.6 7.8
Summer 14.9 15.6 16.8 18.2 17.4 18.9 20.6
Fall 6.1 6.6 8.1 9.6 8.3 10.0 11.5
Winter -7.0 -7.1 -4.4 -1.6 -4.6 -1.8 0.9
Annual 4.0 4.9 6.1 7.3 6.9 8.2 9.7
In terms of Maximum Temperature, Table 6 shows seasonal average baseline temperature for
Burlington Region at 11.6°, 25.7°, 14.9° and 0.3˚C for spring, summer, fall and winter
respectively. Similar to Mean and Minimum Temperature, Burlington Region will experience an
increase in seasonal Maximum Temperature. Average summer Maximum Temperature is
projected to reach over 30˚C with average winter Maximum Temperature increasing to 4.4˚C by
2051-2080 according to RCP8.5.
17Table 6: Maximum Temperature for Burlington Region – RCP4.5 and 8.5
Emissions Scenario Baseline 2021-2050 2051-2080
Period 1976-2005 (˚C) (˚C)
(˚C) Low Mean High Low Mean High
RCP4.5 Spring 11.6 11.1 13.5 15.8 11.8 14.4 17.0
Summer 25.7 25.9 27.7 29.5 26.6 28.9 31.0
Fall 14.9 15.1 17.1 19.0 15.8 17.9 19.8
Winter 0.3 -0.2 2.2 4.6 0.7 3.3 5.9
Annual 13.2 13.7 15.2 16.6 14.4 16.1 17.8
RCP8.5 Spring 11.6 11.1 13.5 16.0 12.9 15.4 18.0
Summer 25.7 26.3 28.0 29.8 28.1 30.3 32.5
Fall 14.9 15.3 17.2 19.1 17.3 19.3 21.3
Winter 0.3 -0.1 2.3 4.9 1.8 4.4 7.2
Annual 13.2 13.9 15.3 16.7 15.7 17.4 19.1
Average annual Minimum and Maximum Temperatures are projected to experience a similar
increase as an annual Mean Temperature, as shown for the RCP8.5 scenario for Burlington
Region in Figure 3.
20
18
Average Annual Temperature (°C)
16
14
12
10
8
6
4
2
0
Baseline (1976-2005) 2021-2050 2051-2080
Annual Min Annual Max Average temperature (degC)
Figure 3: Annual Temperature for Burlington Region - RCP8.5
In addition to the average Maximum Temperature, the Warmest Maximum Temperature in a
given year is also expected to increase (i.e. the single, hottest day of the year). For Burlington
Region, the baseline average Warmest Maximum Temperature was 34.2°C. According to
RCP8.5, the average Warmest Maximum Temperature will increase to 36.5°C in the immediate
18future (2021-2050), and to 39°C in the near future (2051-2080). These temperatures do not
factor in additional warming due to the humidex which could make it feel 5 to 10oC warmer.
5.2 Hot Weather
Historically Canada was a winter peaking climate where more energy was used in the winter to
heat homes. In recent years, this has shifted resulting in increased energy use in the summer to
cool homes. Hot weather presents new heat related risks, such as heat exhaustion and heat
stroke, and limits outdoor exposure and activities. It also impacts whether plants and animals
thrive, increases the risk of drought, and can lead to more thunderstorms increasing the risks of
flash flooding, lightning and hail. xxii
5.2.1 Very Hot Days, Extremely Hot Days and Hot Season
The Climate Atlas presents the number of days where the daily maximum temperature results
in a Very Hot Day exceeding 30°C or Extremely Hot Days of 32°C and 34°C for Burlington Region
as seen in Table 7.
Days where the daily maximum temperatures exceed 30°C, 32°C and 34°C present the greatest
threats to community health due to heat-related illnesses. Specific groups, such as those who
work outside, infants and young children, older adults (over the age of 65), those with chronic
medical conditions, people experiencing homelessness, people planning outdoor sports or
activities, and those with limited mobility may be more adversely affected.xxiii Moreover, higher
summer temperatures increase electricity demand for cooling possibly leading to electricity
reliability issues during heat waves.
The baseline average number of Very Hot Days when the maximum temperature was greater
than or equal to 30°C was 16 days for Burlington Region. This is expected to increase to an
average of 61 days in the 2051-2080 period under the RCP8.5 scenario as shown in Table 7. This
means there will be over two to five times more days above 30°C by 2080 in the study region.
The number of Extremely Hot Days will also increase significantly under both a low and high
emissions scenario. Burlington Region experienced six days of Extremely Hot Days (32oC) in the
baseline period. This is expected to increase over six-fold to an average of 39 days by 2051-
2080 under RCP8.5. Extremely Hot Days (34oC) could increase from almost 2 days to over 21
days on average, an almost 13-fold increase.
19Table 7: Very Hot and Extremely Hot Days (30, 32 and 34°C) for Burlington Region - RCP4.5
and 8.5
Emissions Variable Baseline 2021-2050 2051-2080
Scenario 1976-2005 (Days) (Days)
(Days) Low Mean High Low Mean High
RCP4.5 30°C or 16.0 14.5 32.9 53.1 20.8 44.2 67.2
more
32°C or 6.0 4.0 16.6 32.8 7.4 25.2 45.7
more
34°C or 1.7 0.4 6.8 17.3 1.3 12.1 27.8
more
RCP8.5 30°C or 16.0 17.1 35.5 54.7 36.2 60.9 85.3
more
32°C or 6.0 5.2 18.3 34.2 17.4 38.8 61.2
more
34°C or 1.7 0.7 7.8 18.6 5.7 21.6 40.3
more
In addition to an overall increase in Very Hot and Extremely Hot Days, Burlington Region is also
expected to see an increase in the Warmest Maximum Temperature – i.e. the temperature of
the hottest day of the year. In the baseline period, Burlington Region’s average Warmest
Maximum Temperature was 34.2°C increasing to 36.5°C in 2021-2050 and expected to reach
39.0°C in 2051-2080 for RCP8.5.
While the number of Very Hot Days with temperatures at or above 30°C is expected to increase
overall, the length of the Hot Season (the number of days from the first day of the year with
temperatures at or above 30°C to the last day of the year with temperatures at or above
30°C)xxiv is also expected to increase. Table 8 outlines the length of the Hot Season for
Burlington Region. The baseline average length of the Hot Season was 70.5 days. By 2051-2080,
Burlington Region can expect an increase to 123.7 days according to RCP8.5 – almost double
the length of the Hot Season previously.
Table 8: Length of the Hot Season (30°C) for Burlington Region - RCP4.5 and 8.5
Emissions Scenario Baseline 2021-2050 2051-2080
1976-2005 (Days) (Days)
(Days) Low Mean High Low Mean High
RCP4.5 70.5 63.4 99.9 134.2 76.1 109.8 141.9
RCP8.5 70.5 68.7 102.0 134.9 90.1 123.7 156.4
205.2.2 Heat Waves and Tropical Nights
Heat Waves are defined as prolonged periods of extremely hot weather, which may be
accompanied by high humidity. The Climate Atlas defines a Heat Wave as three days in a row
where temperatures reach or exceed 30°C. Heat waves are location-specific; a heat wave is
usually measured relative to the usual weather in the area and relative to normal temperatures
for the season. Temperatures that people from a hotter climate consider normal can be termed
a heat wave in a cooler area. Thus, understanding shifts in local climate can help inform
particular strategies to mitigate population exposure in ways that are appropriate with local
norms and behaviours. High, persistent temperatures not only impact human health as
previously noted but also increase the risk of drought, which can severely impact food
production. High temperatures can also lead to more intense and frequent extreme weather
events including thunderstorms, risks of flash flooding, lightning, hail and perhaps even
tornadoes.xxv
Halton Region, which includes the City of Burlington and the towns of Oakville, Halton Hills and
Milton, issues a heat warning when Environment and Climate Change Canada forecasts:
Two consecutive days with the temperature 31°C or higher during the day and 20°C or
higher overnight, or
Two consecutive days with a humidex of 40°C or higher.
In addition, an extended heat warning is issued when forecasting:
Three consecutive days with the temperature 31°C or higher during the day and 20°C or
higher overnight, or
Three consecutive days with a humidex of 40°C or higher.xxvi
Though the parameters slightly differ between the Climate Atlas and Halton Region, the data
presented in the Climate Atlas can still illustrate the degree in which Heat Wave events will
become more frequent and prolonged in Burlington Region.
The Climate Atlas considers two variables for Heat Waves – the annual Average Length of Heat
Waves, and the annual Number of Heat Waves. The annual Number of Heat Wave events
measures the average number of times per year where the temperature reaches or exceeds
30°C for at least three days in a row. The baseline Number of Heat Waves for Burlington Region
was 2.1, as presented in Table 9 and Figure 4. In the 2051-2080 period according to RCP8.5,
Burlington Region can expect to experience almost seven Heat Wave events per year. This is
over triple the current number of occurrences.
Table 9: Annual Number of Heat Waves for Burlington Region - RCP4.5 and 8.5
Emissions Baseline 2021-2050 2051-2080
Scenario 1976-2005 (#) (#)
(#) Low Mean High Low Mean High
RCP4.5 2.1 1.7 4.5 7.4 2.6 5.7 8.7
RCP8.5 2.1 2.0 4.8 7.5 4.1 6.7 9.5
218
7
Number of Heat Waves
6
5
4
3
2
1
0
Baseline - 1976 - 2005 2021-2050 2051-2080
RCP4.5 RCP8.5
Figure 4: Annual Number of Heat Waves for Burlington Region - RCP4.5 and 8.5
With regards to the Average Length of Heat Waves (in days), Burlington Region experienced an
average of 3.7 days of heat wave conditions in the baseline period as displayed in Table 10. In
the 2051-2080 period, according to RCP8.5, Burlington Region can expect to see an average
heat wave event occurring for 8.1 days – over double the current length.
Table 10: Annual Average Length of Heat Waves for Burlington Region - RCP4.5 and 8.5
Emissions Baseline 2021-2050 2051-2080
Scenario 1976-2005 (Days) (Days)
(Days) Low Mean High Low Mean High
RCP4.5 3.7 3.3 5.2 7.4 3.9 6.2 9.3
RCP8.5 3.7 3.6 5.5 8.0 4.9 8.1 12.9
Overall, Heat Wave events are projected to occur more frequently and for longer periods of
time. While Table 10 outlines the annual Average Length of Heat Wave events, Table 11
outlines the Longest Spell of +30oC Days. The baseline average Longest Spell of +30°C Days for
Burlington Region was 3.9. By 2051-2080 according to RCP8.5, Burlington Region could
experience 18.2 consecutive days where temperatures exceed 30°C. This could result in an
Extended Heat Warning for Burlington Region for almost two and a half weeks.
Table 11: Longest Spell of +30°C Days for Burlington Region - RCP4.5 and 8.5
Emissions Baseline 2021-2050 2051-2080
Scenario 1976-2005 (Days) (Days)
(Days) Low Mean High Low Mean High
RCP4.5 3.9 2.9 7.5 13.9 4.2 10.8 19.6
RCP8.5 3.9 3.3 8.4 15.7 6.8 18.2 34.2
22Traditional patterns of hot weather during the day which then cool off at night can often be
enough to mitigate exposure to extreme temperatures.xxvii However, during periods of
extended heat, many people are at risk from suffering heat exhaustion or heat stroke when
experiencing prolonged exposure during hot summer days if nighttime temperatures fail to
drop below 20°C (Tropical Nights).xxviii There is an increasing trend of nighttime temperatures
warming faster than daytime temperatures, especially in places which typically experienced
cooler overnight low temperatures. xxix
Table 12 and Figure 5 show that the baseline average number of Tropical Nights for Burlington
Region was 8.1. In 2051-2080, according to RCP8.5, Burlington could experience 36.7 more
Tropical Nights on average representing a fivefold increase and about one-and-a-half months of
Tropical Nights.
Table 12: Annual Tropical Nights for Burlington Region – RCP4.5 and 8.5
Emissions Baseline 2021-2050 2051-2080
Scenario 1976-2005 (Nights) (Nights)
(Nights) Low Mean High Low Mean High
RCP4.5 8.1 8.2 19.3 32.6 12.4 28.2 48.5
RCP8.5 8.1 10.8 22.4 36.6 26.2 44.8 66.0
50
45
40
35
30
Days
25
20
15
10
5
0
Baseline - 1976-2005 2021-2050 2051-2080
RCP4.5 RCP8.5
Figure 5: Annual Tropical Nights for Burlington Region - RCP4.5 and 8.5
5.2.3 Cooling Degree Days
Cooling Degree Days (CDD) is an indicator of energy consumption due to air conditioner use
during the summer. It is a simple calculation of the number of degrees Celsius that each day’s
mean temperature is above 18oC. If a location shows an increase in projected CDD values, this
implies that it will experience hotter or longer summers requiring more energy (and thus
23money) to cool buildings for comfort and safety. xxx This will have significant impacts for those
who do not have access to air conditioning in their homes or apartments.
CDDs are projected to increase significantly in Burlington Region, more than doubling across the
region in the 2051-2080 period according to RCP8.5 as shown below.
Table 13: Cooling Degree Days for Burlington Region – RCP4.5 and 8.5
Emissions Baseline 2021-2050 2051-2080
Scenario 1976-2005 (# of oC) (# of oC)
(# of oC) Low Mean High Low Mean High
RCP4.5 315.7 345.9 499.5 658.0 421.3 616.9 837.1
RCP8.5 315.7 383.5 535.1 693.2 580.1 797.0 1033
5.3 Cold Weather
Cold Weather is an important aspect of life in Canada, as many places are well adapted to very
cold winters. Overall, the frequency and severity of cold days are decreasing across Canada
including in Burlington Region, while the number of hot days is increasing.
It should be noted that the artic is warming much faster than the rest of the world. Researchers
are seeing more evidence that the melting arctic ice could be impacting the jet stream, a
column of air in the upper atmosphere that helps drive weather systems. A warmer Arctic
Ocean radiates more heat to the atmosphere in winter, creating less of a temperature contrast
between the Arctic air and the atmosphere in regions further south. xxxi Usually the jet stream is
relatively straight from west to east with few dips. However, when the jet stream weakens and
becomes more unstable, it has larger dips which push cold arctic air further south (polar vortex)
or warm air from the south further north.xxxii This can not only result in more heat or drought
conditions but also more extreme cold spells with extreme precipitation lingering for longer
than normal.xxxiii
It is important to know how our winters will change in the future, because just like hot
temperatures cold temperatures affect health and safety, determine what plants and animals
can live in the area, limit or enable outdoor activities, define how we design our buildings and
vehicles, and shape our transportation and energy use. xxxiv
5.3.1 Mild Winter Days and Winter Days
A Mild Winter Day is a day when the temperature drops to at least -5°C. Mild Winter Days
indicate how much a location experiences moderately cold temperatures. This variable can be
important for certain tourism or recreational industries within Burlington Region. For example,
ski slope operators generally require temperatures below -5oC to make artificial snowxxxv and
temperatures between -7oC to -17oC are recommended for outdoor skating rinks.xxxvi The
baseline number of Mild Winter Days was 66.6. By 2051-2080 according to RCP8.5, that number
could decrease to an average of 27.3 days as shown in Table 14. This means transitioning from
over two months of Mild Winter Days to less than one month.
24Table 14: Mild Winter Days (-5°C) for Burlington Region - RCP4.5 and 8.5
Emissions Baseline 2021-2050 2051-2080
Scenario 1976-2005 (Days) (Days)
(Days) Low Mean High Low Mean High
RCP4.5 66.6 26.6 47.5 67.5 16.3 37.6 60.7
RCP8.5 66.6 25.4 46.3 67.2 9.2 27.3 48.3
Winter Days, defined as a day where the temperature drops to at least -15°C, are also projected
to decrease across Burlington Region. Table 15 shows that by the end of the century, there
could be an average of one day a year where average temperatures dip below -15°C.
Table 15: Winter Days (-15°C) for Burlington Region - RCP4.5 and 8.5
Emissions Baseline 2021-2050 2051-2080
Scenario 1976-2005 (Days) (Days)
(Days) Low Mean High Low Mean High
RCP4.5 11.2 0.3 4.6 11.2 0.0 2.3 7.1
RCP8.5 11.2 0.3 4.0 10.4 0.0 0.9 3.3
In addition to an overall decrease in Winter Days and Mild Winter Days, Burlington Region is
also expected to see a decrease in the Coldest Minimum Temperature – i.e. the temperature of
the coldest day of the year. In the baseline period, Burlington Region’s average Coldest
Minimum Temperature was -20.8°C. According to RCP8.5, Burlington’s average coldest
temperature will increase to -16.9°C in 2021-2050, and -13.0°C in 2051-2080.
5.3.2 Frost Days and Icing Days
Other variables of cold temperatures are Frost Days and Icing Days. Both are good indictors of
the length and severity of the winter season and can help to understand freeze and thaw
patterns throughout the region, and document risks relating to morbidity and mortality from
traffic accidents, damage to roads and infrastructure, facility closures and more.
A Frost Day is a day with frost potential – meaning the minimum temperature is below 0°C.
Frost days are predicted to decrease an average of 52 days by the 2080s in RCP8.5 as shown in
Table 16.
Table 16: Frost Days for Burlington Region - RCP4.5 and 8.5
Emissions Baseline 2021-2050 2051-2080
Scenario 1976-2005 (Days) (Days)
(Days) Low Mean High Low Mean High
RCP4.5 126.0 80.2 102.2 122.4 64.3 90.0 113.9
RCP8.5 126.0 77.7 100.1 123.3 47.3 74.0 97.7
25You can also read