ELECTRICITY DISTRIBUTION SERVICES 2022 PRICING METHODOLOGY - From 1 April 2021 Pursuant to: The Electricity Distribution Information Disclosure ...
←
→
Page content transcription
If your browser does not render page correctly, please read the page content below
ELECTRICITY DISTRIBUTION SERVICES
2022 PRICING METHODOLOGY
 From 1 April 2021

Pursuant to:
The Electricity Distribution Information Disclosure
Determination 2012 (Consolidated April 2018)
EXECUTIVE SUMMARY
Vector (“our”, “we”, or “us”) recovers the cost of owning and operating our electricity distribution networks (Network) through a combination of standard
(published), non-standard prices for electricity distribution services, and capital contributions for new connections. We are regulated by the Commerce
Commission (Commission) and are required to publish our pricing methodology for electricity distribution services (Pricing Methodology).
This document sets out our Pricing Methodology to meet the requirements of the Information Figure 1: Our electricity distribution networks
                                         1
Disclosure Determination 2012 (ID) . It describes and explains the consumer groups, the price
categories and components within each consumer group, how prices are set and the Cost of Service
                                                                                                                                    Networks
Model (COSM) allocation of target revenue to consumer groups. The ID requires price change
                                                                                                                                      in the
commentary relating to the pricing strategy2, but we do not currently have a pricing strategy as
                                                                                                                                     greater
defined in the ID. We do however have a publicly available electricity pricing road map3 that sets out
                                                                                                                                    Auckland
how we are evolving on prices to enable and deliver better outcomes for consumers.
                                                                                                                                      region
       Prices are set to earn the level of revenue we are permitted to under the DPP, less any                                      delivering
       intentional under-pricing                                                                                                    electricity
                                                                                                                                    to approx.
       When setting prices we take into account - historical price structures, minimising rate shock to                              592,000
       consumers, minimising recovery risk and ensuring that prices to individual consumer groups                                  homes and
       reflect their allocation of costs                                                                                           businesses

          The impacts of Covid-19 are a key consideration for the current price setting cycle

          Forecast revenue increases must not exceed 10% in any one year. Pricing under the allowed
          revenue is permitted and can be recovered in future periods (adjusted for time value), we have
          under priced by a forecasted $19.1m

          Given network costs are largely fixed we typically apply any price increases to fixed
          components and price decreases to variable components. This means not all consumers will
          see the weighted average price change some will see more some less. We do though have
          discretion on the allocation approach applied providing it complies with pricing principles
1   Electricity Distribution Information Disclosure Determination 2012 (consolidated April 2018), available at https://comcom.govt.nz/regulated-industries/electricity-lines/information-
    disclosure-requirements-for-electricity-distributors/current-information-disclosure-requirements-for-electricity-distributors
2   A pricing strategy is a decision made by the Directors on the electricity distribution business’ plans or strategy to amend or develop prices in the future, and recorded in writing
3   Available at https://www.vector.co.nz/personal/electricity/about-our-network/pricing under the heading “customer-led pricing design”
                                                                                                                                                                                            2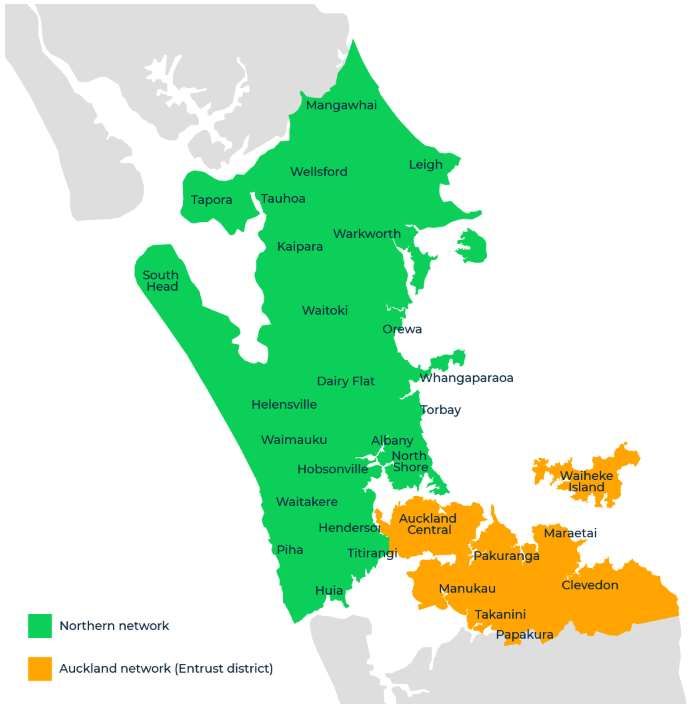
CONTENTS

Topic                                              Chapter                                                         Page
Executive summary                                                                                                    2
Contents                                                                                                             3
                                                    1 - Consumer groups                                              4
Consumer groups, price categories and components    2 - Price categories                                             5
                                                    3 - Price components                                             6
                                                    4 - Pricing developments                                         7
How prices are derived                              5 - How mass market and unmetered prices are derived             8
                                                    6 - How commercial prices are derived                            9
                                                    7 - Non-standard contracts & distributed generation policies    10
Policies and obligations
                                                    8 - Obligations and responsibilities to consumers               11
                                                    9 - Price setting                                               12
Impact of 1 April 2021 price changes
                                                   10 - Price changes                                               13
                                                   11 - Target revenue and its categorisation                       14
                                                   12 - Cost drivers                                                15
Target revenue allocation
                                                   13 - Cost driver allocation approaches                           16
                                                   14 - Target revenue allocation & price comparison                17
Line charge prices                                 Appendix 1 - Line charge prices from 1 April 2021                18
Target revenue allocation                          Appendix 2 - Target revenue recovery                             20
Pricing principles                                 Appendix 3 - Pricing principles                                  23
Directors’ certification                           Appendix 4 - Directors’ certification                            27

                                                                                                                          3
1 – CONSUMER GROUPS
Consumer groups are determined on how they use the network and the nature of the network service they receive. These consumer groups are
determined at a relatively high level, due to the physical nature of electricity distribution networks and the information that is available on consumer
demand characteristics, as outlined below:
There is a high degree of network meshing and interconnection of consumers;
End consumers are not generally geographically segmented in their use of different network assets, for example, there are very few purely
“industrial zones” or “residential zones”; and
There is a mix of consumers, including a large number of consumers with relatively low individual consumption, and vice versa.
We have maintained the same five standard consumer groups as in the previous year, based on a measure of capacity connection and supply
connection point type as shown in Table 1.
Table 1: Consumer groups Consumers on non-standard contracts which have met
certain eligibility criteria, as outlined on page 11, are
Capacity included in a separate consumer group.
Consumer group and subgroup Supply connection
connection
Residential Small ≤ Consumer groups are mutually exclusive so a consumer
Mass market Low voltage network
can only be in one group.
General 69kVA
Unmetered General Tiny ≤ 1kVA Low voltage network The mass market consumer group is split into two
Low voltage Commercial
Large ≥
Low voltage network
subgroups: residential and general with a key difference
69kVA between the subgroups being that the Low User
Large ≥ Vector owned transformer(s) which supplies Regulations4 apply only to the residential subgroup.
Transformer Commercial
69kVA consumer’s Low Voltage network
The unmetered consumer group is also in the general
Large ≥ High voltage or sub-transmission (6.6kV or higher)
High voltage Commercial subgroup.
69kVA network
Non-standard Various Various The low voltage, transformer and high voltage consumer
groups are collectively referred to as commercial
consumers.
4 The Electricity (Low Fixed Charge Tariff Option for Domestic Consumers) Regulations 2004 (the Low User Regulations) require distributors to offer residential consumers a price
option at their primary place of residence with a fixed price of no more than $0.15 per day (excluding GST) and where the sum of the annual fixed and volume charges on that price
option is no greater than any other residential price option for consumers using up to 8,000 kWh per annum
4
2 – PRICE CATEGORIES
Table 2 sets out the price categories5 for consumers on our Auckland network (codes beginning with A) and our Northern network (beginning with W).
Table 2: Price categories

Consumer group                                                Price category codes
                                  Short description                                  Key eligibility criteria / purpose
and subgroup                                                  Auckland   Northern
                                  Residential - time of use   ARHL       WRHL
                                                                                     Residential consumers without controllable load
                                  (TOU) - uncontrolled        ARHS       WRHS
                    Residential

                                  Residential - TOU -         ARHLC      WRHLC
                                                                                     Residential consumers with controllable load or reticulated gas connections
                                  controlled                  ARHSC      WRHSC
                                  Residential - exemption -   ARUL       WRUL        Residential consumers with a Vector provided exemption from TOU price categories, and without
Mass market                       uncontrolled                ARUS       WRUS        controllable load or reticulated gas connections
                                  Residential - exemption -   ARCL       WRCL        Residential consumers with a Vector provided exemption from TOU price categories, and with
                                  controlled                  ARCS       WRCS        controllable load or reticulated gas connections
                                  General - TOU               ABSH       WBSH        Non-residential < 69kVA consumers
                    General

                                  General - exemption         ABSN       WBSN        Non-residential < 69kVA consumers with a Vector provided exemption from TOU price categories

Unmetered                         General - unmetered         ABSU       WBSU        Unmetered < 1kVA capacity connections, mostly street lighting

                                  LV- TOU                     ALVT       WLVH        Main category for LV consumers, requires TOU metering
Low voltage (LV)
                                  LV- non TOU                 ALVN       WLVN        For smaller LV consumers (< 345kVA) who may not have TOU metering

                                  TX - TOU                    ATXT       WTXH        Main category for TX consumers, requires TOU metering
Transformer (TX)
                                  TX - non TOU                ATXN       WTXN        For smaller TX consumers (< 345kVA) who may not have TOU metering

                                  HV - TOU                    AHVT       WHVH        Main category for HV consumers, requires TOU metering
High voltage (HV)
                                  HV - non TOU                AHVN       WHVN        For smaller HV consumers (< 345kVA) who may not have TOU metering

5   Price categories are the relevant price plan (or tariff) from the price schedule that define the line prices applicable to a particular ICP. An ICP is an installation control point being a
    physical point of connection on a local network which a distributor nominates as the point at which a retailer will be deemed to supply electricity to a consumer
                                                                                                                                                                                                   5
3 – PRICE COMPONENTS
We have a range of price components6 that apply to different price categories depending on the characteristics of a particular category and the
availability of metering data. Table 3 describes the various price components that we have. There are no changes from the previous year.
Table 3: Price components
Type Component Codes Units Description
Daily price applied to the number of days each consumer’s point of connection (or fitting for unmetered
Daily FIXD $/day
Fixed
connections) is energised
Capacity CAPY $/kVA/day 7 Daily price applied to the installed capacity (or nominated capacity for AHVT and WHVH) of each consumer
Volume price, applies to all electricity distributed to each consumer. Controlled volume (AICO), uncontrolled volume
AICO, 24UC,
Volume $/kWh 8 (24UC), off peak volume (OFPK), or peak volume (PEAK) (0700 to 1100 and 1700 to 2100 weekdays including public
OFPK, PEAK
holidays)
Daily price applied to the average of the consumer’s ten highest kVA demands between 8am and 8pm on weekdays
Demand DAMD $/kVA/day
each month
Variable
Excess Daily price applied when the anytime maximum demand is greater than the nominated capacity and is applied to
DEXA $/kVA/day
demand the difference between the anytime maximum kVA demand and the nominated capacity
Daily price determined each month where a consumer’s power factor is less than 0.95 lagging. The kVAr amount is
Power factor PWRF $/kVAr/day 9 calculated as twice the largest difference between the recorded kVArh10 in any one half-hour period and the kWh
demand recorded in the same period divided by three
Injection INJT $/kWh Volume injection price applies to all electricity injected into the network by each consumer
6 Price components are the various prices that constitute the components of the total prices paid, or payable, by a consumer
7 kVA is kilovolt–ampere (amp), a measure of apparent power being the product of volts and amps. Used for the measurement of capacity and demand for pricing
8 kWh is kilowatt-hour, a unit of energy being the product of power in watts and time in hours. Used for the measurement of consumption for volumetric prices
9 kVAr is kilovolt ampere reactive, is a unit used to measure reactive power in an AC electric power system. Used for the measurement of power factor in pricing
10 kVArh is kilovolt ampere reactive hour, a unit of energy being the product of reactive power in kVAr and time in hours. Used for the measurement of power factor in pricing
64 – PRICING DEVELOPMENTS
The future is unpredictable. New business models are evolving in response to new consumer demands, new technologies and decarbonisation. We
have taken the strategic decision to embrace these changes rather than resist them. We see this new environment as an opportunity to revise our
pricing in response to an evolving market. We do not believe economically-principled, efficient pricing should be an end goal in and of itself.
Our consumer insights show that some consumers are interested in adopting new technology to manage their usage and save money while others
prefer simplicity and convenience. Ultimately, we seek to implement pricing structures that meet consumer preferences, send the right signals and are
well understood by consumers. Therefore, we are committed to continually evolve our prices to meet consumer expectations while still meeting
regulatory requirements. This evolution includes consultations with consumers, retailers, industry experts and obtaining consumers insights through
application of sophisticated data analytics.
Successful pricing reform will not be just about economics. Careful consideration of the trade-off between the extent of cost-reflectivity and the
practical understanding of the price signal is paramount. Consideration is also needed of bill impacts resulting from moving to new pricing. This
transition needs to be careful managed especially in regard to vulnerable consumers.
To assess the potential impacts of new line charge pricing models on consumers, it is essential that distributors have access to half-hourly consumer
usage data at the ICP level. The current lack of access to this data is providing a barrier to the development and assessment of new pricing models.
Retailers need to ensure that our pricing is passed through to our consumers. Re-packaging our tariffs risks obscuring the price signal and in turn
preventing consumers from the potential benefits our pricing may afford.
It is worth highlighting that any substantial change to pricing structures creates challenges under the current regulatory framework in forecasting and
allocating volumes for the purpose of weighting and setting prices. The Low User Regulations have introduced inefficiencies and inequities as the
majority of distributors’ costs are fixed and hence could be more efficiently recovered via some form of fixed charge. We are encouraged by recent
Government announcements that the Low User Regulation will be amended.
For further information on our future pricing developments, please see our electricity roadmap which is available at https://www.vector.co.nz/
personal/electricity/about-our-network/pricing under the heading “consumer-led pricing design”. The roadmap is an evolving document and will
updated periodically, but at least twice a year.
75 – HOW MASS MARKET AND UNMETERED PRICES ARE DERIVED
Like the previous year, for PY22 11 our mass market price categories continue to be split into two pricing structures;
two-part time of use - daily fixed price with different volumetric prices depending on the time period when the electricity is used (that has peak
time pricing during 7am-11am and 5pm-9pm weekdays and off-peak pricing during other times), and
flat volumetric pricing - daily fixed price and any anytime volumetric price, available only as an exemption to TOU of consumption information.
Our residential price categories include both controlled and uncontrolled price categories, with the controlled price categories designed to reward
residential consumers for the benefit these households deliver to us in helping to reduce load during peak periods, via electrical hot water load control
system or gas connections which typically use less electricity during peak periods.
Our residential prices are subject to the Low User Regulations, and we comply with these regulations by offering low user price categories for
residential consumers at their primary place of residence with a fixed price of $0.15 per day and volume prices that ensure that consumers who use
8,000 kWh per year or less are better off on the low fixed price categories.
We have a two-part charge for unmetered price categories with fixed and volumetric prices. The fixed price is the number of days each point of
connection of fitting is energised. Unmetered consumers’ volumes are determined by us based on load profiles and fitting input wattages.
Table 4 shows the price components applicable to the price categories for the mass market and unmetered consumer groups. The price components
for mass market and unmetered are the same as the previous year.
Table 4: Price components applicable to mass market and unmetered price categories from 1 April 2021
Volume
Price category code Daily
Consumer group and anytime off-peak peak injection
Price category description
subgroup -FIXD -24UC -AICO -OFPK -PEAK -INJT
Auckland Northern
$/day $/day/fitting $/kWh
TOU - uncontrolled ARHL, ARHS WRHL, WRHS
General Residential
TOU - controlled ARHLC, ARHSC WRHLC, WRHSC
Exemption - uncontrolled ARUL, ARUS WRUL, WRUS
Mass market
Exemption - controlled ARCL, ARCS WRCL, WRCS
TOU ABSH WBSH
Exemption ABSN WBSN
Unmetered Unmetered ABSU WBSU
11 Pricing year (PY) is the 12 month period from 1 April to 31 March each year. PY22 is 1 April 2021 to 31 March 2022 86 – HOW COMMERCIAL PRICES ARE DERIVED
Our price structure for commercial price categories is largely historical. There were (and, to a lesser extent, still are) a variety of price categories with
different combinations of price components and price levels, due largely to pricing differences that existed prior to both networks being owned by
us .
Current TOU price categories consist of a daily fixed (Northern network only), volume, capacity, demand, excess demand (for high voltage
consumers) and power factor prices. Non-TOU price categories include daily fixed, volume, capacity and power factor prices (no demand prices).
We maintain a relativity in price levels between low voltage, transformer and high voltage price categories. Except for power factor prices, high
voltage price levels are 97% of transformer price levels which are, in turn, 98% of low voltage price levels. This approach reflects the relative costs of
serving these consumer groups.
Table 5 shows the price components applicable to the price categories for the commercial consumer groups, there is no change from the previous
year.
Table 5: Price components applicable to commercial price categories
Volume - Excess Volume -
Daily Capacity Demand Power factor
Consumer Price category Price category anytime demand injection
group description codes -FIXD -24UC -CAPY -DAMD -DEXA -PWRF -INJT
$/day $/kWh $/kVA/day $/kVAr /day $/kWh
ALVT
TOU
Low voltage WLVH
Non TOU ALVN, WLVN
ATXT
TOU
Transformer WTXH
Non TOU ATXN, WTXN
AHVT
TOU
High voltage WHVH
Non TOU AHVN, WHVN
97 – NON-STANDARD CONTRACTS & DISTRIBUTED GENERATION POLICIES
Table 6: Criteria for non-standard contracts
Approach Description
Criteria For any new investments required by consumers, we apply our capital contributions policy. Our policy for determining capital contributions on our
electricity distribution network is available at http://vector.co.nz/disclosures/electricity/capital-contributions. When a new investment is recovered through
capital contributions, standard pricing applies.
Historical investments required by consumers and not recovered through capital contributions may be subject to non-standard contracts allowing for
non-standard prices and tailored commercial arrangements to be applied to individual consumers.
Methodology For determining prices for consumers subject to non-standard contracts, we use actual costs and/or allocated costs derived from an allocation model to
determine prices. This allocation model is similar to the Cost of Service Model (COSM) used in assessing standard pricing.
Approach to pricing distributed generation
Our policies and procedures for installation and connection of distributed generation are in accordance with the requirements of Part 6 (Connection of
distributed generation) of the Electricity Industry Participation Code 2010 (the Code).
We charge each distributed generator12 prior to them connecting to the network based on the fees set out in Part 6 of the Code. We do not charge for
connections smaller than 10 kW.13
We do not make Avoided Cost of Distribution payments to any distributed generators. We make Avoided Cost of Transmission (ACOT) payments to
distributed generators in accordance with our ACOT methodology.
To date given the small number of distributed generation consumers, we have not identified any short run incremental costs from injection of energy
into the network so this price continues to be $0.0000/kWh from 1 April 2021 for all distributed generators. As more distributed generation connects this
may require more in-depth consideration and as a result pricing may change.
Further information on our policies for distributed generation can be found at https://www.vector.co.nz/personal/solar/connecting-your-generation-to-
our-network.
12 Distributed generator is a party with whom we have an agreement for the connection of plant or equipment to our electricity distribution network where the plant or equipment
is capable of injecting electricity into our distribution network
13 kW is kilowatt, a measure of electrical power. Also used for the measurement of demand during peak periods for the allocation of transmission charges from Transpower
108 – OBLIGATIONS AND RESPONSIBILITIES TO CONSUMERS
For PY22, our obligations and responsibilities to consumers in the event that the supply of electricity lines services to them is interrupted have no
implications for determining prices.
A summary of our obligations and responsibilities to consumers subject to non-standard contracts on our network (in the event that the supply of
electricity lines services to the consumer is interrupted) is provided in Table 7. Our standard contract terms and non-contract terms are also
compared.
Table 7: Summary of our obligations and responsibilities to consumers
No. of interruptions No. of
Planned interruption notice Unplanned interruption notice Fault restoration
per annum consumers
CBD/Industrial: 2 hours
Standard
As soon as practicable but no later than: Urban: 4 Approx.
4 days - 20 mins during staffed control room hours, Urban: 2.5 hours
592,000
- 40 mins during on-call control room hours
Rural: 4.5 hours Rural: 10
Same as standard consumers 1
1 April each year, or 10 working days As soon as practicable 2 hours 1 unplanned 1
1 June each year As soon as practicable As soon as practicable Not stated 2
1 November each year As soon as practicable Priority Not stated 6
Non-standard
10 working days As soon as practicable 3 hours Not stated 7
10 working days Not stated 3 hours Not stated 2
10 working days Not stated Not stated Not stated 2
30 working days As soon as practicable As soon as practicable Not stated 1
4 working days As soon as practicable 3 hours Not stated 5
7 working days As soon as practicable Priority 3 planned 2
August each year Not stated 1 hour Not stated 1
119 – PRICE SETTING
Our prices are subject to the Electricity Distribution Services Default Price-Quality Path Determination 2020 (DPP Determination)14 which states that to
be compliant with the price path, forecast revenue (target revenue) must not exceed forecast allowable revenue (revenue cap).
Forecast allowable revenue equals the regulated distribution revenue (as set for every pricing year in the five year regulatory period adjusted for
inflation) plus forecast pass-through costs (e.g. transmission costs, council rates and statutory levies) plus regulatory adjustments15 (including any
adjustment to cap the forecast allowable revenue increase to ten percent as required by the DPP Determination).
Figure 2: Change in PY22 forecast revenue and contribution to price change16
12%
% impact on forecast revenue /
10% From 1 April 2021 (the second year of
the regulatory period), our electricity
-3.3% or line charge prices are increasing by a
8% -$19.1m weighted average 4.0%
6.8% or
prices
6% $38.1m
-2.7%
4% 6.7% or
1.9% or $37.4m
2% $10.8m 4.0%
1.3% or
0% $7.6m
Regulated distribution Transmission, Regulatory Under-pricing Forecast Quantity Price
revenue rates & levies adjustments revenue impact change
Pass-through Regulatory
Base / Inflation Under recovery Target revenue Quantity Price change
costs adjustments
14 Available at https://comcom.govt.nz/regulated-industries/electricity-lines/ electricity-lines-price-quality-paths/electricity-lines-default-price-quality-path/ 2020-2025-default-price-
quality-path
15 Regulatory adjustments are intangible recoverable costs (not invoiced) such as incentives and wash-ups that impact the amount of line charge revenue that we are allowed to
recover. These wash-ups include incremental rolling incentive scheme (IRIS), quality incentive adjustment, capex wash-up adjustment and pass-through balance allowance and
have time value of money included. The amount has been adjusted down to meet the revenue cap
16 Vector’s forecast revenue is set to under recover by $19.1m
1210 – PRICE CHANGES
We are conscious of the effect of price changes for consumers. Our starting point for calculating prices is the corresponding price from the previous
year. Historic consumer groups and price categories have been. Figure 3 shows how the weighted average price change is split across the consumer
groups. Our electricity prices that apply from 1 April 2021, including the previous year’s prices that were effective from 1 April 2020, are set out in
Appendix 1.17
Figure 3: Weighted average price change by consumer group
Unmetered consumers’ prices are unchanged as are transitioning
6% back to the COSM range. Non-standard price changes as per
4.9% 5.0% 5.0%
5% contracts and with forecast contract renewals having a lower
4.0% 4.0% price predominantly due to the lower WACC in the current
4%
regulatory period.
3%
For mass market consumers, time of use plans are mandatory,
2%
with exemptions granted only where retailers don’t obtain the
1% ICPs interval data. The price increase is primarily passed through
0.0%
0% fixed (for standard residential and general) and TOU peak prices.
Mass Market Unmetered Low Voltage Transformer High Voltage Non-standard Total General continues to match residential standard user
-1%
uncontrolled.
-2% Changes to individual prices will vary from weighted
average price changes. This is due to differences in The decision to primarily increase the fixed prices for mass
-3%
individual consumption levels market consumers reflects the fact that the majority of our costs
-4% -3.6% are fixed and sunk, so increasing the fixed portion of revenues
-5% aligns the recovery of revenues with the way costs are incurred.
For commercial consumers, the price increase is applied uniformly across all price components except power factor which stays the same (consistent
with previous years approaches). With the variety of commercial consumers’ consumption profiles, this approach was taken to closely align the
weighted average change across the price categories.
We did not directly seek the views of consumers when setting prices. Rather, we consulted with Entrust, whose beneficiaries are mass market
consumers on the Auckland network, and retailers on behalf of consumers on the proposed price changes. We have considered and largely
accommodated their feedback in our final prices.
17 Our full price schedules are available at https://www.vector.co.nz/personal/electricity/about-our-network/pricing
1311 – TARGET REVENUE AND ITS CATEGORISATION
Figure 4: COSM structure
Our COSM is used to allocate target revenue to consumer groups using
various cost drivers. The model structure is outlined in Figure 4. Cost inputs Allocator inputs by consumer group
Target revenue is the total revenue we expect to recover from our prices target revenue ICPs kWh kW @RCPD
(complying with the regulated price path) and our forecasted quantities. The
total target revenue for PY22 is $603.0m ($565.2m for PY21). Calculations
allocate target revenue to
The total target revenue is broken down into the key components required to cost drivers
consumer group using allocators
cover the costs and return on investment associated with the provision of
electricity distribution services as shown in Figure 5. These key components
Outputs Comparison
are categorised by cost driver i.e. either ‘asset’, ‘non-asset’, ‘transmission’ or
‘profit’. These categorisations are summarised in Figure 6 determine the way target revenue range by target revenue from
that the target revenue is allocated to consumer groups. consumer group prices and COSM
Figure 5: Target revenue by key components Figure 6: Target revenue by cost driver
$200 $181
PY21 PY22
Forecast value ($m)
$150
$109 PY22 $228.4 $96.1 $181.0 $97.5 $603.0
$98
$100
$63 $180
$109 $44 $44
$50 $104
$13 $12 $17 $21
$57 $44
$10 $37 $11 $16 $7 -$10 $1
$0
through costs
Depreciation
Depreciation
Indirect
Return on
Regulatory
Direct costs
Pass-through
Transmission
Maintenance
Allocated
PY21 $213.0 $68.7 $179.6 $103.9 $565.2
Other pass-
costs
allowance
capital
costs
balance
-$50
tax
costs
$0 $100 $200 $300 $400 $500 $600
Asset Non-asset Transmission Profit Asset Non-asset
Forecast value ($m)
Key component and driver Transmission Profit
1412 – COST DRIVERS
The key components categorised as ‘asset costs’ are those Table 8: Asset categorisation
associated with expenditure and return on the electricity
Asset Consumer Asset value 19
distribution network assets. We have grouped these network Assets
category groups (RAB)
assets into three distinct categories as shown in Table 8.
Sub-transmission lines / cables
We assume that costs associated with assets are incurred in A Zone-substations All $2,319m 72%
proportion to the value of the assets. For example, as Category A HV lines / cables
assets make up 72% of the asset value of our Regulatory Asset Base Distribution substations that have no
(RAB)18, we assume that 72% of maintenance costs will be B Vector-owned low voltage lines / Transformer $61m 2%
associated with Category A assets. cables leaving the substation
Distribution substations that:
A key feature of an electricity distribution network is
o have Vector-owned low voltage
interconnected assets. Many consumers on the network share Low voltage,
lines leaving the substation, or
assets and it is difficult to identify precisely who benefits from C unmetered, $842m 26%
o supply multiple end-consumers
which assets. While this means that the allocation of target mass market
connected at low voltage
revenue between consumers or groups of consumers can be
Low voltage assets
made in many ways, it also means that the cost of providing the
network is shared widely and therefore the cost of network Table 9: Cost drivers used in the COSM
services is generally low for each consumer.
Consumer Asset
Non-asset Transmission Profit
The cost drivers of ‘Asset’, ‘Non-Asset’, ‘Transmission’ and ‘Profit’ group A B C
are applied to the combined Northern and Auckland networks.
Amount $164.4m $4.3m $59.7m $96.1m $181.0m $97.5m
Our COSM allocates the recovery of the $603.0m to consumer
groups using various cost drivers as summarised in Table 9. Contribution
Mass market
to RCPD Number of
Unmetered n/a or consumers
Rate of
18 Broadly the regulatory asset base represents the amount that we have Contribution annual or Contribution return
invested in our regulated network, indexed to inflation and adjusted for Low voltage
to RCPD consumption annual to RCPD on
depreciation
19 The values are weighted averages of the last five years’ worth of data, with each consumption assets
Transformer Direct
year being weighted twice the previous year. Contribution to RCPD not n/a
obtained for previous year as aggregated interval consumption data by
High voltage n/a
consumer group was unable to be provided to Vector
1513 – COST DRIVER ALLOCATION APPROACHES
We aim to allocate asset-related costs on the basis of a consumer group’s usage of the assets during peak periods, as this usage drives the need for,
and the size of, the assets.
• For Category A assets, an appropriate and readily available measure to allocate their costs, is consumer group’s contribution to Transpower’s
Regional Coincident Peak Demand (RCPD)20 periods.
• For Category B assets, the costs do not require an allocation approach as they are used by one consumer group (transformer consumers).
• For Category C assets, that are assets located close to the end consumer, appropriate readily-available allocators are contribution to RCPD and
annual consumption. We use both allocators to generate a band of cost allocation values as no one allocator is preferred to the other.
Non-asset costs’ can be broadly summarised as overhead costs and pass-through costs (other than transmission costs). Costs categorised as ‘Non-
asset’ have no direct cost driver. We have chosen to create a band of cost allocations using annual consumption and the number of consumers as the
allocators.
Costs categorised as ‘Transmission’ are transmission charges from
Figure 7: PY22 COSM allocation values and percentage21 Transpower that we pass through to consumers. Transmission
2,335 0% 4,749 1% interconnection costs (which form the majority of transmission
1,480 0% charges) are charged to us by Transpower on the basis of demand
Allocator
Number 558,422
of ICPs 98% 168 0% during RCPD periods. We mirror this approach by allocating
50 1% 31 0% transmission costs to each consumer group on the basis of that
Annual consumer group’s demand during these RCPD periods.
4,593 1,038 1,564 566 624
Consumption
(GWh) 54% 12% 19% 7% 7%
13 1%
‘Profit’ is the return on capital and is broadly generated through the
Contribution to 1,144 151 209 76 69 usage of Vector’s assets. A consumer groups’ asset values are
RCPD (MW) 69% 9% 13% 5%4% calculated in the same way as ‘Asset’ related costs are. ‘Profit’ is
allocated using a constant rate of return across the consumer groups’
0% 10% 20% 30% 40% 50% 60% 70% 80% 90% 100% asset values.
Mass market Unmetered Low voltage Tranformer High voltage Non-standard
20 RCPD for a Transmission Region is the sum of the offtake measured in kW in that Region during Regional Coincident Peak Demand Periods, as determined by Transpower each
year. Where a Transmission Region is one of the four regional groups of connection locations (as defined in Transpower’s Transmission Pricing Methodology), Upper North Island,
Lower North Island, Upper South Island, and Lower South Island; and Regional Coincident Peak Demand Period means for the Upper North Island a half hour in which any of the
100 highest regional demands (measured in kW) occurs during 1 September to 30 August immediately prior to the start of the Pricing Year
21 Weighted average of last five year’s values from the billed quantities in Schedule 8 of our annual Electricity Information Disclosures (available at https://www.vector.co.nz/about-
us/regulatory/ disclosures-electricity/financial-and-network-information), with each year being weighted twice the previous year
1614 – TARGET REVENUE ALLOCATION & PRICE COMPARISON
The result of using the different allocators for category C ‘asset costs’ and ‘non-asset costs’ creates a target revenue range by consumer group as the
use of different allocators gives rise to different target revenue allocation results. The bands represent the lower and upper bounds of the different
allocation approaches, as shown in Figure 8 which shows target revenue calculated from PY22 prices by consumer group compared with the COSM
allocations. The result is that PY22 prices produce forecasts that are in or near an acceptable range when compared to target revenue allocations.
The pricing for non-standard consumers is Figure 8: PY22 target revenue from prices compared with COSM allocations
calculated as per their contracts and is
separate from the other consumer groups. Non-standard $17.8 The green bands are the target revenue
The COSM is calibrated to produce the High Voltage $19-26 range for each consumer group based
$71.0
forecasted target revenue of $17.8m (2.9%) Transformer $20.6 $57-77
on our COSM allocations COSM range
to be recovered from the 24 non-standard Target revenue
consumers (30 ICPs). Low Voltage $49-66 The blue markers represent the target
Unmetered $64.1 revenues from PY22 prices
$4.4-4.6 $424.7
Price setting is an iterative process, where $4.8
Mass Market $412-456
the prices are only finalised once the price
path compliance is managed, bill impacts - 50 100 150 200 250 300 350 400 450
Target revenue ($m)
are fair and tolerable and prices deliver
revenue from each consumer group Figure 9: Proportion of PY22 target revenue by price component and category
consistent with their target revenue
allocation Residential - low user
market
Mass
Residential - standard user
The proportion of the aggregated price General
categories’ target revenue is shown by
Unmetered
price component in Figure 9. All price
Auckland - TOU
Commercial
categories within the aggregation have
similar proportioned price components. Northern - TOU
Please see Appendix 2 for the proportion Auckland - non TOU
of target revenue split by individual price Northern - non TOU
category and price component. Total
0% 10% 20% 30% 40% 50% 60% 70% 80% 90% 100%
Fixed Daily Fixed Capacity Variable Volumetric Variable Demand Variable Powerfactor
17APPENDIX 1 - LINE CHARGE PRICES FROM 1 APRIL 2021
Table 10: Mass market and unmetered line charges prices Transmission
Total line charge prices
(previous price, if changing) charge price*
Daily Volume Volume
Estimated off- anytime or
Price Price Price anytime peak injection
Consumer group number of peak peak
category category category
and subgroup consumers $/day $/day/fitting $/kWh $/kWh $/kWh $/kWh $/kWh $/kWh
type description codes
(PY22 avg.)
-24UC, -AICO
-FIXD -FIXD -24UC -AICO -OFPK -PEAK -INJT
or -PEAK
ARHL 29,544 0.0658 0.1647* 0.0992
Uncontrolled 0.15 -
WRHL 20,269 (0.0621) (0.1542)* (0.0921)
TOU
Residential
- low user
ARHLC 162,839 0.0658 0.1446* 0.0791
Controlled 0.15 -
WRHLC 105,614 (0.0621) (0.1354) (0.0733)
ARUL 820 0.0963* 0.0349
Uncontrolled 0.15 -
WRUL 562 (0.0925)* (0.0369)
Exemption
ARCL 4,644 0.0901* 0.0287
Controlled 0.15 -
WRCL 3,026 (0.0863)* (0.0307)
ARHS 16,670 1.09 0.0230 0.1219* 0.0992
Uncontrolled -
WRHS 15,596 (1.01) (0.0229) (0.1150)* (0.0921)
Mass market TOU
Residential
- standard
ARHSC 90,254 1.09 0.0230 0.1018 0.0791
Controlled -
WRHSC 68,402 (1.01) (0.0229) (0.0962) (0.0733)
ARUS 463 1.09 0.0535* 0.0349
Uncontrolled -
WRUS 433 (1.01) (0.0533)* (0.0369)
Exemption
ARCS 2,379 1.09 0.0473* 0.0287
Controlled -
WRCS 1,803 (1.01) (0.0471)* (0.0307)
ABSH 31,708 1.09 0.0230 0.1219* 0.0992
TOU -
WBSH 19,552 (1.01) (0.0229) (0.1150)* (0.0921)
General
ABSN 5,076 1.09 0.0535* 0.0349
Exemption -
WBSN 3,130 (1.01) (0.0533)* (0.0369)
ABSU 1,707 0.0196
Unmetered Unmetered 0.08 0.0257* -
WBSU 706 (0.0260)
* The transmission charge price is only included in this component of the line charge price 18APPENDIX 1 - LINE CHARGE PRICES FROM 1 APRIL 2021
Table 11: Commercial line charge prices Transmission
Total line charge prices
(previous price, if changing) charge price*
Volume Excess Power Volume Volume anytime
Estimated Daily Capacity Demand
Price Price anytime demand factor injection or Demand
Consumer number of
category category
group consumers $/day $/kVA/day $/kWh $/kVA/day $/kVA/day $/kVAr/day $/kWh $/kWh or $/kVA/day
description code
(PY22 avg.)
-FIXD -CAPY -24UC -DAMD -DEXA -PWRF -INJT -24UC or -DAMD
1.87 0.0441 0.0568* 0.0181
ALVN 2,322 0.2917 -
(1.78) (0.0421) (0.0541)* (0.0187)
Non TOU
6.04 0.0356 0.0351* 0.0181
WLVN 916 0.2917 -
(5.74) (0.0339) (0.0335)* (0.0187)
Low voltage
0.0441 0.0126 0.3063* 0.1828
ALVT 1,440 0.2917 -
(0.0421) (0.0120) (0.2917)* (0.1900)
TOU
11.37 0.0356 0.0054 0.2759* 0.1828
WLVH 262 0.2917 -
(10.82) (0.0339) (0.0050) (0.2628)* (0.1900)
1.83 0.0432 0.0557* 0.0181
ATXN 161 0.2917 -
(1.74) (0.0412) (0.0530)* (0.0187)
Non TOU
5.92 0.0349 0.0344* 0.0181
WTXN 134 0.2917 -
(5.63) (0.0332) (0.0328)* (0.0187)
Transformer
0.0432 0.0123 0.3001* 0.1828
ATXT 948 0.2917 -
(0.0412) (0.0117) (0.2858)* (0.1900)
TOU
11.15 0.0349 0.0053 0.2704* 0.1828
WTXH 282 0.2917 -
(10.61) (0.0332) (0.0049) (0.2575)* (0.1900)
1.77 0.0419 0.0540* 0.0181
AHVN 7 0.2917 -
(1.68) (0.0399) (0.0514)* (0.0187)
Non TOU
5.74 0.0339 0.0334* 0.0181
WHVN 0 0.2917 -
(5.46) (0.0322) (0.0318)* (0.0187)
High voltage
0.0419 0.0119 0.2910* 0.9218 0.1828
AHVT 142 0.2917 -
(0.0399) (0.0113) (0.2772)* (0.8778) (0.1900)
TOU
10.82 0.0339 0.0051 0.2623* 0.7458 0.1828
WHVH 24 0.2917 -
(10.30) (0.0322) (0.0048) (0.2498)* (0.7084) (0.1900)
* The transmission charge price is only included in this component of the line charge price 19APPENDIX 2 –TARGET REVENUE RECOVERY
Table 12: Proportion of mass market target revenue by price component
Code Fixed Variable Code Fixed Variable
Consumer group and subgroup Price category description
Auckland Daily Volumetric Northern Daily Volumetric
TOU - uncontrolled ARHL 0.27% 2.36% WRHL 0.18% 1.73%
Residential - TOU - controlled ARHLC 1.48% 12.21% WRHLC 0.96% 8.39%
low user Exemption - uncontrolled ARUL 0.01% 0.06% WRUL 0.01% 0.05%
Exemption - controlled ARCL 0.04% 0.47% WRCL 0.03% 0.27%
TOU - uncontrolled ARHS 1.10% 1.41% WRHS 1.03% 1.38%
Mass market
Residential - TOU - controlled ARHSC 5.95% 6.79% WRHSC 4.51% 5.37%
standard user Exemption - uncontrolled ARUS 0.03% 0.03% WRUS 0.03% 0.03%
Exemption - controlled ARCS 0.16% 0.23% WRCS 0.12% 0.15%
TOU ABSH 2.09% 5.39% WBSH 1.29% 2.91%
General Exemption ABSN 0.33% 0.91% WBSN 0.21% 0.48%
Unmetered Unmetered ABSU 0.35% 0.15% WBSU 0.22% 0.09%
Table 13: Proportion of commercial target revenue by price component
Consumer Short Category Fixed Variable Category Fixed Variable
Power Power
group description Auckland Daily Capacity Volumetric Demand Northern Daily Capacity Volumetric Demand
factor factor
TOU ALVT - 1.02% 1.19% 2.31% 0.15% WLVH 0.18% 0.15% 0.12% 0.48% 0.03%
Low voltage
Non TOU ALVN 0.26% 0.93% 2.41% - 0.01% WLVN 0.33% 0.29% 0.74% - 0.02%
TOU ATXT - 1.80% 2.41% 4.40% 0.16% WTXH 0.19% 0.45% 0.33% 1.30% 0.06%
Transformer
Non TOU ATXN 0.02% 0.10% 0.22% - 0.00% WTXN 0.05% 0.07% 0.21% - 0.01%
TOU AHVT - 0.42% 0.86% 1.48% 0.05% WHVH 0.02% 0.08% 0.10% 0.37% 0.01%
High voltage
Non TOU AHVN 0.00% 0.00% 0.01% - 0.00% WHVN - - - - -
20APPENDIX 3 – CONSISTENCY WITH PRICING PRINCIPLES
The Electricity Authority’s Pricing Principles22 (Pricing Principles) provide guidance to developing pricing methodologies for electricity distribution
services. Table 14 demonstrates the extent to which the Pricing Methodology is consistent with the Pricing Principles.
Table 14: Pricing principles
Principle (a): Economic costs of service provision
Prices are to signal the economic costs of service provision, including by:
i. being subsidy free (equal to or greater than avoidable costs and less than or equal to standalone costs);
ii. reflecting the impacts of network use on economic costs;
iii. reflecting differences in network service provided to (or by) consumers; and,
iv. encouraging efficient network alternatives.
The avoidable cost test can be applied both for individual consumers and for groups of consumers. The avoidable cost for an individual consumer is
the cost of connecting that consumer to the network, and therefore excludes the cost of shared assets. The avoidable cost for a group of consumers
is the cost of connecting that group of consumers to the network, and includes the cost of assets shared by that group. Our capital contributions
policy ensures that individual consumers generally pay the costs of connecting to the network.
Applying the avoidable cost test at a group level is more stringent because it includes shared costs for the group. Revenues for the group must be
higher than just the sum of the avoidable cost for each individual consumer.
While we monitor the cost of a range of alternative options for consumers, it can be difficult to apply these on a consumer-specific basis. In some
instances, the economic value of the service, including where that is set by the cost of an alternative form of supply, may be notified to us by the
consumer. In these situations, this pricing principle is delivered through the operation of pricing principle (c), detailed below.
The electricity distribution system consists of assets with significant capacity. When building the system, economies of scale exist such that the cost
of installing an asset larger than that which is immediately required does not add significantly to the cost of network build. As a consequence, some
parts of the distribution system have spare capacity. In most cases, due to the availability of spare capacity, the short run cost of the next unit of
capacity is significantly less than the average cost.
22 Available at https://www.ea.govt.nz/development/work-programme/pricing-cost-allocation/distribution-pricing-review/development/summary-of-submissions-and-decision-paper
21APPENDIX 3 – CONSISTENCY WITH PRICING PRINCIPLES
Principle (a): Economic costs of service provision (cont.)
Some areas of our network have high utilisation and the system Figure 10: Forecast capital expenditure to meet future demand
requires expansion (for example, to connect a new user to the
distribution system). We generally fund this expansion through $140
capital contributions and/or non-standard prices which ensure
Millions
$120
recovery of the incremental capital investment. Our approach
to recovering these costs is outlined in our electricity $100
distribution capital contribution policy. $80
$60
Figure 10 shows our forecast capital expenditure excluding
$40
capital contributions to meet future demand from our 2020
Asset Management Plan27. Consumer connections allow for the $20
costs of connecting new consumers and reticulating new $0
subdivisions, while system growth relates to expansion of the FY21 FY22 FY23 FY24 FY25 FY26 FY27 FY28 FY29 FY30
network to provide the capacity to meet the electricity needs of Consumer connection System growth
all connections.
Our target revenue allocation illustrates how we utilise relevant cost drivers. We translate these into prices taking account of the materiality of the
costs, our ability to estimate and signal the costs as well as the ability of participants to respond. We also consider important consumer aspects such
as predictability, bill stability and equity.
Broadly we signal the level of available capacity and future investment costs over different time periods using time of use prices and controlled load
prices. Prices for commercial consumers are structured in a very service reflective manner, utilising a variety of prices (daily, capacity, demand,
volumetric, power factor) while our mass market prices are two part time of use, reflecting that peak usage is a general driver of investment over
time. We offer controlled load prices to residential end consumers in return for the ability to remotely manage their hot water cylinders. This pricing
approach signals the benefits to consumers of allowing us to control their hot water load and manage network congestion during peak periods
through lower price options. These pricing options provide incentives to end consumers, (but only to the extent that retailers reflect those incentives
to consumers) to shift demand away from peak periods and therefore reduce the need for future investment costs.
27 Available at https://www.vector.co.nz/about-us/regulatory/disclosures-electricity/asset-management-plan
22APPENDIX 3 – CONSISTENCY WITH PRICING PRINCIPLES
Principle (b): Recovery of any shortfall
Where prices that signal economic costs would under-recover target revenues, the shortfall should be made up by prices that least distort network
use.
Pricing based on avoidable costs would almost certainly under-recover allowed revenues as the majority of our costs are fixed, so do not vary with
the next unit of consumption. Our fixed costs are generally also sunk, so do not reduce if consumption reduces. Accordingly, the Pricing
Methodology attempts to recover allowed target revenues in a manner that is as least distortionary as possible to investment decisions. As we have
limited information of demand responsiveness by consumer group, we allocate the shortfall across all consumer groups.
Principle (c): Responsive to requirements of consumers
Prices should be responsive to the requirements and circumstances of end users by allowing negotiation to:
i. reflect the economic value of services;
ii. enable price/quality trade-offs.
We offer non-standard pricing in certain circumstances including where standard pricing would cause uneconomic bypass of the network.
Non-standard contractual arrangements are also able to address changes to the structure or level of prices (e.g. for atypical load patterns, or to
address particular by-pass or fuel substitute situations), and differing service levels (e.g. a higher level of redundancy, or priority response if an outage
occurs). The Pricing Methodology obliges us to take account of the issues described above when considering the design of a non-standard contract.
The Pricing Methodology does not provide specific incentives for investment in transmission and distribution alternatives. Where the connection of
new load requires investment in the network (e.g. new subdivisions) then the cost of that investment is recovered via capital contributions and/or
non-standard prices. Those prices provide the economic incentive for transmission and distribution alternatives to be investigated by the proponent
of the development. For example, a new subdivision that adapts new technologies to reduce load will not require the same level of network
investment.
23APPENDIX 3 – CONSISTENCY WITH PRICING PRINCIPLES
Principle (d): Pricing process
Development of prices should be transparent and have regards to transaction costs, consumer impacts, and uptake incentives.
We believe that a simple pricing structure enhances transparency. Costs are clearly identified and allocated to consumer groups on a simple and
transparent basis.
A simple pricing structure reduces the likelihood that changes in consumer behaviour will result in significant changes to cost allocations between
consumer groups. A simple pricing structure also makes it easier for consumers to understand and estimate their likely costs.
We are particularly conscious of the effect of our pricing on consumers and seek to implement a pricing framework that provides appropriate
incentives for consumers to continue to use our distribution services. Our decision to move mass market and general to two part time of use
followed extensive modelling of consumer effects for a range of potential pricing structures that considered the consumer impacts and incentives.
We have consulted with stakeholders, including retailers and Entrust, and obtained consumer insights through application of detailed data analytics
in the development of this Pricing Methodology and we continue to consult as appropriate when applying it and future methodologies. The
information we receive helps us to understand consumer drivers and preferences. We continue to undertake a range of trials so that we can
anticipate and respond to consumer’s requirements as technology changes the future of energy. As previously mentioned, we update and publish
our pricing roadmap on a regular basis.
In recent years we have simplified our distribution price structure so that the transaction costs on retailers, end consumers, and ourselves are
minimised. We offer retailers and Entrust the opportunity to comment on our proposed price structures each year. This provides an opportunity for
these stakeholders to identify any proposals that may increase transaction costs, and provides us the opportunity to address any concerns they may
have.
We offer the same network pricing to all end consumers irrespective of which retailer they use i.e. we do not provide any discounts or special terms
to end consumers who are supplied by a particular retailer. The non-differentiation of network prices is outlined in the agreements that we have
with retailers operating on our network.
We expect to continue to evolve our pricing as consumer’s respond to the range of choices they have through technological innovation and
increasing electrification, and regulatory reforms such as the Low User Regulations. Our intent is to provide a clear pathway to the new energy
future.
24APPENDIX 4 – DIRECTORS’ CERTIFICATION
25You can also read