Electrochemical Study on Corrosion Resistance of Epoxy-Coated Reinforcing Steel in Bridge Concrete - International Journal of ...
←
→
Page content transcription
If your browser does not render page correctly, please read the page content below
Int. J. Electrochem. Sci., 14 (2019) 9347 – 9354, doi: 10.20964/2019.09.85

                                                                           International Journal of
                                                                           ELECTROCHEMICAL
                                                                                   SCIENCE
                                                                                  www.electrochemsci.org

Short Communication
Electrochemical Study on Corrosion Resistance of Epoxy-
Coated Reinforcing Steel in Bridge Concrete
Yongcun Zhang

School of Civil and Transportation Engineering, Henan University of Urban Construction,
Pingdingshan, 467036, Henan, China
E-mail: zycpds001@163.com

Received: 3 May 2019 / Accepted: 1 July 2019 / Published: 5 August 2019

Chloride infiltration is one of the major causes for bridge damages in regions where deicing salts are
used. In this study, the role of epoxy-coated steel reinforcement in concrete to prevent corrosion is
evaluated. Electrochemical impedance spectroscopy (EIS) testing was performed between the embedded
steel by applying different potentials at various frequencies to evaluate the chloride ion effect and coating
condition. The value of impedance at 1 mHz shows that epoxy-coating has a major influence on
impedance values. This behaviour may be due to the combination of coating and corrosion related
impedance factors. On comparison, it was found that polarization resistance data and the impedance
values measured at the low frequency of 0.001 Hz for epoxy-coated reinforcing specimens were linear.
These results indicated that epoxy-coated rebar increased the corrosion protection against chloride
infiltration.

Keywords: Epoxy-coated reinforcing steel; Concrete bridge desks; Electrochemical impedance
spectroscopy; Chloride ion effect

1. INTRODUCTION

        Epoxy-coated reinforcement entered the market of corrosion protection from the early 1970s.
West Conshohocken in Pennsylvania was the first place to have a bridge constructed with epoxy-coated
reinforcement in 1973 [1].
        High usage of deicing salts resulted in the damage of bridges. This led to the need of a research
to develop methods that could protect the reinforced steel in concrete from corrosion. The National
Bureau of standards conducted experiments to evaluate different organic coatings used for the corrosion
protection of reinforcement [2]. The liquid and powder coatings were evaluated based on their resistance
to chemical reactivity, prolongation, structural integrity, bond strength along with electrochemical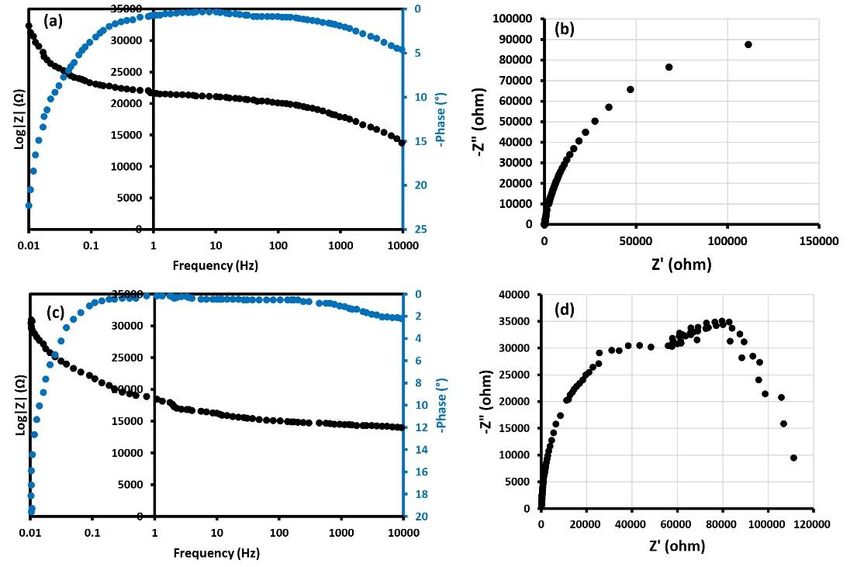
Int. J. Electrochem. Sci., Vol. 14, 2019                                                             9348

properties [3]. The best four Epoxy-powder coatings with the properties mentioned were magnified for
further research [4].
         Deicing salts are used to maintain the integrity of the bridges during winter [5]. However, these
salts especially chloride salt infiltrates into the reinforcement of concretes and causes corrosion [6, 7].
Corrosion of the reinforced steel in concrete is one of the vital assessment of concrete bridge decks [8].
Hence, a number of ways have been developed over the years to detect and assess corrosion potential
caused due to chloride infiltration [9]. Traditional electrical resistivity testing of concrete provides an
indirect measure of the ability of concrete to resist chloride penetration, where increasing resistivity
generally correlates to decreasing corrosion potential. This disadvantage is overcome by using an
advanced application, electrochemical impedance spectroscopy (EIS) [10]. Measurement of electrical
impedance is used by EIS to assess the corrosion potential of steel reinforced in concrete [11, 12].
Current is passed directly to the portion consisting of the surface up to the reinforced steel to measure
the amount of damage occurred by chloride infiltration on the entire concrete bridge. Existing research
on EIS has been largely focused on development of equivalent circuits for modelling and interpretation
of data collected in laboratory experimentation involving testing across a wide range of frequencies.
Though the information provided by EIS is specific, the process complexity and long associate testing
period makes EIS a difficult application. Specifically, as the use of individual impedance measurements
for characterizing bridge deck condition has already been demonstrated, investigations of the sensitivity
of EIS measurement for different frequencies corresponding to specific bridge deck properties that
influence corrosion of reinforcing steel are warranted. In this research, we were focused on determining
the electrochemical assessment of epoxy-coated steel reinforced in concrete bridges after exposure to
the environment. The sensitivity of EIS measurement for different frequencies corresponding to specific
bridge deck properties that influence corrosion of reinforcing steel were evaluated in this research.

2. MATERIALS AND METHOD

       For concrete slab preparation, Portland cement clinker was obtained and used to produce ASTM
Type III cement by a cement company. The cementitious materials used in the concrete mixture design
consisted of 82 percent Type III Portland cement and 18 percent Class F fly ash by weight. Table 1
provides the chemical composition and its specific gravity.

Table 1. Chemical analyses of the materials Clinker

            Silicon dioxide (SiO2)                                             22.3%
            Aluminum oxide (Al2O3)                                              4.5%
            Ferric oxide (Fe2O3)                                                3.4%
            Calcium oxide (CaO)                                                65.5%
            Sodium oxide (Na2O)                                                 0.4%
            Magnesium oxide (MgO)                                               2.9%
            Potassium oxide (K2O)                                               0.8%
            Equivalent alkali (Na2O+0.658K2O)                                   0.9%
            Phosphorous oxide (P2O5)                                            0.2%
            Titanium oxide (TiO2)                                               0.2%
            Sulphur trioxide (SO3)
Int. J. Electrochem. Sci., Vol. 14, 2019                                                                9349

        12 concrete slabs of 6×20×30 cm dimensions were made by using a concrete mixture of
maximum aggregate size 12 mm and slump size 80 mm. Equal volumes of sand and aggregates were
used to allow the mixture to consolidate upon external vibration. To accelerate corrosion activity, the
water to cement ratio was increased to 0.60 and the concrete cover over the reinforced steel was adjusted
to be 25 ± 2 mm. The slabs were allowed to moist-cure at room temperature for 14 days.
        A 100 mm stainless steel rod was placed in the centre of the concrete slab to act as a counter
electrode to measure corrosion rate. Necessary connections were then made to the devices by means of
joining the stainless steel rod and rebar using wires.
        The study comprised of bridge decks built with epoxy-coated reinforcement and bare steel and
the preparation of specimens. These samples were exposed to cyclic chloride solution to analyse their
corrosion response to measure the service life expectancy of epoxy-coated reinforcement. The concrete
samples were crushed to a powder by means of rock-crusing equipment and mortar-pestle till they passed
through #20 sieve. ASTM C 1152-90 was followed to measure acid soluble chloride content. EIS was
used to monitor the progress and properties of corrosion. A computer-operated Potentiostat and an
appropriate software were the major components of the test system.

3. RESULTS AND DISCUSSION

         The results of EIS test conducted in a simple solution on a metal sample with good quality coating
under controlled laboratory conditions can be easily interpreted. However, interpretation becomes
difficult when the electrolyte is a concrete medium and the coating is partially or fully disbanded due to
entrapment of moisture between the coating and substrate. These can lead to varying current distribution,
interface impedances and physical, chemical reactions. The complexity worsens, once corrosion activity
begins, as the corrosion products accumulate and form barriers for ion and electron flow.
         EIS test provides potential, impedance and phase angle data for the chosen frequency spectrum
[13]. These data can be plotted in different formats to know more about the corrosion state of the system,
coating saturation and resistivity of the concrete. A Bode plot is plotted with the modulus of impedance
and the phase angle as a function of the frequency of the alternating current [14]. On the other hand,
Nyquist plot presents real and imaginary components of the complex impedance response.
         In Nyquist plot, large arc shaped response of high real impedance often denote polarization
resistance [15]. From figure 1, for bare steel, even though the arc shaped response of high real impedance
are present, the plot has insufficient frequency range to describe the curve. Extrapolation of the data will
result in estimate errors. Hence, it is not advisable to estimate precise polarization values from the current
data. However, these data can be used to determine the time of corrosion initiation.
         The Bode and Nyquist plots for typical bare steel specimens at particular times before (Fig. 1a
and b) and after (Fig. 1c and d) corrosion initiation is presented in figure 1. A well-developed passive
layer is indicated by means of the Nyquist plot (Fig. 1b) slope which implies a high value of polarization
resistance. An apparent decrease in impedance mainly at low frequencies can be observed during the
occurrence of corrosion, due to the modulus of impedance in Bode plot (Fig. 1a) and the magnitude of
real and imaginary component in the Nyquist plot (Fig. 1b).
Int. J. Electrochem. Sci., Vol. 14, 2019 9350
Figure 1. (a) Bode and Phase Angle plots and (b) Nyquist plot of bare steel after 3 months’ exposure
times, (c) Bode plots and (d) Nyquist plot of bare steel after 12 months’ exposure times in 3%
sodium chloride
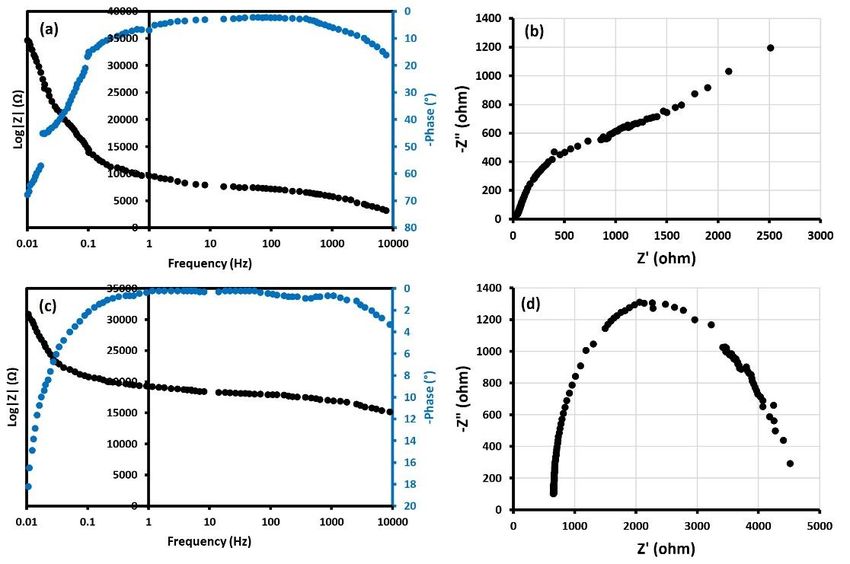
Figure 2. (a) Bode and Phase Angle plots and (b) Nyquist plot of epoxy-coated reinforcing steel after 3
months’ exposure times, (c) Bode plots and (d) Nyquist plot of epoxy-coated reinforcing steel
after 12 months’ exposure times in 3% sodium chloride
The same trends are observed in epoxy coated reinforcement specimens in Figure 2. The Bode
and Nyquist plots at particular times before (Fig. 2a and b) and after (Fig. 2c and d) corrosion initiation
correlates with the observations by Sagüés and Zayed for partially disbonded coatings in concrete. The
impedance in the complex plane prior to corrosion (Fig. 2b) can either denote a system under diffusionInt. J. Electrochem. Sci., Vol. 14, 2019 9351
control or a configuration of transmission line, moisture entrapped under the coating. As seen earlier, as
corrosion occurs, a drastic decrease in impedance mainly at low frequencies can be observed. There is
also a decrease in the magnitude of the phase angle, but becomes complex as more corrosion and coating
deterioration activities occur.
In figure 2, the semi-circle at high frequency indicated that a conductive path has been formed.
The circle has small diameter due to low coating pore resistance. The large incomplete semicircles at
low frequencies denotes the charge transfer reaction. The diffusion controlled corrosion process in the
metal substrate was indicated by the diffusion tail following the second semi-circle. The phase angle
diagram has a phase angle shift at the low frequency attributing to the diffusion process.
The potential values for active corrosion for both bare and epoxy coated steel appears to be more
negative than -350 mV. Active corrosion can only be assumed when there is a corresponding decrease
in impedance. It was observed that the epoxy coated bars had a strong effect on impedance when the
value was measured at 1 mHz. It may be due to combination of coating and corrosion related impedance
factors. However, the low frequency impedance reduction compliments the variations in open-circuit
potential. They indicate when corrosion occurs in the specimen. The same is true for partially or fully
disbanded coating.
Overall, non-corroding epoxy coated reinforced specimens had an impedance modulus on the
order of 106 ohms at 1 mHz. A few specimens had high impedance as 108 ohms with corresponding
potential values, positive than -200 mV. Whereas actively corroding epoxy coated reinforced specimen
had impedance modulus less than 104 ohms.
Figure 3. Schematic diagram of proposed equivalent circuit.
The electrochemical impedance data gained from this corrosion system can be analyzed and
taken by the equivalent circuit model demonstrated in Figure 3 [16, 17]. The corrosion resistance of
solution, the resistance of the protective film on the reinforcing steel surface and the charge transfer
resistance of the corrosion process are signified by Rs, R1 and R2 respectively. CPE1 is the constant
phase angle element that includes the film capacitance and deviation parameter n1, while the
constant phase angle element CPE2 includes the double-layer capacitance and deviation
parameter n2. The fitted data of the parameters in the equivalent circuit model for bare and epoxy-coated
reinforcing steel are listed in Table 2 and Table 3, respectively.Int. J. Electrochem. Sci., Vol. 14, 2019 9352
Table 2. Electrochemical parameters from the fitting using the equivalent circuit in Figure 3 for bare
reinforcing steel under different immersion times
Exposure times (months) Rs (Ω cm2) CPE1 (μF cm-2) R1 (Ω cm2) CPE2 (μF cm-2) R2 (Ω cm2)
3 5.96 53.24 998 189.4 582
12 40.25 39.14 2240 68.2 1356
Table 3. Electrochemical parameters from the fitting using the equivalent circuit in Figure 3 for epoxy-
coated reinforcing steel under different immersion times
Exposure times (months) Rs (Ω cm2) CPE1 (μF cm-2) R1 (kΩ cm2) CPE2 (μF cm-2) R2 (kΩ cm2)
3 9.86 47.52 112.24 243.6 73.41
12 8.42 44.38 58.92 82.9 34.27
Table 2 and Table 3 represent the fitting parameters based on the equivalent circuit shown in Fig.
3. It can be found that the passive film resistance R1 increased as the immersion times increases, which
reflects that the protective properties of the passive film become strong. Comparing CPE1 and CPE2, it
was found that CPE1 are lower than CPE2 [18]. This represents that the formed passive film is thin and
the double layer at the interfaces has a high capacitive behavior. For epoxy-coated reinforcing steel under
immersion times of 12 months, the passive film resistance decreases which can be attributed to the
creation of damage on the surface of epoxy-coated reinforcing steel.
Figure 4 indicates current density of the bare and epoxy-coated reinforcing steel in 3% sodium
chloride. Epoxy coated bars are passive in nature, as they are seen with a current density of about 0.01
µA/cm2. This value is negligible with respect to life expectancy. At the same time, bare steel bars has a
current density of 3 µA/cm2 indicating high corrosion activity taking place in the system [19]. The time
required for a concrete slab with bare steel bars to crack was 12 months when subjected to 3% sodium
chloride exposure. The epoxy coated steel concrete bars remained intact.
The passive current density must be low enough to prepare a lower potential and to protect the
steel from chloride initiated attack by keeping steel potential below the critical value. In this research,
epoxy coated steel concrete bars revealed lower values of corrosion current density during one year in
comparison with the results of other studies [20-23] which introduces a new approach to improve the
corrosion resistance of structures.
On comparison, it was found that polarization resistance data and the impedance values measured
at the low frequency of 0.001 Hz for epoxy-coated reinforcing specimens are linear in nature, as seen in
figure 5. The only exception is one value with the polarization resistance being relatively higher than the
impedance, 108 ohm cm2 and 104 ohms, respectively.Int. J. Electrochem. Sci., Vol. 14, 2019 9353
Figure 4. Current density of the bare and epoxy-coated reinforcing steel at different exposure times in
3% sodium chloride
Figure 5. Polarization resistance vs. impedance of epoxy-coated reinforcing samples at 1 mHz in 3%
sodium chloride
On the whole, it is clear that the coating pore resistance, charge transfer resistance, and the
diffusion impedance together determine the polarization resistance of epoxy coated reinforced steel. As
the technique is valid only when metal oxidation occurs at anode, the corrosion rates obtained may not
be true. The corrosion mechanism to study the steel reinforced in concrete is more complex than a general
metal oxidation process.
4. CONCLUSIONS
Bridge construction and concrete properties that undergoes chloride infiltration makes use of
epoxy coated rebar. EIS testing was performed between the embedded steel by applying different
potentials at various frequencies to evaluate the chloride ion effect and coating condition. The value of
impedance at 1 mHz shows that epoxy-coating has a major influence on impedance values. This
behaviour may be due to the combination of coating and corrosion related impedance factors. It is alsoInt. J. Electrochem. Sci., Vol. 14, 2019 9354
clear that the coating pore resistance, charge transfer resistance, and the diffusion impedance together
determine the polarization resistance of epoxy coated reinforced steel.
ACKNOWLEDGEMENTS
This work is supported by the Key Research Projects of Henan Higher Education Institutions “Research
on Concrete Drying-Shrinkage and Self-Shrinkage Deformation Based on Microscopic analysis” (No.
17A560017).
References
1. D.P. Gustafson, CORCON-97: Corrosion and Its Control., 1 (1997) 46.
2. P. Pokorný, P. Tej and M. Kouřil, Construction and Building Materials, 132 (2017) 271.
3. L.K. Prasad, J.W. McGinity and R.O. Williams III, International journal of pharmaceutics, 505
(2016) 289.
4. D. Piazza, A.F. Baldissera, S.R. Kunst, E.S. Rieder, L.C. Scienza, C.A. Ferreira and A.J. Zattera,
Materials Research, 18 (2015) 897.
5. J. Zhang, P. Li, Y. Mao, Z. Dong and Z. Jiang, The Open Civil Engineering Journal, 12 (2018)
1.
6. S. Kakooei, H.M. Akil, A. Dolati and J. Rouhi, Construction and Building Materials, 35 (2012)
564.
7. S. Kakooei, H.M. Akil, M. Jamshidi and J. Rouhi, Construction and Building Materials, 27
(2012) 73.
8. S. Garrett, Materials Evaluation, 77 (2019) 479.
9. D. Ribeiro and J. Abrantes, Construction and Building Materials, 111 (2016) 98.
10. F. Husairi, J. Rouhi, K. Eswar, A. Zainurul, M. Rusop and S. Abdullah, Applied Physics A, 116
(2014) 2119.
11. Q. Liu, B. Chen and Y. Li, International journal of electrochemical science, 11 (2016) 10238.
12. K. Tang, Cement and Concrete Research, 100 (2017) 445.
13. Z. Brytan and J. Niagaj, Applied Surface Science, 388 (2016) 160.
14. A.J. Lucio and S.K. Shaw, Analyst, 143 (2018) 4887.
15. T. Liu, X. Li, H. Nie, C. Xu and H. Zhang, Journal of Power Sources, 286 (2015) 73.
16. T. Ji, F. Ma, D. Liu, X. Zhang, X. Zhang and Q. Luo, International Journal of Electrochemical
Science, 13 (2018) 5440.
17. Z. Tao, S. Zhang, W. Li and B. Hou, Corrosion science, 51 (2009)
18. B. Li, Y. Huan and W. Zhang, International Journal of Electrochemical Science, 12 (2017)
10402.
19. F. Tang, G. Chen, J.S. Volz, R.K. Brow and M.L. Koenigstein, Cement and Concrete Composites,
35 (2013) 171.
20. D. Darwin, J. Browning and W.D. Lindquist, Cement, Concrete and Aggregates, 26 (2004) 1.
21. A. Agrawal, Z. Yi, S. Alampalli, M. Ettouney, L. King, K. Hui and M. Patel, Practice Periodical
on Structural Design and Construction, 14 (2009) 152.
22. M.A. Issa and A.A. Khalil, PCI journal, 55 (2010) 82.
23. P.D. Bartholomew, W.S. Guthrie and B.A. Mazzeo, Review of Scientific Instruments, 83 (2012)
085104.
© 2019 The Authors. Published by ESG (www.electrochemsci.org). This article is an open access
article distributed under the terms and conditions of the Creative Commons Attribution license
(http://creativecommons.org/licenses/by/4.0/).You can also read