Elucidating the involvement of apoptosis in postmortem proteolysis in porcine muscles from two production cycles using metabolomics approach - Nature
←
→
Page content transcription
If your browser does not render page correctly, please read the page content below
www.nature.com/scientificreports
OPEN Elucidating the involvement
of apoptosis in postmortem
proteolysis in porcine muscles
from two production cycles using
metabolomics approach
Danyi Ma1,5, Dong Ho Suh2,5, Jiaying Zhang1, Yufan Chao1, Alan W. Duttlinger1,3,
Jay S. Johnson3, Choong Hwan Lee2,4* & Yuan H. Brad Kim1*
Apoptosis has been suggested as the first step in the process of conversion of muscle into meat.
While a potential role of apoptosis in postmortem proteolysis has been proposed, the underlying
mechanisms by which metabolome changes in muscles would influence apoptotic and proteolytic
process, leading to meat quality variation, has not been determined. Here, apoptotic and proteolytic
attributes and metabolomics profiling of longissimus dorsi (LD) and psoas major (PM) muscles in
pigs from two different production cycles (July–Jan vs. Apr–Sep) were evaluated. PM showed higher
mitochondrial membrane permeability (MMP), concurrent with less extent of calpain-1 autolysis and
troponin T degradation and higher abundance of HSP27 and αβ-crystallin compared to LD (P < 0.05).
Apr–Sep muscles showed concurrence of extended apoptosis (indicated by higher MMP), calpain-1
autolysis and troponin T degradation, regardless of muscle effects (P < 0.05). Metabolomics profiling
showed Apr–Sep muscles to increase in oxidative stress-related macronutrients, including 6-carbon
sugars, some branched-chain AA, and free fatty acids. Antioxidant AA (His and Asp) and ascorbic acid
were higher in July–Jan (P < 0.05). The results of the present study suggest that early postmortem
apoptosis might be positively associated with pro-oxidant macronutrients and negatively associated
with antioxidant metabolites, consequently affecting meat quality attributes in a muscle-specific
manner.
Postmortem proteolysis plays important role in muscle structure fragmentation affecting tenderness and/or
water-holding capacity1,2. Proteolysis, however, can only explain limited portion of quality variations in p ork3.
Given the exact mechanisms by which postmortem aging governs palatability development are still not fully
understood, regulatory factors of postmortem proteolysis require further exploration. Apoptosis, or programmed
cell death, refers to a finely regulated and controlled process by which cells recruit innate enzyme systems to
break down functional and/or structural compartment to terminate cellular life c ycle4. Apoptosis was recently
proposed as the very first phase in muscle-meat conversion process, and probably has active interaction with
postmortem proteolysis4–6. Therefore, apoptotic impact on development of organoleptic and/or perceptional
quality attributes has become a growing research interest. Notably, damage of mitochondria normal function
triggers the release of pro-apoptotic factors7,8. As mitochondria are the central organelles for energy metabolism
and redox regulation, it is reasonable to postulate that metabolism background of skeletal muscles could evolve
in antemortal apoptosis response.
It is well acknowledged that muscle fiber types, which range from glycolytic fast twitch (Type IIB) to oxidative
slow twitch (Type I), may be key contributors to meat quality development9. Oxidative muscles were reported
to have inferior tenderization potential, accompanied with decreased protease activity10. As such, postmortem
1
Department of Animal Sciences, Purdue University, West Lafayette, IN 47907, USA. 2Department of Bioscience
and Biotechnology, Konkuk University, Seoul 05029, South Korea. 3USDA-ARS Livestock Behavior Research
Unit, West Lafayette, IN 47907, USA. 4Research Institute for Bioactive‑Metabolome Network, Konkuk University,
Seoul 05029, South Korea. 5These authors contributed equally: Danyi Ma and Dong Ho Suh. *email: chlee123@
konkuk.ac.kr; bradkim@purdue.edu
Scientific Reports | (2021) 11:3465 | https://doi.org/10.1038/s41598-021-82929-3 1
Vol.:(0123456789)www.nature.com/scientificreports/
metabolism features need to be profiled in different muscle types to establish linkage between postmortem
metabolism, apoptosis, and subsequent proteolysis to shed lights on updated views of muscle to meat conversion.
Furthermore, in our recent study, the production batch effect in animal growth and productivity and meat quality
attributes were f ound11. Accordingly, one batch of pigs that were weaned in July 2016 and harvested in January
2017 (July–Jan) exhibited inferior productivity shown as decreased hot carcass weight and body fat, compared to
another batch of pigs that were weaned in April 2017 and harvested in September 2017 (Apr–Sep)11. Moreover,
longissimus dorsi (LD) and psoas major (PM) muscles in the July–Jan group had higher Warner–Bratzler shear
force, thaw-purge loss, and cook loss compared to the Apr–Sep group11. These findings postulate that discrep-
ancies in live-animal handling by different production environment/season may lead to overall shifted whole-
body metabolism, appeared as altered animal growth. Differently regulated metabolism may lead to distinct
mitochondria activities and antemortal apoptotic responses, causing inconsistency in meat quality development.
Previous studies have shown the potential of metabolomics technology to elucidate molecular mechanism of
meat quality development under various c onditions12,13. In this regard, high-throughput metabolomics platform
and various bioinformatics tools could be applied to identify metabolism fingerprints that were related to apopto-
sis, and establish linkages between postmortem energy metabolism, apoptosis, and proteolysis in a muscle-meat
conversion prospective. Therefore, the objective of the current study was to evaluate apoptotic and proteolytic
characteristics and metabolome changes of porcine muscles from two production replicates. We hypothesize that
metabolism features can be altered due to muscle type difference or live-animal production batch effects, which
could have further impacts on postmortem apoptotic and proteolytic process, leading to meat quality variation.
Two porcine muscles (LD and PM) were selected, because they were known to have distinct differences in fiber
composition and metabolic features. This study is further elaboration of our recent study11, where impacts of
muscle type and production batch effect on animal growth and productivity, carcass characteristics, and pork
quality attributes were determined in the same porcine muscle samples.
Results
Calpain‑1 and myofibrillar protein degradation. The extent of calpain-1 autolysis by western blot
analysis was determined as quantifying three bands (80, 78, and 76 kDa; Fig. 1). Overall, no significant inter-
actions among production replicate, muscle or aging effects were observed on calpain-1 autolysis. Regardless
of replicate or muscle effects, intact calpain-1 (80 kDa) and partial autolyzed 78 kDa subunits were decreased
(P < 0.05, Table 1), while its 76 kDa subunits increased in abundance (P < 0.005; Table 1). Particularly, produc-
tion replicate effect affected protein abundance of all three bands (Table 1), where Apr–Sep exhibited increased
76 kDa subunit (P = 0.001) and decreased 78 kDa (P = 0.054) and 80 kDa subunits (P = 0.002) compared to July–
Jan counterparts. Within both aging time point (1 day vs. 7 days postmortem), the LD from both Apr–Sep and
July–Jan were found to have lower abundance of un-autolysed calpain-1 80 kDa bands (P < 0.01) and partial
autolyzed 78 kDa bands (P < 0.001) and higher abundance of fully autolyzed 76 kDa product (P < 0.0001) than
the PM muscles of the same production replicate (Table 1).
The abundance of intact and degradation products of two myofibrillar proteins, desmin and troponin T, were
analyzed (Fig. 1 and Table 1). No significant three-way interactions were found. Intact product of desmin was
significantly affected by production replicates and aging times, but not muscle type. Intact desmin was decreased
over aging (P < 0.001), which was found in overall greater abundance in July–Jan weaned pigs compared with
Apr–Sep replicates (P = 0.002; Table 1), regardless of aging time or muscle type. Conversely, muscle type effect
was observed in desmin degradation, where LD muscles showed less desmin degradation products compared to
the PM muscles (P = 0.046). Intact product of troponin T were decreased over aging (P < 0.01). While troponin
T intact product was not responsive to any of the treatment factors, degradation products, which were quanti-
fied at 35 kDa and 30 kDa, were decreased with aging (P < 0.05, Table 1). The 35 kDa bands were affected by the
replicate × aging (R × A) interaction: both replicates showed similar levels at 1 day postmortem aging, however,
Apr–Sep showed further extended degradation at 7 days postmortem compared to July–Jan samples (Fig. 2,
P < 0.05). Moreover, a muscle × aging interaction tended to affect troponin T degradation product at 30 kDa,
where LD showed markedly higher troponin T degradation product than PM at 7 days aging (Fig. 2, P < 0.05).
Mitochondria membrane permeability (MMP) and cytochrome c. MMP were determined to eval-
uate the extent of structural integrity loss of mitochondria membranes in LD and PM samples. Significant pro-
duction replicate and muscle type effects on MMP were found (P < 0.0001, Table 1). Apr–Sep muscles showed
increased MMP compared to July–Jan replicate, suggested higher mitochondrial membrane integrity in July–Jan
compared to Apr–Sep (P < 0.001). In terms of muscle effect, LD had lower MMP than PM, meaning more inte-
grated mitochondrial membrane compared to PM counterpart (P < 0.001).
Western blots were performed to evaluate cytochrome c abundance in LD and PM samples from differ-
ent production replicates and aging times. PM samples had higher cytochrome c abundance compared to LD
(P < 0.0001, Table 1). However, no significant difference in cytochrome c abundance was found within production
replicates (P > 0.05; Table 1).
Small heat shock proteins. Western blots in HSP27 and αβ-crystallin showed single bands without degra-
dation products (Table 1 and Fig. 1). Neither aging time nor production replicate influenced αβ-crystallin abun-
dance (Table 1). However, there was a significant muscle effect, where abundance of αβ-crystallin was higher in
PM than LD (P = 0.029, Table 1). HSP27 abundance, on the other hand, was affected by replicate × muscle (R × A)
and muscle × aging (M × A) interactions (Fig. 3): LD had decreased HSP27 in July–Jan group, but PM did not
change over the two replications; also, HSP27 decreased over aging in both LD and PM, while PM had further
Scientific Reports | (2021) 11:3465 | https://doi.org/10.1038/s41598-021-82929-3 2
Vol:.(1234567890)www.nature.com/scientificreports/
Figure 1. (a) A representative set of western blot images showing 1 day vs. 7 days postmortem change of
desmin, troponin T, calpain-1, HSP27, αβ-crystallin and cytochrome c of porcine LD (longissimus dorsi) and
PM (psoas major) muscles with two production replicates. Reference: consistently use a 45 min postmortem
LD for calpain-1 and a 7 days postmortem LD for desmin, troponin T, HSP27, αβ-crystallin and cytochrome
c. July–Jan: Pigs weaned in July 2016 and harvested in January 2017; Apr–Sep: Pigs weaned in April 2017 and
harvested in September 2017. All western blots were performed in separate gels in independent manners (please
see supplementary information for the entire western blot images). (b–l) Densitometry analysis of each protein
bands.
Scientific Reports | (2021) 11:3465 | https://doi.org/10.1038/s41598-021-82929-3 3
Vol.:(0123456789)www.nature.com/scientificreports/
Replicate (R)d Muscle (M)e Aging (A) P-value
Parameters a,b,c
Apr–Sep July–Jan LD PM 1 day 7 days S.E.Mf R M A
MMP 0.082 0.092 0.092 0.081 0.094 0.079 0.002 < .001 < .001 < .0001
Cytochrom c 1.76 1.91 0.79 2.88 1.99 1.68 0.22 0.20 < .0001 0.003
HSP27 0.90 0.78 0.61 1.07 0.98 0.70 0.08 0.018 < .0001 < .0001
Αβ-crystallin 1.75 1.42 1.39 1.78 1.74 1.43 0.30 0.071 0.029 0.092
Calpain-1 80 kDa 0.16 0.20 0.16 0.20 0.19 0.17 0.02 0.002 0.004 0.025
Calpain-1 78 kDa 0.38 0.41 0.35 0.44 0.41 0.38 0.02 0.054 < .0001 0.050
Calpain-1 76 kDa 0.46 0.39 0.49 0.36 0.40 0.45 0.03 0.001 < .0001 0.005
Troponin T intact 1.72 1.73 2.14 1.32 2.71 0.75 0.48 0.98 0.071 0.002
Troponin T Degradation 35 kDa 1.04 0.68 0.95 0.78 0.44 1.29 0.19 0.038 0.17 < .001
Troponin T Degradation 30 kDa 0.92 0.43 1.05 0.30 0.32 1.03 0.40 0.10 0.039 0.037
Desmin intact 1.21 1.59 1.22 1.58 1.58 1.22 0.17 0.002 0.094 < .001
Desmin degradation 39 kDa 1.02 1.21 0.99 1.24 1.08 1.15 0.12 0.085 0.046 0.22
Table 1. Effect of different production replicates and muscle types on proteolysis and apoptosis features
of porcine skeletal muscles over 7-day postmortem aging. a MMP (mitochondrial membrane permeability)
was obtained by measuring UV absorption peak at 540 nm of the isolated mitochondria suspensions, higher
number indicates lower MMP. b Protein abundance except calpain-1 was expressed as relative ratio of band
intensity compared to the corresponding bands of the reference samples. c Three bands of 80, 78, and 76 kDa of
calpain-1 were quantified and expressed as the ratio of each band that relative to the total intensity. d Replicate:
July–Jan, pigs weaned in July 2016 and harvested in January 2017; Apr–Sep: pigs weaned in April 2017 and
harvested in September 2017. e Muscle: LD, longissimus dorsi; PM, psoas major. f Pooled standard errors of
means.
(a) 1d 7d (b) 1d 7d
2 2
a a
Troponin T 35 kDa band intensity
1.8 1.8
Troponin T 30 kDa intensity
1.6 1.6
1.4 1.4
1.2 1.2 b
1 1
0.8 0.8 c
b c
0.6 b 0.6
b
0.4 0.4
0.2 0.2
0 0
LD PM Apr-Sep July-Jan
Figure 2. Densitometric analysis of troponin T degradation of porcine LD (longissimus dorsi) and PM
(psoas major) muscles with two production replicates. A. Muscle by aging interaction (P = 0.02) on troponin
T degradation product intensity at 30 kDa; B. Replicate by aging interaction tendency (P = 0.054) on troponin
T degradation product intensity at 35 kDa; Results were displayed as means ± standard error. (a–c) Means
with different number are significantly different (P < 0.05). July–Jan: Pigs weaned in July 2016 and harvested in
January 2017; Apr–Sep: Pigs weaned in April 2017 and harvested in September 2017.
degradation compared to LD. Even though PM had further degradation, the overall abundance was higher in
PM, regardless of aging time, which was corroborated with αβ-crystallin.
Metabolomics analysis. Metabolomics profiling of LD and PM samples from both production replica-
tions were obtained using GC-TOF–MS/MS platform with multivariate statistical analysis. The PCA score plots
indicated that all experimental groups were notably different from each other, as it showed separation of LD vs.
PM muscles from July–Jan vs. Apr–Sep groups (Fig. 4a). The samples primarily separated according to muscle
type along the first principal component (PC1), which explained 25.9% of the total variance of the model. In
addition, PC2 could explain 12.3% of the total variance of the data set, which separated July–Jan and Apr–Sep
muscle samples (Fig. 4a).
While the PLS-DA score plot showed a pattern similar to PCA score plots, this model was used to identify
metabolites that differentially presented between muscle and/or production replicate groups (Fig. 4b, R2X = 0.559,
R2Y = 0.981, Q2 = 0.835, P < 0.05). Overall, the first and second PLS component (PLS1 and PLS2) accounted for
Scientific Reports | (2021) 11:3465 | https://doi.org/10.1038/s41598-021-82929-3 4
Vol:.(1234567890)www.nature.com/scientificreports/
(a) LD PM (b) 1d 7d
1.2 a a
1.6
a
1.4
1
ab
HSP27 Band intensity
1.2
HSP27 band intensity
0.8 b
b
1 bc
0.6 0.8 c
0.6
0.4
0.4
0.2
0.2
0 0
Apr-Sep July-Jan LD PM
Figure 3. Densitometric analysis of HSP27 of porcine LD (longissimus dorsi) and PM (psoas major) muscles
with two production replicates. (a) Muscle by replicate interaction (P = 0.024); (b) Muscle by aging interaction
(P = 0.009); Results were displayed as means ± standard error. (a–c) Means with different number are
significantly different (P < 0.05). July–Jan: Pigs weaned in July 2016 and harvested in January 2017; Apr–Sep:
Pigs weaned in April 2017 and harvested in September 2017.
(a) (b)
150 150
100 100
50 50
PLS2 (12.3%)
PC2 (12.3%)
0 0
-50 -50
-100 -100
-150 -150
-250 -200 -150 -100 -50 0 50 100 150 200 250 -250 -200 -150 -100 -50 0 50 100 150 200 250
PC1 (25.9%) PLS1 (25.6%)
Figure 4. PCA and PLS-DA score plots of metabolome profiling porcine LD (longissimus dorsi) and PM (psoas
major) muscles from two production replicates. The plots were generated using the SIMCAP-P + software
(version 12.0, Umetrics, Umea, Sweden); (a) PCA score plot, R 2X = 0.49, Q2 = 0.336; (b) PLS-DA score plot,
2 2 2
R X = 0.559, R Y = 0.981, Q = 0.835, P < 0.05. July–Jan: Pigs weaned in July 2016 and harvested in January 2017;
Apr–Sep: Pigs weaned in April 2017 and harvested in September 2017.
25.6% and 12.3% of the possible variance, respectively (Fig. 4). For the effect of muscle, 64 metabolites were
differentially presented in LD vs. PM (VIP1 > 1, from PLS1); for the effect of replicate, 84 metabolites were dif-
ferentially presented July–Jan vs. Apr–Sep (VIP2 > 1 from PLS2). For all the differentially presented metabolites,
major groups can be categorized into carbohydrates, organic acids, free amino acids (AA), fatty acids/lipids, and
nucleotide-related metabolites (Table 2). In Apr–Sep, higher abundance of macronutrients was found, including
6-carbon sugars such as glucose and fructose, 14–18 carbon free fatty acids (FFA), and branched-chain amino
acids (BCAA) including Leu, Ile, and Val.
On the other hand, July–Jan muscles showed elevated antioxidant compounds, such as assortments of redox
regulating AA and ascorbic acids (Table 2). Especially, aspartic acid and histidine were higher in both LD and PM
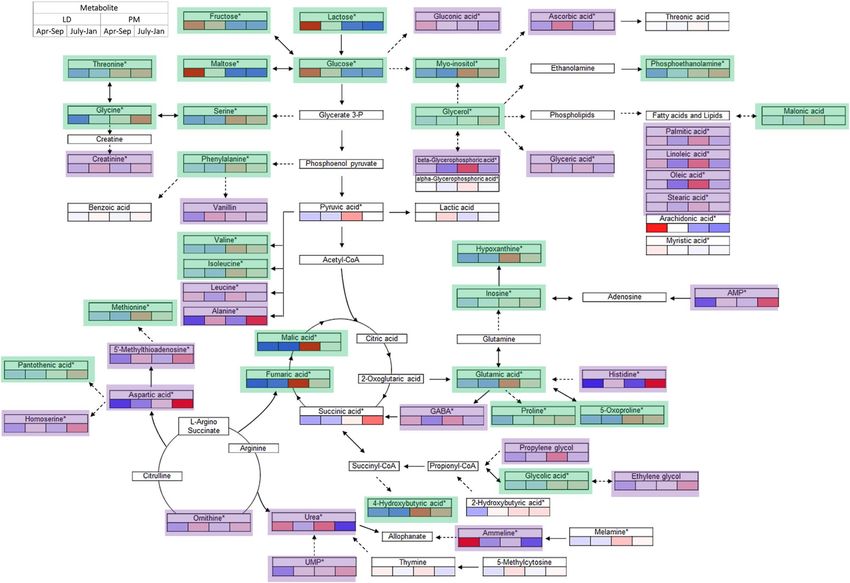
of July–Jan, while γ-amino-butyric acid (GABA) and β-glycerophosphoric acid were decreased. Further pathway
analysis suggested that Apr–Sep muscles went through further extent of cellular catabolism, including urea cycle
and ATP degradation (Fig. 5). These observations corroborated with production replication discrepancies in
proteolytic and apoptotic features, with detailed biological interpretations elaborated in the following section.
Scientific Reports | (2021) 11:3465 | https://doi.org/10.1038/s41598-021-82929-3 5
Vol.:(0123456789)www.nature.com/scientificreports/
RT Mass VIP[1] (muscle) VIP[2] (replicates) Metabolitesa Higher in muscle Higher in replicate
Amino acids
9.54 156 1.92 1.47 5-Oxoproline PM Apr–Sep
8.68 174 0.84 1.68 Alanine LD July–Jan
9.08 218 1.31 1.05 Aminomalonic acid LD July–Jan
9.1 232 1.32 1.13 Aspartic acid PM July–Jan
9.83 329 0.07 1.07 Creatinine July–Jan
9.56 174 0.25 1.22 GABA Apr–Sep
10.26 246 1.62 1.45 Glutamic acid PM Apr–Sep
7.61 174 1.57 1.41 Glycine PM July–Jan
15.97 159 0.6 1.09 Histidine July–Jan
7.48 158 1.28 1.08 Isoleucine PM Apr–Sep
6.06 188 0.23 1.09 Leucine Apr–Sep
9.48 176 1.48 1.33 Methionine PM Apr–Sep
11.75 174 0.42 1.04 Ornithine July–Jan
10.37 218 1.4 1.13 Phenylalanine PM Apr–Sep
7.53 216 1.25 0.94 Proline PM July–Jan
8.09 204 1.67 1.25 Serine PM Apr–Sep
8.34 219 1.72 1.23 Threonine PM July–Jan
6.7 218 1.45 1.14 Valine PM Apr–Sep
Carbohydrates
12.28 307 1.99 1.43 Fructose LD Apr–Sep
12.21 103 2 1.43 Fructose LD Apr–Sep
13.1 333 1.4 1.19 Gluconic acid LD Apr–Sep
12.41 160 1.83 1.36 Glucose LD Apr–Sep
12.53 160 1.85 1.39 Glucose LD Apr–Sep
12.31 160 1.96 1.43 Glucose LD Apr–Sep
7.82 189 0.2 1.01 Glyceric acid Apr–Sep
7.3 205 1.34 1.05 Glycerol PM July–Jan
17.1 204 1.31 1.03 Lactose LD Apr–Sep
16.91 204 1.32 1.03 Lactose LD Apr–Sep
17.41 361 1.38 1.08 Maltose LD Apr–Sep
17.27 361 1.44 1.1 Maltose LD Apr–Sep
13.66 191 1.97 1.58 Myo-inositol PM Apr–Sep
11 246 0.07 1.48 Carbohydrate 1 Apr–Sep
12.9 204 1.64 1.18 Carbohydrate 10 LD Apr–Sep
13.25 318 2.01 1.51 Carbohydrate 11 PM Apr–Sep
14.62 315 1.82 1.35 Carbohydrate 12 LD July–Jan
14.75 204 1.65 1.26 Carbohydrate 13 LD July–Jan
14.97 315 2 1.44 Carbohydrate 15 LD Apr–Sep
14.98 387 2.01 1.44 Carbohydrate 16 LD Apr–Sep
15.05 160 1.98 1.42 Carbohydrate 17 LD Apr–Sep
15.15 387 1.97 1.41 Carbohydrate 18 LD Apr–Sep
15.22 204 1.63 1.27 Carbohydrate 19 LD July–Jan
11.74 204 1.63 1.25 Carbohydrate 2 LD Apr–Sep
15.34 387 1.85 1.34 Carbohydrate 21 LD Apr–Sep
11.77 217 1.73 1.24 Carbohydrate 3 LD July–Jan
11.85 204 1.76 1.32 Carbohydrate 4 LD Apr–Sep
11.98 217 1.16 1.1 Carbohydrate 5 LD Apr–Sep
12.34 204 1.68 1.21 Carbohydrate 7 LD Apr–Sep
12.66 319 1.28 1.25 Carbohydrate 8 PM Apr–Sep
12.9 217 1.47 1.09 Carbohydrate 9 LD Apr–Sep
Lipids
15.7 205 0.65 1.12 1-O-hexadecylglycerol Apr–Sep
11.39 357 0.65 1.01 alpha-Glycerophosphoric acid Apr–Sep
15.12 117 1.49 1.2 Arachidonic acid Apr–Sep
11.13 243 0.98 1.83 beta-Glycerophosphoric acid Apr–Sep
Continued
Scientific Reports | (2021) 11:3465 | https://doi.org/10.1038/s41598-021-82929-3 6
Vol:.(1234567890)www.nature.com/scientificreports/
RT Mass VIP[1] (muscle) VIP[2] (replicates) Metabolitesa Higher in muscle Higher in replicate
17.2 399 0.38 1.18 Glycerol monostearate
16.07 218 0.66 1.2 Glyceryl 2-palmitate Apr–Sep
17.02 218 0.16 1.1 Glyceryl 2-stearate
14.2 337 0.42 1.89 Linoleic acid Apr–Sep
15.24 343 1.03 0.82 Myristic acid
15.34 128 0.51 1.15 Oleamide July–Jan
14.22 199 1.07 1.98 Oleic acid Apr–Sep
13.17 117 0.54 1.99 Palmitic acid Apr–Sep
11.54 299 1.52 1.12 Phosphoethanolamine Apr–Sep
14.35 341 0.85 1.14 Stearic acid Apr–Sep
Purine/pyrimidine
6.54 166 1.41 1.07 3-Hydroxy-6-methylpyridine LD
7.9 241 1.55 1.55 5-Hydroxymethyluracil PM Apr–Sep
17.42 236 0.86 1.6 5′-Methylthioadenosine July–Jan
19.13 169 1.19 1.44 Adenosine 5′-monophosphate PM July–Jan
17.3 324 1.66 1.24 Guanosine PM July–Jan
11.74 265 1.72 1.37 Hypoxanthine PM Apr–Sep
16.32 230 1.44 1.08 Inosine PM July–Jan
18.65 169 1.27 1.27 Uridine 5′-monophosphate PM July–Jan
Organic acid
6.11 117 1.3 1.07 2-Hydroxybutyric acid PM July–Jan
9.68 247 1.67 1.49 2-Hydroxyglutaric acid PM Apr–Sep
6.62 131 0.99 1.06 3-Hydroxy-3-methylbutyric acid PM Apr–Sep
6.86 233 1.65 1.33 4-Hydroxybutyric acid PM Apr–Sep
7.91 245 1.55 1.37 Fumaric acid PM Apr–Sep
12.76 361 1.08 0.99 Galactonic acid 1,4-lactone LD July–Jan
5.23 177 1.43 1.05 Glycolic acid PM
8.88 218 0.86 1.52 Homoserine July–Jan
9.21 233 1.69 1.65 Malic acid PM Apr–Sep
5.36 217 1.32 1.26 Pyruvic acid PM Apr–Sep
7.63 247 1.68 1.33 Succinic acid PM July–Jan
7.14 189 0.54 1.62 Urea Apr–Sep
12.7 332 0.27 1.59 Ascorbic acid July–Jan
Others
11.65 328 0.93 1.11 Ammeline Apr–Sep
10.23 255 1.18 0.99 Melamine PM
10.44 117 0.53 1.18 N.I 5
12.52 305 1.6 1.25 N.I 6
12.95 291 1.27 0.94 Pantothenic acid PM
Table 2. Differentially presented metabolites in LD vs. PM with two production replicates. a Metabolites
showing significant differences (VIP > 1 and P < 0.05) between muscles and production replicates.
Discussion
The idea that apoptosis and proteolysis have coupling activities has been well-supported in various model organ-
isms. Calpain-1, one of the most dominant proteases that retain determinant proteolytic activity during postmor-
tem aging, is among the universal key modulators of apoptosis process14. While calpain-1 activation is essential
for the subsequent enzymatic activation of the critical apoptotic effector caspase-315, activated caspase-3 cleaves
calpastatin, the allosteric inhibitor of calpain-1, leading to further release of calpain-1 enzymatic activity16.
Moreover, calpain-1 induces endoplasmic reticulum stress, which facilitates cardiac muscle apoptosis under
hypoxia conditions17. Although direct experimental evidence in postmortem skeletal muscles would need further
investigation, degree of calpain-1 autolysis may be related to the onset of apoptotic process to a certain extent.
In this regard, we postulate that antemortal apoptosis may pose directly impact on muscle structural protein
degradation during postmortem aging, through modulating enzyme activity of calpain-1.
Muscle samples from pig carcasses that were produced in Apr–Sep showed higher levels of MMP, indicat-
ing a less integrated membrane system. While higher MMP in Apr–Sep may suggest more extent of apoptosis,
Apr–Sep samples also exhibited further calpain-1 autolysis, which was corresponded with increased troponin T
and desmin degradation throughout the aging period. The production cycle impact on HSP27 was muscle-type
Scientific Reports | (2021) 11:3465 | https://doi.org/10.1038/s41598-021-82929-3 7
Vol.:(0123456789)www.nature.com/scientificreports/
Figure 5. Pathway analysis of differentially affected metabolites and pathways in porcine LD (longissimus dorsi)
and PM (psoas major) muscles from two production replicates. July–Jan: Pigs weaned in July 2016 and harvested
in January 2017; Apr–Sep: Pigs weaned in April 2017 and harvested in September 2017.
specific, where Apr–Sep samples, which exhibited further degree of proteolysis, showed elevated HSP27 abun-
dance in LD, however, such change was not observed in PM. Overall, extended proteolysis in Apr–Sep muscles
was concurrent with further apoptosis, whereas July–Jan showed concurrent decrease in extent of proteolysis
and apoptosis features. The current observations suggested a possible role of apoptosis facilitating downstream
proteolysis events, subsequently resulting in improved tenderization in Apr–Sep muscles as previously reported
in the parallel s tudy11.
With regard to muscle type discrepancies in apoptosis and proteolysis, muscle specificity was found in apopto-
sis-proteolysis crosstalk. While PM muscles showed increased MMP, lower extent of calpain-1 autolysis was found
in PM compared to LD. Moreover, PM muscles exhibited higher HSP27 and αβ-crystallin abundance regardless
of aging treatment. It should be noted that the previous studies determined that PM had an inferior tenderization
potential, while it is considered as tender cut in meat retailing10,11. From a stress-defending perspective, PM is red-
oxidative, slow twitch muscle, experienced higher level of oxidative stress18. Oxidative conditions are known to
inhibit calpain-1 a ctivation19, whereas cellular oxidative stress level also facilitates onset of a poptosis20. This may
help to explain the concurrence of extended apoptosis, higher small HSPs and lower calpain-1 autolysis in PM.
Moreover, metabolomics analysis suggested that higher oxidative stress was concurrent with further extent of
cell death in Apr–Sep, whereas elevated stress defending response was found in July–Jan, which could be favoring
anti-apoptotic activities. The GC-TOF–MS metabolomics showed that in general, Apr–Sep had more abundant
macronutrients including simple sugar and a variety of carbohydrate species, BCAA, and 14–18 carbon saturated
FFA, whereas July–Jan was characterized with higher level of antioxidant or anti-stress molecules. Fourteen
lipids were found to be differentially presented between production replicates, including 6 FFAs, 3 glycolipids,
1 glycerophospholipid, and 1 sterol lipid (Table 2). Particularly, except for oleamide, which was more abundant
in July–Jan, all the differentially presented lipid compounds were elevated in Apr–Sep muscles. Exposure of
skeletal muscles to lipid surplus was recognized as a trigger of metabolic d ysfunction21. It was also suggested
that saturated FFA are pro-apoptotic compounds to the cells, primarily due to generation of intermediates with
mitochondrial toxicity22,23. In the current study, 14:0, 16:0, 18:0 and 18:1 were identified with higher abundance
in Apr–Sep. Metabolism of excessive FFA in skeletal muscle involves in generation of signaling molecules such
as diacylglycerol (DAG) and ceramide, leading to insulin resistance and hence promoting oxidative damage of
the tissue and trigger apoptosis21,24,25. Therefore, it could be postulated that elevated carbohydrates, BCAA and
FFA content in Apr–Sep pigs may be associated with early or extended onset of apoptosis, resulting in improved
proteolysis potential of postmortem muscles.
Scientific Reports | (2021) 11:3465 | https://doi.org/10.1038/s41598-021-82929-3 8
Vol:.(1234567890)www.nature.com/scientificreports/
Except for lipids, in the current study, eight carbohydrates were assigned to positive annotations, includ-
ing fructose, glucose, lactose, maltose, gluconic acid, glyceric acid, glycerol, and myo-inositol. Cell respiration
(glycolysis and TCA cycle) intermediates, including pyruvic acid, fumaric acid, malic acid, and succinic acid,
were also identified as differentially presented metabolites in between production replicates. Additionally, with
regard to nitrogen metabolism, 19 associate metabolites have been found differentially presented in between
production replicates, including 13 alpha AA. Since muscle is the largest reservoir of proteins, it plays key role
in AA metabolism and protein turn-over26. As such, a significant change in AA profile indicated shifted energy
metabolism, protein homeostasis, and signaling transduction between the two production replicates.
Urea cycle is closely linked to TCA cycle; the primary modulating hinge includes glutamate27. As urea cycle is
responsible for ammonia detoxification and nitrogen excretion, elevated urea in Apr–Sep could be an indicator
of further AA catabolism, while elevated ornithine and Asp may suggest a more conserved nitrogen utilization
in July–Jan pigs, allowing for more amino groups stayed in protein/free AA pool rather than expelled out of the
innate environment system (Fig. 4). With increased amino groups disposed, elevated carbon skeleton should be
processed via TCA c ycle27. For example, during catabolism of glutamate family molecules, Gln, Arg, His, Pro,
and ornithine are first converted into Glu. Deamination of Glu results in α-ketoglutarate production, which could
enter TCA cycle as a key intermediate, favoring respiratory flux and/or g luconeogenesis27. Meanwhile, poten-
tially enhanced gluconeogenesis in Apr–Sep, which was suggested by increases in glucose, fructose, and lactose,
could in turn favor glycolysis and TCA flux. Under various circumstance, the induction of TCA flux generates
oxidative stress and inflammatory r esponse28,29. Considering the aforementioned increases of 6-carbon sugars
and TCA intermediates in Apr–Sep, these observations together suggested elevated cellular oxidative stress in
Apr–Sep porcine muscles, which could be favoring apoptosis settlement.
In the perspective of structural AA profile, Ile, Leu, Val, Met, Phe, Glu, Ser, and 5-oxoproline were more
abundant in Apr–Sep, whereas His, Asp, Gly, Pro, Thr, and creatinine, were elevated in July–Jan. It is established
that BACC including Ile, Leu, and Val are energy providing AAs as well as major protein-turnover modulators
in skeletal muscles30. Energy-generating catabolism of BCAA produce reactive oxygen species, free radical mol-
ecules that cause oxidative stress, facilitating the onset of cell death process31,32. Moreover, Met, Phe and 5-oxo-
proline are also among the AAs related to potential cellular oxidative stress under both health and pathogenic
conditions33. Particularly, Met residuals in proteins are susceptible to oxidative attack. Met restriction prevents
unwanted shift of AA metabolism, protecting DNA and cell structure i ntegrity34. On the other hands, AAs that
are related to redox regulation and antioxidant activity, including His35, Gly36, Thr37, Asp38,39, Ala40, and Pro,
were more abundant in July–Jan. Pharmaceutical dose or dietary supplementation of these AAs could alleviate
cellular stress under catabolic conditions. In addition, GABA is a well-known inhibitory neuro-transmitter,
which was lower in July–Jan. Decreased plasma GABA level is associated with a wide range of mental/physi-
ological distress41. Hence, lower GABA level may be an indicator of elevated stress response in July–Jan pigs.
In fact, these pigs experienced significantly higher incidence of respiratory infection and antibiotic treatment
during growing-finishing phase, indicating a compromised health status in comparison with Apr–Sep r eplicate42.
Therefore, it is reasonable to speculate that elevated stress level was occurred in July–Jan, increasing abundance
of anti-stress AAs and other antioxidant metabolites. The increased antioxidant metabolites may support anti-
apoptotic activity during muscle to meat conversion, results in delayed proteolysis.
Changes of purine/pyrimidine metabolites, consistently, showed that Apr–Sep muscles underwent further
degradation of cell structure integrity, in a perspective of adenosine triphosphate (ATP) breakdown. It was gener-
ally acknowledged that ATP can be catabolized into series of intermediates, including ADP/AMP, inosine-mono
phosphate (IMP), inosine, and eventually hypoxanthine and uric a cid43. In the current results, July–Jan muscles
showed higher abundance of AMP, UMP, inosine, guanosine, and 5′-Methylthioadenosine, which were located
in the upstream of ATP catabolism pathway, whereas hypoxanthine and 5-hydroxymethyluracil were more
elevated in Apr–Sep, which belong to further degradation product of ATP catabolism. It was well established
that oxidative stress favors ATP catabolism, render increased hypoxanthine in bio-system44. As such, elevated
hypoxanthine level in Apr–Sep was an indicator of further degradation of cell compartments, consistent with
extended tendency of apoptosis and proteolysis activities.
To sum up, the present study found that both production replicate batch effect and muscle specificity
affected proteolytic changes, small heat shock proteins and apoptosis characteristics in porcine muscles. PM
showed advanced MMP decrease during early postmortem, compared to LD, as well as increased HSP27 and
αβ-crystallin, less extent of proteolysis, and lower degree of calpain-1 autolysis. Moreover, consistent with replica-
tion discrepancies in meat tenderness d evelopment11, muscles harvested in July–Jan showed lower MMP as an
indicator of less extent of apoptosis, concurrent with less extent of calpain-1 autolysis and proteolysis, regardless
of muscle effect. Moreover, changes in global metabolomics profiling between production replicates suggested
that Apr–Sep muscles retained higher level of oxidative-stress-associated macronutrients, including 6-carbon
sugars, 14–18 carbon FFA, and BCAA, therefore possibly making muscle cells more prone to antemortal apop-
totic process. On the other hand, July–Jan muscle samples showed increases in stress defending compounds such
as His, Asp, Gly, Pro, Thr, ascorbic acid, inosine, and guanosine. Taken together, these chemical finger prints
support a postulation that advanced oxidative stress may favor the onset of apoptosis, subsequently resulting
in proteolysis and meat tenderization process, whereas higher anti-apoptotic, stress defending metabolites may
defer antemortal cell death responses, thus consequently leading to adverse impacts on proteolytic potential of
postmortem muscles.
Scientific Reports | (2021) 11:3465 | https://doi.org/10.1038/s41598-021-82929-3 9
Vol.:(0123456789)www.nature.com/scientificreports/
Methods
Animals and muscle processing. The detailed information regarding live animal handling and growth
performance was reported in previous s tudy42. Animal husbandry and experimental procedures were approved
by the Purdue University Animal Use and Care Committee (protocol #1603001385). All authors complied with
the ARRIVE guidelines. In brief, two repetitions of pigs (barrows and gilts, n = 240 pigs/replicate) were weaned
at 19 days and reared for 4 month before marketing, which were replicated during July 2016 to January 2017
(July–Jan) and April 2017 to September 2017 (Apr–Sep). Ten animals (age of 5-month, BW 120.28 ± 1.32 kg)
were randomly chosen from each July–Jan replicate and Apr–Sep replicate, and slaughtered in Purdue University
Meat Laboratory. During carcass chilling, LD and PM muscles were sampled at both 1 days and 7 days postmor-
tem, snap frozen and stored at − 80 °C.
SDS‑PAGE and western blots. Gel samples were prepared in accordance with Kim, Huff-Lonergan,
Sebranek, and Lonergan (2010) with minor modifications3. All methods were performed in accordance with the
relevant guidelines and regulations. One gram of muscle sample was homogenized in 10 mL of extraction buffer
(10 mM phosphate, 2% w/v sodium dodecyl sulfate (SDS), pH 7.0 at 20 °C). After centrifugation at 1500×g for
15 min at 4 °C, supernatant was diluted to protein concentration of 6.4 mg/mL, and mixed with 0.5 volume of
tracking dye buffer (3 mM EDTA, 3% w/v SDS, 20% v/v glycerol, 0.003% w/v bromophenol blue, and 30 mM
Tris–HCl; pH 8.0) and 0.1 volume of 2-mercaptoethanol, making the final protein concentration 4.0 mg/mL.
The mixtures were incubated in 50 °C heat block for 20 min and stored at − 80 °C.
The following loaded total proteins were applied to each of the targeted proteins: 20 μg for troponin T, 40 μg
for desmin, calpain-1, HSP27, αβ-crystallin, and cytochrome c. Gels were electrophoresed on a Hoefer SE260 unit
at a constant voltage of 25 v for approximately 12 h in running buffer (3.021% Tris, 14.4% glycine, 2% SDS, 0.058%
EDTA). Proteins were then transferred to polyvinylidene fluoride membranes and were blocked for 1 h under 25
̊C using PBS-Tween (PBST) solution (pH 7.0) containing 5% nonfat dry milk. Prior to hybridization, membranes
were cut according to a non-fluorescent protein ladder (ThermoFisher PI26616). Membranes were probed with
primary antibody solutions at 4 °C for 8 h overnight, which were prepared using PBST containing 3% nonfat dry
milk. The following antibodies were used: 1:10,000 mouse monoclonal anti-desmin IgG (Sigma-Aldrich D1022),
1:20,000 anti-troponin T IgG (Sigma-Aldrich T6277), 1:10,000 mouse monoclonal anti-Mu-calpain (calpain-1)
IgG (ThermoFisher MA3-940), 1:3000 mouse monoclonal anti-HSP27 IgG (Abcam ab79868); 1:5000 rabbit
polyclonal anti-αβ-crystallin IgG (ThermoFisher PA1-16,951); and 1:1000 rabbit polyclonal anti-cytochrome c
IgG (Abcam ab90529). After being washed 3 times for 10 min with PBST solution, membranes were incubated
with the following secondary antibody preparations for one hour at room temperature: goat anti-mouse IgG
(H + L) horseradish peroxidase conjugate (dilution of 1:20,000 for desmin, troponin T, and calpain-1; dilution of
1:5000 for HSP27; Bio-Rad) or goat anti-rabbit IgG peroxidase conjugated (dilution of 1:5000 for cytochrome c
and αβ-crystallin, ThermoFisher Scientific). After three 10-min washes, ECL Western blotting reagents (Ther-
moFisher Scientific) were applied to visualize protein bands (UVP GelDoc-It). Intensity volume of each band
was measured with UVP VisionworksLS Analysis Software (UVP, LLC; Upland, CA, USA) and were compared
with an internal reference to normalize data and quantification.
Mitochondrial membrane permeability. MMP change is among the key features representing cellular
a poptosis8. MMP was determined to evaluate the extent of structural integrity loss of mitochondria membranes
in LD and PM samples from different production cycles and aging times. The assay isolated mitochondria from
LD and PM muscles in both production replicates. Mitochondria isolation was in accordance with Cuillerier
et al. (2017) with minor modifications45. Muscle samples were minced and transferred to equal volume of pre-
chilled isolation buffer (300 mM sucrose, 10 mM Tris–HCl, 1 mM EDTA, pH 7.2). After 20 s homogenizing, the
homogenate was centrifuged at 1000×g for 10 min at 4 °C for two times, supernatant was each collected. The
resulting supernatant was then centrifuged at 8000 × g for 10 min at 4 °C, and the precipitant pellet was kept,
and re-suspended in pre-chilled suspension buffer (300 mM sucrose, 10 mM Tris–HCl, 1 mM EDTA, pH 7.2).
The suspension was centrifuged at 8000×g for 10 min at 4 °C, with the final pellet re-suspended in suspension
buffer. The final mitochondria suspension was diluted to a protein concentration of 0.5 mg/mL and incubated for
3 min in water bath at 25 °C. Mitochondrial membrane permeability was determined by measuring absorbance
value at 540 nm using the UV spectrophotometer. A higher membrane integrity held more abundant membrane
proteins, mainly TCA and ETC enzymes, leading to increased absorption peak. As such, higher numerical meas-
urements indicated more integrated membrane structure, and therefore lower MMP.
Sample preparation and extraction for metabolomics. LD and PM samples were aged for 1 day (1 g
in weight) and were homogenized with 3 mL of methanol for 30 s. The homogenate was shaken for 2 h and cen-
trifuged at 4 °C at 16,000×g. Supernatant was collected and was evaporated to dryness with a vacuum centrifuge.
Dried muscle extracts were oximated with 50 μL methoxyamine hydrochloride in pyridine at 30 °C for 90 min,
and then added to 50 μL of the derivatizing agent, N-methyl-N-trimethylsilyl-trifluoroacetamide, and incubated
at 37 °C for 30 min.
GC‑TOF–MS analysis. The metabolomics analysis was conducted by following the procedure described in
Jung et al. (2015) using an Agilent 7890A GC system equipped with an Agilent 7693 autosampler coupled to a
Pegasus TOF–MS d etector46. The separation used an Agilent HP-5MS capillary column, which has an internal
diameter of 0.25 mm, a film thickness of 0.25 µm, and a length of 30 m. The carrier gas was chromatographic-
grade helium with a constant flow of 1.0 mL/min. The oven temperature was held at 75 °C for 2 min, increased
to 300 °C at a rate of 15 °C/min, then maintained at 300 °C for 3 min. A full scan was run at the electron impact
Scientific Reports | (2021) 11:3465 | https://doi.org/10.1038/s41598-021-82929-3 10
Vol:.(1234567890)www.nature.com/scientificreports/
mode set to 70 eV ionization energy. The injector line temperature was 250 °C and the transfer line temperature
was 240 °C. The GC-TOF–MS used 1 µl of reactant. A pooled quality control sample was analyzed at an interval
of eight sample analysis.
The mass-spectrometry data files were converted to CDF format, processed using the metAlign software pack-
age to obtain a data matrix containing retention times, accurate masses, and then normalized peak intensities,
using sample names and peak area information as variables. For multivariate statistical analysis, the resulting data
metric was processed with SIMCA (SIMCAP-P + software version 12.0, Umetrics, Umea, Sweden). The aligned
peaks were confirmed in the original chromatograms and were positively or tentatively identified using either
commercial standard compounds in comparison with the mass spectra and retention time or on the basis of the
NIST mass spectral database, in-house library, and references for GC-TOF–MS.
Statistical analysis. The experimental design of this study was a complete randomized block design with
split plot factors. Production replicates were served as block factor, muscle type effect (LD and PM) as the whole
plot, and aging time effect (1 day and 7 days of aging) as a subplot. Animals were considered as a random effect.
Apoptotic and proteolytic attributes were analyzed by the PROC MIXED procedure of SAS 9.4 software (SAS
Institute Inc.). Least squares means were separated using the PDIFF option of LSMEANS. Significance level
were set as α = 0.05 or less. For metabolomics data analysis, principal component analysis (PCA) and partial
least squares discriminate analysis (PLS-DA) modeling were performed by SIMCA and PASW Statistics 18. In
PLS-DA, the discriminated variables were selected based on variable importance in the projection value and
checked with P-value from one-way ANOVA. The metabolic pathway was modified from the KEGG database
(http://www.genome.jp/kegg/)47.
Received: 24 September 2020; Accepted: 27 January 2021
References
1. Kim, Y. H. B. et al. Understanding postmortem biochemical processes and post-harvest aging factors to develop novel smart-aging
strategies. Meat Sci. 144, 74–90. https://doi.org/10.1016/j.meatsci.2018.04.031 (2018).
2. Kemp, C. M., Sensky, P. L., Bardsley, R. G., Buttery, P. J. & Parr, T. Tenderness—An enzymatic view. Meat Sci. 84, 248–256. https
://doi.org/10.1016/j.meatsci.2009.06.008 (2010).
3. Carlson, K. et al. Postmortem protein degradation is a key contributor to fresh pork loin tenderness. J. Anim. Sci. 95, 1574–1586.
https://doi.org/10.2527/jas.2016.1032 (2017).
4. Kemp, C. M. & Parr, T. Advances in apoptotic mediated proteolysis in meat tenderisation. Meat Sci. 92, 252–259, https://doi.
org/10.1016/j.meatsci.2012.03.013 (2012).
5. Ouali, A. et al. Biomarkers of meat tenderness: Present knowledge and perspectives in regards to our current understanding of
the mechanisms involved. Meat Sci. 95, 854–870. https://doi.org/10.1016/j.meatsci.2013.05.010 (2013).
6. Ouali, A. et al. Revisiting the conversion of muscle into meat and the underlying mechanisms. Meat Sci. 74, 44–58. https://doi.
org/10.1016/j.meatsci.2006.05.010 (2006).
7. Wang, L.-L. et al. Study on the effect of reactive oxygen species-mediated oxidative stress on the activation of mitochondrial
apoptosis and the tenderness of yak meat. Food Chem. 244, 394–402. https://doi.org/10.1016/j.foodchem.2017.10.034 (2018).
8. Wang, L.-L., Han, L., Ma, X.-L., Yu, Q.-L. & Zhao, S.-N. Effect of mitochondrial apoptotic activation through the mitochondrial
membrane permeability transition pore on yak meat tenderness during postmortem aging. Food Chem. 234, 323–331. https://doi.
org/10.1016/j.foodchem.2017.04.185 (2017).
9. Lee, S., Joo, S. & Ryu, Y. Skeletal muscle fiber type and myofibrillar proteins in relation to meat quality. Meat Sci. 86, 166–170. https
://doi.org/10.1016/j.meatsci.2010.04.040 (2010).
10. Ma, D. & Kim, Y. H. B. Proteolytic changes of myofibrillar and small heat shock proteins in different bovine muscles during aging:
Their relevance to tenderness and water-holding capacity. Meat Sci. 163, 108090. https://doi.org/10.1016/0309-1740(85)90071-3
(2020).
11. Ma, D., Kim, Y., Johnson, J., Duttlinger, A. & Guedes, J. Effect of L-glutamine supplementation in replacement of antibiotics on
meat quality attributes of pigs exposed to transport and weaning stress during different seasons. Meat Muscle Biol. 2, 89–89. https
://doi.org/10.1093/jas/skz098 (2019).
12. Ma, D. et al. Metabolomics profiling to determine the effect of postmortem aging on color and lipid oxidative stabilities of different
bovine muscles. J. Agric. Food Chem. 65, 6708–6716. https://doi.org/10.1021/acs.jafc.7b02175 (2017).
13. Subbaraj, A. K., Kim, Y. H. B., Fraser, K. & Farouk, M. M. A hydrophilic interaction liquid chromatography–mass spectrometry
(HILIC–MS) based metabolomics study on colour stability of ovine meat. Meat Sci. 117, 163–172. https://doi.org/10.1016/j.meats
ci.2016.02.028 (2016).
14. Smith, M. A. & Schnellmann, R. G. Calpains, mitochondria, and apoptosis. Cardiovasc. Res. 96, 32–37. https://doi.org/10.1093/
cvr/cvs163 (2012).
15. Altznauer, F., Conus, S., Cavalli, A., Folkers, G. & Simon, H.-U. Calpain-1 regulates Bax and subsequent Smac-dependent caspase-3
activation in neutrophil apoptosis. J. Biol. Chem. 279, 5947–5957. https://doi.org/10.1074/jbc.M308576200 (2004).
16. Wang, K. K. et al. Caspase-mediated fragmentation of calpain inhibitor protein calpastatin during apoptosis. Arch. Biochem.
Biophys. 356, 187–196. https://doi.org/10.1006/abbi.1998.0748 (1998).
17. Zheng, D., Wang, G., Li, S., Fan, G.-C. & Peng, T. Calpain-1 induces endoplasmic reticulum stress in promoting cardiomyocyte
apoptosis following hypoxia/reoxygenation. Biochim. Biophys. Acta (BBA)-Mol. Basis Dis. 1852, 882–892, https: //doi.org/10.1016/j.
bbadis.2015.01.019 (2015).
18. Ke, Y. et al. Effects of muscle-specific oxidative stress on cytochrome c release and oxidation-reduction potential properties. J.
Agric. Food Chem. 65, 7749–7755. https://doi.org/10.1021/acs.jafc.7b01735 (2017).
19. Rowe, L. J., Maddock, K. R., Lonergan, S. M. & Huff-Lonergan, E. Oxidative environments decrease tenderization of beef steaks
through inactivation of μ-calpain. J. Anim. Sci. 82, 3254–3266. https://doi.org/10.2527/2004.82113254x (2004).
20. Stangel, M. et al. H2O2 and nitric oxide-mediated oxidative stress induce apoptosis in rat skeletal muscle myoblasts. J. Neuropathol.
Exp. Neurol. 55, 36–43. https://doi.org/10.1097/00005072-199601000-00004 (1996).
21. Koves, T. R. et al. Mitochondrial overload and incomplete fatty acid oxidation contribute to skeletal muscle insulin resistance. Cell
Metab. 7, 45–56. https://doi.org/10.1016/j.cmet.2007.10.013 (2008).
Scientific Reports | (2021) 11:3465 | https://doi.org/10.1038/s41598-021-82929-3 11
Vol.:(0123456789)www.nature.com/scientificreports/
22. Unger, R. H. & Orci, L. Lipoapoptosis: its mechanism and its diseases. Biochim. Biophys. Acta (BBA)-Mol. Cell Biol. Lipids 1585,
202–212, https://doi.org/10.1016/s1388-1981(02)00342-6 (2002).
23. Kusminski, C. M., Shetty, S., Orci, L., Unger, R. H. & Scherer, P. E. Diabetes and apoptosis: lipotoxicity. Apoptosis 14, 1484–1495.
https://doi.org/10.1007/s10495-009-0352-8 (2009).
24. Morino, K., Petersen, K. F. & Shulman, G. I. Molecular mechanisms of insulin resistance in humans and their potential links with
mitochondrial dysfunction. Diabetes 55(Suppl. 2), S9–S15. https://doi.org/10.2337/db06-S002 (2006).
25. Turpin, S. M., Lancaster, G. I., Darby, I., Febbraio, M. A. & Watt, M. J. Apoptosis in skeletal muscle myotubes is induced by cera-
mides and is positively related to insulin resistance. Am. J. Physiol. Endocrinol. Metab. 291, E1341–E1350. https://doi.org/10.1152/
ajpendo.00095.2006 (2006).
26. Goldspink, D. The influence of immobilization and stretch on protein turnover of rat skeletal muscle. J. Physiol. 264, 267–282.
https://doi.org/10.1113/jphysiol.1977.sp011667 (1977).
27. Katunuma, N., Okada, M. & Nishii, Y. Regulation of the urea cycle and TCA cycle by ammonia. Adv. Enzyme Regul. 4, 317–335.
https://doi.org/10.1016/0065-2571(66)90025-2 (1966).
28. Fernie, A. R., Carrari, F. & Sweetlove, L. J. Respiratory metabolism: Glycolysis, the TCA cycle and mitochondrial electron transport.
Curr. Opin. Plant Biol. 7, 254–261. https://doi.org/10.1016/j.pbi.2004.03.007 (2004).
29. James, A. M., Collins, Y., Logan, A. & Murphy, M. P. Mitochondrial oxidative stress and the metabolic syndrome. Trends Endocrinol.
Metab. 23, 429–434. https://doi.org/10.1016/j.tem.2012.06.008 (2012).
30. Yoshizawa, F. Regulation of protein synthesis by branched-chain amino acids in vivo. Biochem. Biophys. Res. Commun. 313,
417–422. https://doi.org/10.1016/j.bbrc.2003.07.013 (2004).
31. Bridi, R. et al. Induction of oxidative stress in rat brain by the metabolites accumulating in maple syrup urine disease. Int. J. Dev.
Neurosci. 21, 327–332. https://doi.org/10.1016/s0736-5748(03)00074-1 (2003).
32. Holeček, M. Branched-chain amino acids in health and disease: Metabolism, alterations in blood plasma, and as supplements.
Nutr. Metab. 15, 33. https://doi.org/10.1186/s12986-018-0271-1 (2018).
33. Fernandes, C. G. et al. Experimental evidence that phenylalanine provokes oxidative stress in hippocampus and cerebral cortex
of developing rats. Cell. Mol. Neurobiol. 30, 317–326. https://doi.org/10.1007/s10571-009-9455-6 (2010).
34. Martínez, Y. et al. The role of methionine on metabolism, oxidative stress, and diseases. Amino Acids 49, 2091–2098. https://doi.
org/10.1007/s00726-017-2494-2 (2017).
35. Wade, A. M. & Tucker, H. N. Antioxidant characteristics of L-histidine. J. Nutr. Biochem. 9, 308–315. https: //doi.org/10.1016/S0955
-2863(98)00022-9 (1998).
36. Chen, L. et al. Glycine transporter-1 and glycine receptor mediate the antioxidant effect of glycine in diabetic rat islets and INS-1
cells. Free Radical Biol. Med. 123, 53–61. https://doi.org/10.1016/j.freeradbiomed.2018.05.007 (2018).
37. Min, Y., Liu, S., Qu, Z., Meng, G. & Gao, Y. Effects of dietary threonine levels on growth performance, serum biochemical indexes,
antioxidant capacities, and gut morphology in broiler chickens. Poult. Sci. 96, 1290–1297. https://doi.org/10.3382/ps/pew393
(2017).
38. Duan, J. et al. Dietary supplementation with L-glutamate and L-aspartate alleviates oxidative stress in weaned piglets challenged
with hydrogen peroxide. Amino Acids 48, 53–64. https://doi.org/10.1007/s00726-015-2065-3 (2016).
39. Pi, D. et al. Dietary supplementation of aspartate enhances intestinal integrity and energy status in weanling piglets after lipopoly-
saccharide challenge. J. Nutr. Biochem. 25, 456–462. https://doi.org/10.1016/j.jnutbio.2013.12.006 (2014).
40. Grosser, N. et al. Antioxidant action of L-alanine: Heme oxygenase-1 and ferritin as possible mediators. Biochem. Biophys. Res.
Commun. 314, 351–355. https://doi.org/10.1016/j.bbrc.2003.12.089 (2004).
41. Vaiva, G. et al. Low posttrauma GABA plasma levels as a predictive factor in the development of acute posttraumatic stress disorder.
Biol. Psychiat. 55, 250–254. https://doi.org/10.1016/j.biopsych.2003.08.009 (2004).
42. Duttlinger, A. W., Kpodo, K. R., Lay Jr, D. C., Richert, B. T. & Johnson, J. S. Replacing dietary antibiotics with 0.20% L-glutamine
in swine nursery diets: Impact on health and productivity of pigs following weaning and transport. J. Anim. Sci. 97, 2035–2052,
https://doi.org/10.1093/jas/skz098 (2019).
43. Grum, C. M., Simon, R. H., Dantzker, D. R. & Fox, I. H. Evidence for adenosine triphosphate degradation in critically-ill patients.
Chest 88, 763–767. https://doi.org/10.1378/chest.88.5.763 (1985).
44. Buonocore, G. et al. Oxidative stress in preterm neonates at birth and on the seventh day of life. Pediatr. Res. 52, 46. https://doi.
org/10.1203/00006450-200207000-00010 (2002).
45. Cuillerier, A. et al. Loss of hepatic LRPPRC alters mitochondrial bioenergetics, regulation of permeability transition and trans-
membrane ROS diffusion. Hum. Mol. Genet. 26, 3186–3201. https://doi.org/10.1093/hmg/ddx202 (2017).
46. Jung, E. S. et al. A metabolomics approach shows that catechin-enriched green tea attenuates ultraviolet B-induced skin metabolite
alterations in mice. Metabolomics 11, 861–871, https://doi.org/10.1007/s11306-014-0743-x (2015).
47. Kanehisa, M. & Goto, S. KEGG: Kyoto encyclopedia of genes and genomes. Nucleic Acids Res. 28, 27–30. https://doi.org/10.1093/
nar/28.1.27 (2000).
Acknowledgements
This work was supported by the USDA National Institute of Food and Agriculture, Hacth-Multistate project
1014528 and by the Pork Checkoff (grant #16-065), National Pork Board, Des Moines, IA. Appreciation is
extended to the support of the Purdue Meat Laboratory staff, Drs. Siwen Xue and Brian Richert, and Purdue
Meat Science and Muscle Biology Lab members for the successful completion of the sample and data collection.
Author contributions
B.K. and C.L. conceived the experiments, D.M., D.S., J.Z. and Y.C. conducted the experiments, D.M. and D.S.
analyzed the results, D.M. drafted the manuscript, J.J. and A.D. generated the experimental animals. All authors
reviewed the manuscript.
Competing interests
The authors declare no competing interests.
Additional information
Supplementary Information The online version contains supplementary material available at https://doi.
org/10.1038/s41598-021-82929-3.
Correspondence and requests for materials should be addressed to C.H.L. or Y.H.B.K.
Reprints and permissions information is available at www.nature.com/reprints.
Scientific Reports | (2021) 11:3465 | https://doi.org/10.1038/s41598-021-82929-3 12
Vol:.(1234567890)www.nature.com/scientificreports/
Publisher’s note Springer Nature remains neutral with regard to jurisdictional claims in published maps and
institutional affiliations.
Open Access This article is licensed under a Creative Commons Attribution 4.0 International
License, which permits use, sharing, adaptation, distribution and reproduction in any medium or
format, as long as you give appropriate credit to the original author(s) and the source, provide a link to the
Creative Commons licence, and indicate if changes were made. The images or other third party material in this
article are included in the article’s Creative Commons licence, unless indicated otherwise in a credit line to the
material. If material is not included in the article’s Creative Commons licence and your intended use is not
permitted by statutory regulation or exceeds the permitted use, you will need to obtain permission directly from
the copyright holder. To view a copy of this licence, visit http://creativecommons.org/licenses/by/4.0/.
© The Author(s) 2021
Scientific Reports | (2021) 11:3465 | https://doi.org/10.1038/s41598-021-82929-3 13
Vol.:(0123456789)You can also read