Energy and environmental performance of a grid-connected concentrating photovoltaic thermal system for residential buildings in Iran - Energy ...
←
→
Page content transcription
If your browser does not render page correctly, please read the page content below
Energy Equip. Sys. / Vol. 9/No. 2/June 2021/ 173-190 Energy Equipment and Systems http://energyequipsys.ut.ac.ir www.energyequipsys.com Energy and environmental performance of a grid- connected concentrating photovoltaic thermal system for residential buildings in Iran Authors ABSTRACT a* Sadegh Motahar This paper evaluates the performance of a concentrating photo-voltaic Ali Kazemi a thermal (CPVT) hybrid system for space heating, providing hot water, and grid-connected (GC) electricity generation in the city of Isfahan, Iran. The GC- a Department of Mechanical CPVT system is a ground-mounted 5.63 kWp rated power system oriented in Engineering, Shahreza Campus, a north-south direction to achieve the maximum power output. The annual University of Isfahan, Iran and monthly modeling of the system is performed by Polysun® simulation software. The system specifications are described and the heating and electrical energy demand of the building are determined. The GC-CPVT performance simulation is then conducted based on the meteorological data of the location. The monthly simulation results of the GC-CPVT system in the studied location show that the yield factor varies from 138.8 to 183 kWh/kWp, the reference yield from 170.3 to 253.5 kWh/kWp, and the performance ratio from 70.3 to 82.2%. The maximum annual AC electricity generated is 10752 kWh. Furthermore, the CPVT system generates a considerable amount of heat. The annual solar fraction values for covering domestic hot water and space heating are achieved 78.3% and 35.3%, respectively. The monthly solar fraction covered by the CPVT system also Article history: varies from 32 to 100%. The environmental performance of the GC-CPVT Received : 28 September 2020 system indicates that the contribution of such a system to CO2 emission Accepted : 15 November 2020 reductions exceeds 8 tons of CO2 per year. Keywords: Concentrating Photovoltaic Thermal; Grid-Connected; Residential Heat; Performance Simulation; CO2 Saving. 1. Introduction Fossil fuels are considered as an energy of energy. Energy consumption in the resource in many countries not only causes residential sector accounts for 25% of the global environmental issues but also leads to an energy consumption and 17% of the CO2 imminent shortage of non-renewable energy emission worldwide [3]. In Iran, energy sources in the future [1]. Nevertheless, the consumption in residential buildings including percentage of fossil fuel consumption in the electricity and heat is mainly based on fossil world was reported around 80% in 2015 [2]. fuels. In 2015, 29.6% of total consumed energy Among all energy-consuming sectors, the was used in the residential sector. Moreover, building sector consumes a significant amount 86.7% of total energy consumption in the Corresponding author: Sadegh Motahar residential sector was supplied by fossil fuels Department of Mechanical Engineering, Shahreza including natural gas and oil products [4]. Campus, University of Isfahan, Iran Fortunately, serious attention globally has been Email: s.motahar@shr.ui.ac.ir
174 Sadegh Motahar & Ali Kazemi / Energy Equip. Sys. / Vol. 9/No.2/June 2021

focused on renewable and clean technologies to that the combined solar cooling and power
substitute conventional energy sources [5]. production are comparable with regular
 One of the plentiful energy resources on the alternatives. Thermal, electrical, and cooling
earth is solar energy. In recent years, solar efficiency of the system were nearly 60%, 20%
energy conversion technologies have been and 40%, respectively. The same authors
received increased attention [6]. Solar thermal proposed a CPVT system for water desalination
devices and Photovoltaic (PV) convert the solar [15]. They performed simulations to compute
energy into heat and electricity in solar thermal the annual production of electricity and water.
collectors and PV cells, respectively. An A total efficiency of 80% was obtained for the
emerging technology to simultaneously produce hybrid system. Li et al. [16] experimentally
electricity and heat for residential buildings is investigated electrical and thermal performance
the hybrid photovoltaic thermal (PVT) system. of a trough CPVT based on different PV cells.
In these systems, the heat generated in PV cells Experimental results of concentrating silicon
can be employed for space heating or domestic cell array showed that the thermal and electrical
hot water (DHW) provision [7]. Compared to efficiency of the CPVT was 42.4% and 7.51%,
solar thermal collectors and PV panels, PVT respectively. Bernardo et al. [17] proposed a
systems have not yet been commercialized; methodology to characterize and simulate a
however, interest in these systems has increased CPVT hybrid system installed in Lund
in recent years due to lower PV module prices Technical University, Sweden. Their simulation
[8]. was validated by experimental outputs of the
 The concentrating photovoltaic thermal system. An electrical efficiency of 6.4% was
(CPVT) system is a novel combination of obtained. Al-Alili et al. [18] utilized a CPVT
concentrating photovoltaic (CPV) and PVT to system for simultaneous generation of heat and
generate superior heat and power. In CPVs, the electricity applied in an air conditioning system.
solar insolation is focused on the PV panels to A TRNSYS simulation was employed for Abu
produce more electricity than a normal flat PV Dhabi condition. The simulation results showed
cell [9]. CPVT systems also use this technology. that the annual overall COP of the hybrid system
Furthermore, the thermal energy produced in was found to be than that of the other solar air
the PV cells due to the concentration of sunlight conditioners. The maximum average COP of
is used for processes that require heat [10]. The 60% was achieved. CPVT systems with Fresnel
main issues of PVT systems, i.e. high lenses and parabolic mirrors concentrators were
investment for generating desired electricity and studied from the economic and energy attitude
low output temperature, have been solved in in Italy by Renno and Petito [19]. Results of
CPVT systems. CPVT systems possess fewer simulation for southern Italy indicated that the
PV cells with higher combined heat and power configuration with mirrors (81 mm2 cell area
efficiency [11]. and two modules with 90 cells) produced energy
 In recent years, various configurations of which is sufficient for electric and cooling
CPVT systems have been widely studied. demands, while an auxiliary heating system was
Coventry [12] investigated the performance of a essential for some months of the year. The fluid
CPVT collector. Measured results showed the temperature of 90℃ was obtained. Also, the
combined efficiency of 69% for the CPVT discount payback year was 8 years. Calise et al.
system. Kribus et al. [13] presented a CPVT [20] performed a dynamic simulation of CPVT
system producing electricity and heat for a system integrated in solar heating and cooling.
nearby consumer. They investigated both of The system provided space heating and cooling,
thermal and electrical performance costs of the electricity and DHW for a sample building. The
system and produced energy. The efficiency of produced electricity was consumed by building
the system was almost 80%. Also, the payback and the excess was sold to the public grid.
time of 10 years was achieved at the electricity Thermal energy by the CPVT was used in an
cost of 5 ¢kWh-1. Mittelman et al. [14] studied a absorption chiller. Time basis Energetic and
CPVT system operated at elevated economic performances were also evaluated.
 2
temperatures. The produced thermal energy was They showed that for a 500 m collector area the
used for absorption cooling. Results showed solar fraction of 75% can be obtained. In
Sadegh Motahar & Ali Kazemi / Energy Equip. Sys. / Vol. 9/No.2/June 2021 175

comparison with a system with a flat plate heating a building located in Chuncheon city in
collector, the primary energy saving was 84.4% South Korea. Results illustrated the highest
versus 70.2%. Karathanassis et al [21] designed electrical and thermal efficiencies of the
and experimentally evaluated a parabolic- collector were 18.5% and 65.2%, respectively.
trough CPVT system. Results showed that the Assuming that the useful life of the CPVT
electrical and thermal efficiency of the system system is 25 years, the discounted payback
was almost 6% and 44%, respectively. Moreno period for natural gas will be 12 years.
et al. [22] designed a CPVT for use on the south- The energy and environmental performance
facing windows of buildings. In their design, a of CPVT systems to produce simultaneous heat
PV cell was immersed in deionized water. A and electricity for residential buildings have
polymethyl methacrylate concentrator linearly been received insufficient attention in recent
concentrated sunlight on it. Deionized water years. The overall purpose of this paper is to
cooled the PV cell. The energy performance of assess the thermal, electrical, and environmental
the building integrated with this system was performance of a grid-connected CPVT (GC-
simulated for three European cities. The results CPVT) system installed in city of Isfahan, Iran.
showed that this system could provide up to To the best of our knowledge, such a
74% of the thermal energy required for DHW performance study on the simultaneous
and 68.7% of the energy required for space production of electricity and thermal energy by
heating. Moaleman et al. [23] employed a CPVT systems has not been conducted so far. In
CPVT system with Fresnel linear collector to this paper, a 5.63 kWp rated power CPVT
generate electricity, heating, and cooling system was employed to provide space heating,
simultaneously in Tehran. The performance of DHW and GC electricity. Using Polysun®
this tri-generation system was simulated by simulation software, monthly and annual grid-
TRNSYS software. The overall efficiency of connected PV indices were calculated to
this system was 71% with an annual electricity estimate the performance of PV part of GC-
generation efficiency of 12.8%. Also, its heating CPVT. The solar fraction was also utilized to
and cooling efficiencies were 58.01% and 34%, assess the thermal performance. Moreover, the
respectively. Anand and Murugavelh [24] saving of CO2 emission by using GC-CPVT
modeled a hybrid CPVT system used for power system was investigated.
generation, desalination and cooling. The
system was simulated for the geographical Nomenclature
conditions of Vellore, India and two days of the
year. The results of the daily analysis showed DHI Diffuse Horizontal Irradiance,
that the output temperature of saline from the kWh/m2
CPVT collector was in the range of 34.47℃ - DHW Domestic Hot Water
68.45℃ and the generated electricity was in the DNI Direct Normal Irradiance,
range of 0.21 kW - 1.36 kW. The highest energy kWh/m2
utilization factor was 0.31. Annual power EAC AC energy output of the system,
generation, cooling and desalination capacity kWh
were 3.46 MWh, 0.788 MWh and 4.2 m3, Esol PV Solar radiation on to the module
respectively. Alayi et al. [25] a hybrid CPVT area, kWh
system with a parabolic trough collector and GC-CPVT Grid-Connected Concentrating
PCM storage tank was simulated to generate Photo-Voltaic Thermal
electricity, heating and cooling a building in GHI Global Horizontal Irradiance,
Tehran. The average collector outlet kWh/m2
temperature was 88℃. It was shown that the HR Array reference irradiance
lowest and highest monthly thermal production
 (= 1 kW/m2)
is 16.4 kW and 51.31 kW. Also, the maximum
 Ht Total irradiance onto module
and minimum electrical power generation by
 area, kWh/m2
CPVT system were 18.81 kW and 6.01 kW in
June and January, respectively. Hussain and PR Performance Ratio (%)
Kim [26] proposed a focused CPVT system for
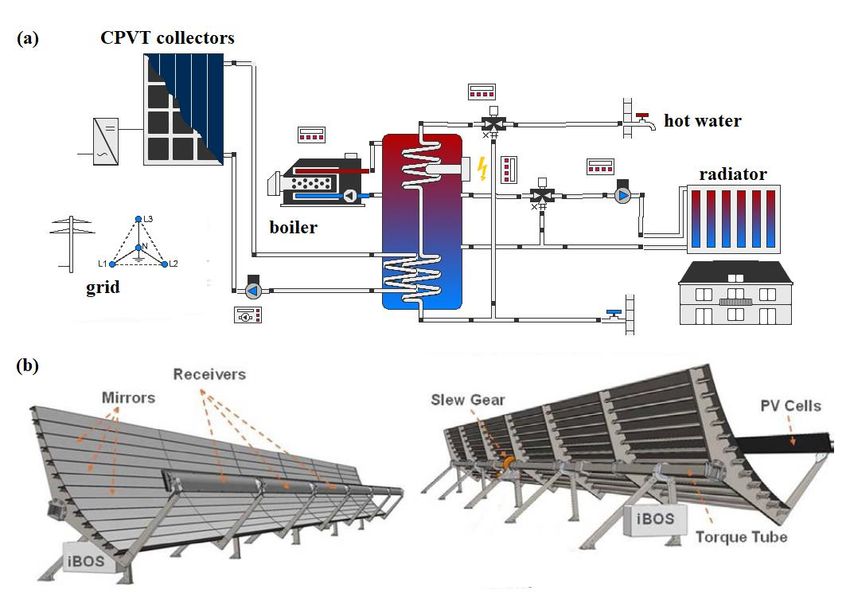
176 Sadegh Motahar & Ali Kazemi / Energy Equip. Sys. / Vol. 9/No.2/June 2021

 Pr,PV Maximum rated power of the energy 44%, wind energy 34%, biomass energy
 panels, kWp 1%, hydropower 12%, and waste heat recovery
 PV Photo-Voltaic 2%. Since 2016, the Iranian Ministry of Energy
 Qaux Energy generated by the has guaranteed the purchase of electricity from
 auxiliary system, kWh clean and renewable sources [29].
 Solar energy in Iran is remarkable because of
 Qsol Energy supplied by collectors to more than 300 clear sky sunny days annually
 the system, kWh [30]. The average annual solar irradiance in Iran
 SF Solar Fraction (%) is estimated to be 4.5-5.5 kwh/m2.day. The
 STC Standard Test Condition southern shores of the Caspian Sea have the
 T Temperature, ºC lowest amount of irradiance (about
 YF Final yield (kWh/kWp) 2.8kWh/m2.day) due to cloudiness, rainfall, and
 YR Reference yield (kWh/kWp) high humidity, while the central and southern
 regions of Iran have the highest solar irradiance
 (Fig. 1 (a)). Figure 1 (b) shows Iran's GIS map
2. Solar energy in Iran for areas with the highest potential for PV power
 plants. The efficiency of PV panels decreases
Iran is a Middle Eastern country that is bounded with increasing temperature, high winds, and
on the north by the Caspian Sea and by the specks of dust, so the climate of a region has a
Persian Gulf and the Oman Sea in the south. Its major impact on PV electricity generation [31,
other borders are shared with Armenia, 32].
Azerbaijan, Turkey, Iraq, Pakistan,
 Using solar energy to generate heat for
Afghanistan, and Turkmenistan. Iran's climate
 residential buildings is one of the advantages of
is warm and dry, affected by subtropical aridity
 solar energy in Iran [33]. Due to the average
of the Arabian Desert and subtropical humidity
 high temperature and good solar radiation in
of the eastern Mediterranean area [27]. In most
 southern parts of Iran, solar water heaters can be
areas, summers are long, hot, dry, and winters
are short and cold. replaced by existing electric water heaters. In
 Iran has considerable diversity in renewable Tehran, the capital of Iran, if only 25% of the
energy sources mainly including wind, solar, population uses solar water heating systems,
biomass, and geothermal. A considerable focus about 1,310,000 MWh/yr will save on fossil fuel
on renewable energies has been recently done, consumption, equivalent to a reduction of
although having rich oil and gas resources, low 503,078 tons of CO2 emissions [34]. In Iran,
prices for fossil fuels, and lack of awareness of solar collectors (flat-plate or evacuated tubes)
the benefits of renewable energies have slowed are used to producing solar hot water. To
down the growth of using these resources [28]. promote solar water heater use in Iran, the
As of March 2020, the total installed capacity of government has been building solar baths in
renewable energy plants and energy efficiency deprived areas of Iran, installing solar water
in Iran was 885 MW. Moreover, another heaters for villagers and tribes to prevent
345MW of renewable power plants is currently deforestation, and installing water heaters to
under construction. Also, the contribution of provide hot water for student dormitories,
renewable energies in power generation is solar public toilets, and so on.

 Fig. 1. (a) Global horizontal irradiation in Iran (kWh/m2.day) (b) PV power potential map of Iran [31]
Sadegh Motahar & Ali Kazemi / Energy Equip. Sys. / Vol. 9/No.2/June 2021 177

3. Methodology the outdoor temperature, wind speed and air
 relative humidity of the studied location is
 3.1. Local meteorological data presented in Table 2. These parameters, along
 with solar radiation and dust deposition, are
In this study, the city of Isfahan where located important in the performance study of solar cells
in the central area of Iran is selected with the [36]. It can be seen from Table 2 that the
aim of studying the performance of GC-CPVT minimum and maximum temperatures of
system. It possesses a moderate and dry climate. Isfahan occur in January and July, respectively.
Average annual weather data for the studied The hourly outdoor temperatures of the
location is listed in Table 1. studied location are shown in Fig. 2. The
 According to the average annual outdoor maximum outdoor temperature is 40.9℃ which
temperature of 16.3℃ and heating degree day of occurs in 21th of July at 15:00. The coldest day
1952, heating load is dominant in terms of of the year is January, 12 at 23:00 that the
energy consumption in the location [35]. minimum temperature is -11.4℃.
Monthly average meteorological data including

 Table 1. Average annual weather data for studied location
 Parameter Quantity Unit
 Location Isfahan -
 Latitude 32.62 º
 Longitude 51.67 º
 Altitude 1550 m
 Average annual relative
 35.4 %
 humidity
 Average annual outdoor
 16.3 ℃
 temperature
 Average annual wind speed 2.8 m/s
 Heating degree day 1952 -

 Table 2. Monthly average meteorological data
 Outdoor temperature (℃) Wind speed (m/s) Air humidity (%)
 January 1.5 2.2 56.1
 February 5.6 3.0 41.4
 March 11.2 3.4 31.7
 April 16.1 3.6 33.5
 May 21.9 3.6 26.8
 June 26.8 3.2 22.6
 July 30.0 2.9 22.5
 August 28.2 2.7 22.8
 September 23.3 2.5 25.0
 October 17.3 2.5 33.4
 November 8.8 2.1 49.4
 December 3.7 2.0 59.9
178 Sadegh Motahar & Ali Kazemi / Energy Equip. Sys. / Vol. 9/No.2/June 2021

 Fig. 2. Hourly outdoor temperature of the studied location

Figure 3 shows the GHI (global horizontal and the lowest amount is 94.4 kWh/m2 in
irradiance), DNI (direct normal irradiance) and December. Also, DNI has the maximum value
DHI (diffuse horizontal irradiance) in the city of in September and the minimum value in
Isfahan in different months of the year. The December which are 275 kWh/m2 and 152
 2 2
highest amount of GHI is 239 kWh/m in July kWh/m , respectively.

 Fig. 3. Monthly average irradiance
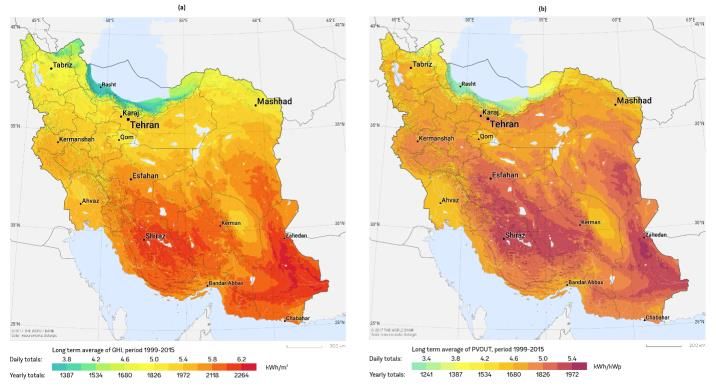
Sadegh Motahar & Ali Kazemi / Energy Equip. Sys. / Vol. 9/No.2/June 2021 179

 As previously mentioned, the total average (version 11.0). This software has been utilized
daily solar radiation in Iran is equal to 4.5-5.5 for the simulation and design of solar energy
kWh/m2.day. Isfahan almost has total annual systems. In this paper, the system specifications
 2
radiation of 2050 kWh/m or daily average of 5.6 are firstly described and the energy demand
 2
kWh/m .day which is more than average. (electricity and thermal) of the building are
 Figure 4 illustrates the global radiation determined. Then, the design parameters are
during the year as well as the diffuse radiation input to the software, and system performance
for the city of Isfahan. The highest average simulations are conducted based on the
hourly global radiation value (i.e. 1156 W/m2) is meteorological data of the location (Isfahan,
achieved in August, 4 at 12:00. Due to the lack Iran).
of cloudy and rainy days, the diffuse radiation is The GC-CPVT system consists of three
dramatically low during the year. SunBase 1.0 ground-mounted CPVT collectors
 of 1878 Wp each, manufactured by Cogenra
 3.2. System description and performance Solar Inc. A sun-tracking system are employed
 simulation to gather the direct solar radiation. The CPVT
 collectors are oriented in north-south direction
The performance assessment of GC-CPVT and track the sun along the axis in the east-west
systems for the provision of space heating, to maximize the received solar radiation [23].
DHW, and grid-connected electricity has been Figure 5 shows the schematic diagram of the
investigated. The modeling of the GC-CPVT GC-CPVT system simulated in Polysun® and a
system is carried out by Polysun® software Cogenra’s CPVT collector.

 Fig. 4. Global and diffuse radiation of Isfahan
180 Sadegh Motahar & Ali Kazemi / Energy Equip. Sys. / Vol. 9/No.2/June 2021

 Fig. 5. (a) The GC-CPVT system simulated in Polysun® (b) Cogenra’s CPVT collector [37]

 The hybrid CPVT system consists of a Temperature
 -0.423 (%/K)
number of ground-mounted arrays that coefficient
independently track the sun. There are a series Output voltage
 132 V
of flat mirrors on each array that focus sunlight MPP-STC
 Output current
on the polycrystalline module and generate 14.2 A
 MPP-STC
electricity. There are a number of ducts on each
 Open circuit voltage 174.2 V
panel through which a mixture of water and
 Short circuit current 15.8 A
glycol flows and cools the PV cells [37]. The
water storage tank has 3000 L capacity. There Test flowrate 363.6 L/min
are heat exchangers in the water storage tank for Fluid volume 4.4 L
extracting heat from the solar loop, pre-heating Diffuse irradiation
 0.157 -
and heating tap water. A 25 kW auxiliary boiler fraction
and space heating loop are directly connected to Effective thermal
 66.388 kJ/kg
the storage tank. capacity
 The thermal and electrical specifications of Max. temperature 100 ℃
CPVT collectors are given in Table 3. Max. pressure 3 bar
 * STC: irradiance of 1000W/m2 and cell temperature
 Table 3. CPVT collector data of 25°C

 parameter value unit The building is located southward with
 Module type Polycrystalline -
 dimensions of 12×9×2.4 (length× width× floor
 height). It has two floor with radiating heat
 Aperture area 16.38 m2 system. The nominal inlet temperature to the
 Absorber area 1.59 m2
 radiators is 60℃ and the nominal return
 temperature is 50℃. It is a normal building in
 Module Efficiency terms of energy consumption. The main
 11.01 %
 STC* characteristics of the building are listed in
 Nominal power
 1878 W Table 4.
 STC
Sadegh Motahar & Ali Kazemi / Energy Equip. Sys. / Vol. 9/No.2/June 2021 181

 Table 4. Main characteristics of the multi-family building
 Parameter value unit
 Heated living area 216 m2
 Heating set point temperature (day) 23 ℃
 Heating set point temperature (night) 16 ℃
 U-value of the building 0.5 W/m2.K
 Specific heating energy demand 150 kWh/m2
 Window-to-wall area ratio (South) 25 %
 Window-to-wall area ratio (North) 13 %
 Window-to-wall area ratio (East) 25 %
 Window-to-wall area ratio (West) 6 %
 Air change/infiltration 0.3/0.6 hr-1
 Heat capacity of the building 500 kJ/m2.K

 In the abovementioned building, two four- a result, the approximate amount of DHW
person families live who are considered high consumption with a temperature of 60℃ is
consumption in terms of DHW consumption equal to 400 L.
pattern. The highest consumption of DHW for a The energy produced by GC-PV modules may
high-consumption family is 70 L of hot water decrease by a variety of losses including soiling,
with a temperature of 45℃ [38]. Due to the fact degradation, cables, mismatching and so on
that the standard DHW temperature in Iran is [40]. These factors are listed in Table 5. The
60℃, the amount of DHW consumption with a inverter with IG Plus 55 V-2 model made by
temperature of 60℃ is converted from the Fronius International GmbH is used for
following equation [39]: converting DC-produced electricity to AC
 electricity. The parameters of the inverter is also
 60 = (45 − )⁄(60 − ) × 45 (1)
 listed in Table 5.
Considering the lowest monthly outdoor
temperature, TC ~ 1.5℃ can be obtained and as

 Table 5. GC-PV module parameters
 parameter value unit
 PV panels losses
 Soiling 2 %
 degradation 0.5 %
 Cable loss 2 %
 mismatching 4 %
 inverter
 model IG Plus 55 V-2 -
 DC maximum power at cos φ=1 5260 W
 Max. input current 22.9 A
 Max. short circuit current 34.4 A
 MPP voltage range 230-500 V
 Max. output nominal 5000 W
 Max. output voltage 270 V
 Max. output current 10.9 A
 Max. efficiency 95.7 %
182 Sadegh Motahar & Ali Kazemi / Energy Equip. Sys. / Vol. 9/No.2/June 2021

Energy and environmental performance of the is more than the high temperature. A panel
GC-CPVT system are evaluated using solar heats up when it is exposed to sunlight. In
thermal energy to the system (Qsol), solar hybrid systems, some of this heat is
fraction (SF) AC electrical energy output (EAC), transferred to the heat transfer fluid, and the
final yield (YF), reference yield (YR), panel temperature drops. Simulated hourly
performance ratio (PR), and CO2 emission temperature of PV receiver is shown in Fig. 6.
reduction: As seen, the maximum temperature of PV
 (2) receiver during operation is 95.7℃ which
 = × 100 occurs at 11:00 A.M. on October, 10. The
 +
 average annual temperature of PV cells can be
 ℎ⁄ 2 (3) achieved 64.1℃. The cell temperature in
 = [ ]
 ⁄ 2 CPVT systems is a function of air
 ℎ temperature, direct normal irradiance, hours
 (4)
 = [ ] of the day and concentration factor [41].
 , Figure 7 illustrates the monthly average
 (5) temperature of CPVT collector during
 = × 100 operation. The highest operating temperature

 can be achieved in July and August which is
 69.5℃, while the lowest operating
4. Results and discussion
 temperature occurs in January and is equal to
 54.4℃. The CPVT optimum operating
 4.1. Energy performance of GC-CPVT
 temperature range for electricity and useful
 system
 heat production was reported 75-125°C [42].
 Due to higher air temperature in summer in
As mentioned before, the efficiency of PV
 addition to lower hot water consumption, the
cell can be influenced by its temperature. PV
 monthly cell average operating temperature is
panels perform better at low temperatures
 higher during summer. Moreover, according
than at high temperatures. As the power
 to Fig. 3, the DNI has the maximum value in
generated by PV cells at a lower temperature
 July to September.

 Fig. 6. Simulated hourly CPVT operating temperature
Sadegh Motahar & Ali Kazemi / Energy Equip. Sys. / Vol. 9/No.2/June 2021 183

 Fig. 7. Monthly operating temperature of CPVT collector

In the present study, the produced thermal auxiliary system and the calculated values of SF
energy by CPVT system is utilized for space are shown in Fig. 8.
heating and DHW. It can also be used for The lowest SF value occurs in January which
driving an absorption chiller in the air- 32% of the residential heating demand can be
conditioning system, industrial applications and produced by the CPVT system (Qaux = 2368
seasonal thermal storage. The solar fraction kWh, Qsol = 1115 kWh). The ambient
(SF) represents a portion of the thermal energy temperatures and solar irradiance is low in
demand which is provided by solar energy. The January, therefore SF is minimum. The
total SF calculated by Eq. (1) indicates the maximum monthly total SF that occurs for
portion of required residential heat is produced August in Isfahan is 100% which 804 kWh of
by the CPVT system. Solar thermal energy required heat provided by the CPVT system.
supplied by CPVTs, energy generated by the

 Fig. 8. Solar heat, auxiliary heat and solar fraction
184 Sadegh Motahar & Ali Kazemi / Energy Equip. Sys. / Vol. 9/No.2/June 2021

 The lowest SF values (34.3%, 32%, and output energy from a 5 kWp flat plate PVT
49.3%) supplied by the CPVT system will be in system was obtained 833 kWh [39].
the winter season (December, January, and In this section, performance criteria of grid-
February). In summer months including June, connected PV modules, i.e. YR, TF and PR, are
July, and August, the CPVT system provides investigated for the GC-CPVT system. Figure
96.8%, 98.3%, and 100%, respectively, of 10 depicts the monthly YR and YF to investigate
required residential heat. Therefore, during the the PR of the GC-CPVT system. The variation
coldest months in winter, less than 39% of the of YR value depends on the solar irradiance on
required heat can be provided by the solar the CPVT receivers at various months. The
thermal segment of the CPVT system, because lowest value of YR is 170.28 kWh/kWp which
space heating load is added during winter. For 5 arises in December. It is clear from Fig. 9 the
kWp PVT system with flat plate collectors solar irradiance on the module area (Esol PV) is
installed in Isfahan, less than 15% of residential 8367.9 kWh in December. Figure 4 also
heating of the building is supplied by collectors indicates the minimum GHI and DNI is detected
[39]. in December. This YR is equivalent to produce
 Electrical energy is another useful energy 782.1 kWh energy by the inverter. Performance
produced by CPVT hybrid systems. The ratio (PR) is another indicator to assess the
monthly AC electrical energy output from the performance of the PV module of the CPVT
inverter along with solar radiation onto the system. Figure 10 also displays the variation of
module area (Esol PV) are shown in the Fig. 9. The PR in different months. The closer the PR is to
maximum total solar radiation on to the module 100%, the lower the difference between YR and
area is 12459 kWh which occurs during July. YF, so the performance of the GC-CPVT system
Also, 8368 kWh of solar energy is irradiated to is close to ideal. For the investigated GC-PVT
the modules in December .The GC-CPVT system, the monthly PR varies from 70.3% in
system generates maximum and minimum August to 82.2% in January. The PR indicator is
amount of electrical energy in June (EAC=1030.9 employed to compare the performance of
kWh) and December (EAC=782.1 kWh), various GC-PV systems independent of rated
respectively. The maximum AC electrical power, installation location, angle and direction
 [43].

 Fig. 9. Monthly AC electrical energy produced by CPVT system and radiation on to the module area
Sadegh Motahar & Ali Kazemi / Energy Equip. Sys. / Vol. 9/No.2/June 2021 185

 Fig. 10. Variations of monthly YR, YF and PR

 Annual parameters indicating the 4.2. Environmental investigation of GC-
performance of GC-CPVT system are listed in CPVT system
Table 6. Solar thermal production is 10179 kWh
which is equivalent to saving 855 m3 of natural Conventional methods for generating
gas. The annual SF value for Isfahan is 61.7%. electricity and heat usually utilize fossil fuels.
The value of SF and YF for a 5 kW flat GCPVT Carbon dioxide (CO2) is one of the
system in Isfahan were obtained as 45.6% and combustion products of fossil fuels that play
1757 kWh/kWp, respectively [39]. It is worth a major role in environmental pollution and
mentioning that the annual SF values for global warming. The application of PVT solar
covering DHW and space heating are achieved systems, especially in buildings, can
78.3% and 35.3%, respectively. The GC-CPVT significantly reduce CO2 emissions and cost
system is more efficient than a similar GC-PVT issues [44].
system. Figure 11 illustrates the hourly amount of
 CO2 produced by some components of GC-
 Table 6. Annual performance parameters of the CPVT system including pumps and auxiliary
 GC-PVT system boiler. On cold winter days, the energy
 Parameter Value Unite produced by the auxiliary boiler is needed and
 Qsol 10179 kWh the GC-CPVT system produces a small
 amount of CO2.
 Qaux 2368 kWh Figure 12 shows the monthly CO2
 SF 61.7 % emission reductions with the bar graph. As
 SF (DHW) 78.3 % can be seen, the PV module has the greatest
 impact on CO2 emission reductions, which is
 SF (Building) 35.3 %
 the highest value in July (545 kg CO 2) and the
 EAC 10752.1 kWh lowest value (419 kg CO 2) in December.
 YR 2529.9 kWh/kW About 27-38% of the CO2 emission saving is
 YF 1908.4 kWh/kWp related to the solar thermal part. For the city
 of Isfahan by installing the mentioned GC-
 PR 75.4 %
 CPVT system, it can be prevented an annual
186 Sadegh Motahar & Ali Kazemi / Energy Equip. Sys. / Vol. 9/No.2/June 2021

average of 8386 kg CO 2 emission. Assuming (electrical and thermal) generated by the GC-
the system has a lifespan of 25 years, for each PVT system. For the thermal part, this factor
hybrid system, more than 200 tons of CO 2 is 0.26 kg CO2/kWh. This value is reported to
emissions will be saved. Using the definition be 0.297 kg CO2/kWh for building-integrated
of CO2 specific emission factor, i.e., the PVT systems in Hong Kong [45]. In Iran, the
amount of CO2 emitted per 1 kWh of energy CO2 specific emission factor in the power
produced, it can be said that an average of sector is 571.29 g/kWh [46].
0.40 kg CO2 is saved per kWh of energy

 Fig. 11. GC-CPVT system CO2 emission

 Fig. 12. Monthly reduction in CO2
Sadegh Motahar & Ali Kazemi / Energy Equip. Sys. / Vol. 9/No.2/June 2021 187 5. Conclusions 342-352, https://doi.org/10.1016/j.enpol.2016.10.0 This paper evaluated the performance of a 32. GC-CPVT system generating GC electricity [4] The energy balance sheets. Fuel and residential heat in the city of Isfahan, Iran. consumption optimisation organisation, The system was a 5.63 kWp ground-mounted Power Ministry 2015. Last accessed CPVT system. The remarkable achievements 30/03/2020, http://www.moe.gov.ir/. of the study are: [5] Ali Habibollahzade, Employing The GC-CPVT system is very efficient photovoltaic/thermal panels as a solar for the simultaneous generation of chimney roof: 3E analyses and multi- electricity and heat from solar energy . objective optimization, Energy, Volume The hybrid system with concentrating 166, 2019, Pages 118-130, collector can annually produce more https://doi.org/10.1016/j.energy.2018.10. than 10000 kWh AC electricity. This 048 amount of electrical energy makes the [6] Seyed Ehsan Hosseini (2019) yield factor criterion very competitive Development of solar energy towards for this system. The annual Yf is around solar city Utopia, Energy Sources, Part A: 1900 kWh/kWp. Recovery, Utilization, and Environmental The amount of performance ratio is very Effects, 41:23, 2868-2881, DOI: close to 100% and therefore it can be 10.1080/15567036.2019.1576803 concluded that the system is close to the [7] Amirmohammad Behzadi, Ehsan ideal state. It was in the range of 70.3% Gholamian, Ehsan Houshfar, Mehdi to 82.2%. Ashjaee, Thermoeconomic analysis of a The hybrid GC-CPVT system provides hybrid PVT solar system integrated with most of the thermal energy required for double effect absorption chiller for DHW and space heating. So that, the cooling/hydrogen production, Energy solar fraction was 78.3% for DHW Equipment and Systems (2018) 6(4): 413- supply and 35.3% for space heating. 427. The proposed hybrid system can help [8] Daniel Zenhaeusern, Evelyn Bamberger, preserve the environment by reducing Alexis Baggenstos, Andreas Häberle, CO2 emissions. An average of about PVT Wrap-Up: Energy Systems with 8386 kg CO2 emission was annually Photovoltaic Thermal Solar Collectors- prevented by installing a GC-CPVT Technology, Market, Experiences, ISES system. Solar World Conference 2017 and the IEA SHC Solar Heating and Cooling References Conference for Buildings and Industry 2017, UAE, January 2017 [1] Martins F, Felgueiras C, Smitkova M, [9] Ali O.M. Maka, Tadhg S. O'Donovan, Caetano N. Analysis of Fossil Fuel Modelling of the thermal behaviour of Energy Consumption and Environmental solar high concentrating photovoltaic Impacts in European Countries. Energies receiver, Thermal Science and 2019; 12: 964. Engineering Progress, Volume 9, 2019, [2] The World Bank, Fossil fuel energy Pages 281-288, consumption (% of total), https://doi.org/10.1016/j.tsep.2018.12.00 https://data.worldbank.org/indicator/EG. 1. USE.COMM.FO.ZS, Last accessed [10] Mathew George, A.K. Pandey, Nasrudin 30/03/2020 Abd Rahim, V.V. Tyagi, Syed [3] María del P. Pablo-Romero, Rafael Pozo- Shahabuddin, R. Saidur, Concentrated Barajas, Rocío Yñiguez, Global changes photovoltaic thermal systems: A in residential energy consumption, component-by-component view on the Energy Policy, Volume 101, 2017, Pages developments in the design, heat transfer
188 Sadegh Motahar & Ali Kazemi / Energy Equip. Sys. / Vol. 9/No.2/June 2021

 medium and applications, Energy https://doi.org/10.1016/j.enconman.2010.
 Conversion and Management, Volume 12.039.
 186, 2019, Pages 15-41, [17]L.R. Bernardo, B. Perers, H. Håkansson,
 https://doi.org/10.1016/j.enconman.2019. B. Karlsson, Performance evaluation of
 02.052. low concentrating photovoltaic/thermal
[11]Reza Daneshazarian, Erdem Cuce, Pinar systems: A case study from Sweden,
 Mert Cuce, Farooq Sher, Concentrating Solar Energy, Volume 85, Issue 7, 2011,
 photovoltaic thermal (CPVT) collectors Pages 1499-1510,
 and systems: Theory, performance https://doi.org/10.1016/j.solener.2011.04
 assessment and applications, Renewable .006
 and Sustainable Energy Reviews, Volume [18]A. Al-Alili, Y. Hwang, R. Radermacher,
 81, Part 1, 2018, Pages 473-492, I. Kubo, A high efficiency solar air
 https://doi.org/10.1016/j.rser.2017.08.01 conditioner using concentrating
 3. photovoltaic/thermal collectors, Applied
[12]Joe S. Coventry, Performance of a Energy, Volume 93, 2012, Pages 138-
 concentrating photovoltaic/thermal solar 147,
 collector, Solar Energy, Volume 78, Issue https://doi.org/10.1016/j.apenergy.2011.
 2, 2005, Pages 211-222, 05.010.
 https://doi.org/10.1016/j.solener.2004.03 [19]Carlo Renno, Fabio Petito, Design and
 .014 modeling of a concentrating photovoltaic
[13]Abraham Kribus, Daniel Kaftori, Gur thermal (CPV/T) system for a domestic
 Mittelman, Amir Hirshfeld, Yuri application, Energy and Buildings,
 Flitsanov, Abraham Dayan, A miniature Volume 62, 2013, Pages 392-402,
 concentrating photovoltaic and thermal https://doi.org/10.1016/j.enbuild.2013.02
 system, Energy Conversion and .040.
 Management, Volume 47, Issue 20, 2006, [20]Francesco Calise, Massimo Dentice
 Pages 3582-3590, d'Accadia, Adolfo Palombo, Laura
 https://doi.org/10.1016/j.enconman.2006. Vanoli, Dynamic simulation of a novel
 01.013. high-temperature solar trigeneration
[14]Gur Mittelman, Abraham Kribus, system based on concentrating
 Abraham Dayan, Solar cooling with photovoltaic/thermal collectors, Energy,
 concentrating photovoltaic/thermal Volume 61, 2013, Pages 72-86,
 (CPVT) systems, Energy Conversion and https://doi.org/10.1016/j.energy.2012.10.
 Management, Volume 48, Issue 9, 2007, 008
 Pages 2481-2490, [21]I.K. Karathanassis, E. Papanicolaou, V.
 https://doi.org/10.1016/j.enconman.2007. Belessiotis, G.C. Bergeles, Design and
 04.004. experimental evaluation of a parabolic-
[15]Gur Mittelman, Abraham Kribus, Ornit trough concentrating
 Mouchtar, Abraham Dayan, Water photovoltaic/thermal (CPVT) system
 desalination with concentrating with high-efficiency cooling, Renewable
 photovoltaic/thermal (CPVT) systems, Energy, Volume 101, 2017, Pages 467-
 Solar Energy, Volume 83, Issue 8, 2009, 483,
 Pages 1322-1334, https://doi.org/10.1016/j.renene.2016.09.
 https://doi.org/10.1016/j.solener.2009.04 013.
 .003 [22]A. Moreno, A. Riverola, D. Chemisana,
[16]M. Li, G.L. Li, X. Ji, F. Yin, L. Xu, The Energetic simulation of a dielectric
 performance analysis of the Trough photovoltaic-thermal concentrator, Solar
 Concentrating Solar Energy 169 (2018) 374–385
 Photovoltaic/Thermal system, Energy [23]Amirreza Moaleman, Alibakhsh
 Conversion and Management, Volume Kasaeian, Mohamad Aramesh, Omid
 52, Issue 6, 2011, Pages 2378-2383, Mahian, Lovedeep Sahota, Gopal Nath
 Tiwari, Simulation of the performance of
Sadegh Motahar & Ali Kazemi / Energy Equip. Sys. / Vol. 9/No.2/June 2021 189

 a solar concentrating photovoltaic- ⟨https://solargis. com/maps-and-gis-
 thermal collector, applied in a combined data/download/iran⟩
 cooling heating and power generation [32]Shiva Gorjian, Babak Nemat Zadeh,
 system, Energy Conversion and Ludger Eltrop, Redmond R. Shamshiri,
 Management 160 (2018) 191–208 Yasaman Amanlou, Solar photovoltaic
[24]Anand. B & Murugavelh. S (2019) A power generation in Iran: Development,
 hybrid system for power, desalination, policies, and barriers, Renewable and
 and cooling using concentrated Sustainable Energy Reviews, Volume
 photovoltaic/thermal collector, Energy 106, 2019, Pages 110-123
 Sources, Part A: Recovery, Utilization, [33]Shayan Keyvanmajd; Behrang Sajadi,
 and Environmental Effects, DOI: Toward the design of zero energy
 10.1080/15567036.2019.1644395 buildings (ZEB) in Iran: Climatic study,
[25]Alayi, R., Kasaeian, A. and Atabi, F. Energy Equipment and Systems, Volume
 (2019), Thermal analysis of parabolic 7, Issue 2, Spring 2019, Pages 111-119.
 trough concentration [34]Abbaspour, M., & Hennicke, P. (2005).
 photovoltaic/thermal system for using in Climate Policy and Sustainable
 buildings. Environ. Prog. Sustainable Development: Opportunities for Iranian-
 Energy, 38: 13220. German Cooperation, Case Study: Solar
 doi:10.1002/ep.13220. Thermal Energy in Iran. Center for
[26]M. Imtiaz Hussain & Jun-Tae Kim (2019) Environment and Energy Research and
 Energy and economic potential of a Studies. Data report. Teheran.
 concentrated photovoltaic/thermal [35]National Building Regulations of Iran:
 (CPV/T) system for buildings in South 19th issue- Energy saving, Road, Housing
 Korea, Journal of Asian Architecture and and Development Research Center of
 Building Engineering, 18:2, 139-144, Iran, third edition, 2010
 DOI: 10.1080/13467581.2019.1606718 [36]Saeid Beygzadeh, Vahid Beygzadeh,
[27]Yousefi H, Ármannsson H, Roumi S, Tohid Beygzadeh, Thermodynamic and
 Tabasi S, Mansoori H, Hosseinzadeh M. economic comparison of photovoltaic
 Feasibility study and economical electricity generation with and without
 evaluations of geothermal heat pumps in self-cleaning photovoltaic panels, Energy
 Iran. Geothermics 2018; 72: 64-73. Equipment and Systems, Vol. 7, No. 3,
[28]Mehdi Jahangiri, Rana Abdollahi Rizi, 2019, pp.263‐270.
 Akbar Alidadi Shamsabadi, Feasibility [37]Ratson Morad, Solar Cogeneration of
 study on simultaneous generation of Electricity and Hot Water at DoD
 electricity and heat using renewable Installations Cogenra Solar, Inc., EW-
 energies in Zarrin Shahr, Iran, Sustainable 201248, June 2014, https://www.serdp-
 Cities and Society, Volume 38, 2018, estcp.org/content/download/35078/3373
 Pages 647-661 84/file/EW-201248-CP.pdf, Availabe
[29]Iran’s Renewable Energy and Energy 2020
 Efficiency Organization (SATBA), [38]German Solar Energy Society (DGS)
 http://www.satba.gov.ir/, March 2020 (Author), Planning and Installing Solar
[30]Aghahosseini A, Bogdanov D, Ghorbani Thermal Systems: A Guide for Installers,
 N, Breyer C (2017) Analysis of 100% Architects and Engineers, 2nd Edition,
 renewable energy for Iran in 2030: 2010, Earthscan
 integrating solar PV, wind energy and [39]Sadegh Motahar, Hamed Bagheri-Esfeh,
 storage. International Journal of Artificial neural network based
 Environmental Science and Technology assessment of grid-connected
 15:17-36 photovoltaic thermal systems in heating
[31]2017 The World Bank, Solar resource dominated regions of Iran, Sustainable
 data: Solargis. Solar resource maps and Energy Technologies and Assessments,
 GIS data for 180+ countries, Solargis. Volume 39, 2020, 100694, ISSN 2213-
 1388,
190 Sadegh Motahar & Ali Kazemi / Energy Equip. Sys. / Vol. 9/No.2/June 2021

 https://doi.org/10.1016/j.seta.2020.10069
 4.
[40]Abdullah Al-Badi (2019): Performance
 assessment of 20.4 kW eco-house grid-
 connected PV plant in Oman,
 International Journal of Sustainable
 Engineering,
 DOI:10.1080/19397038.2019.1658824
[41]C. Renno, F. Petito, Modelling of a linear
 focus concentrating photovoltaic and
 thermal system for different load
 scenarios of a residential user, Energy
 Conversion and Management, Volume
 188, 2019, Pages 214-229,
 https://doi.org/10.1016/j.enconman.2019.
 03.024.
[42]Evangelos Bellos, Christos Tzivanidis,
 Investigation of a nanofluid-based
 concentrating thermal photovoltaic with a
 parabolic reflector, Energy Conversion
 and Management, Volume 180, 2019,
 Pages 171-182,
 https://doi.org/10.1016/j.enconman.2018.
 11.008.
[43]de Lima, L. C., de Araújo Ferreira, L., &
 de Lima Morais, F. H. B. (2017).
 Performance analysis of a grid connected
 photovoltaic system in northeastern
 Brazil. Energy for Sustainable
 Development, 37, 79–85.
[44]Prabhakar Jha; Biplab Das; Behnaz
 Rezaie, Significant factors for enhancing
 the life cycle assessment of photovoltaic
 thermal air collector, Energy Equipment
 and Systems, Volume 7, Issue 2, Spring
 2019, Pages 175-197
[45]Tin-Tai Chow and Jie Ji, “Environmental
 Life-Cycle Analysis of Hybrid Solar
 Photovoltaic/Thermal Systems for Use in
 Hong Kong,” International Journal of
 Photoenergy, vol. 2012, Article ID
 101968, 9 pages, 2012.
 https://doi.org/10.1155/2012/101968.
[46]A.R. Noorpoor & S. Nazari Kudahi
 (2015) CO2 emissions from Iran's power
 sector and analysis of the influencing
 factors using the stochastic impacts by
 regression on population, affluence and
 technology (STIRPAT) model, Carbon
 Management, 6:3-4, 101-116, DOI:
 10.1080/17583004.2015.109031
You can also read