European landrace diversity for common bean biofortification: a genome wide association study - Nature
←
→
Page content transcription
If your browser does not render page correctly, please read the page content below
www.nature.com/scientificreports
OPEN European landrace diversity
for common bean biofortification:
a genome‑wide association study
Leonardo Caproni1,5, Lorenzo Raggi1,5, Elise F. Talsma2,3, Peter Wenzl4 & Valeria Negri1*
Mineral deficiencies represent a global challenge that needs to be urgently addressed. An adequate
intake of iron and zinc results in a balanced diet that reduces chances of impairment of many
metabolic processes that can lead to clinical consequences. In plants, bioavailability of such nutrients
is reduced by presence of compounds such as phytic acid, that can chelate minerals and reduce
their absorption. Biofortification of common bean (Phaseolus vulgaris L.) represents an important
strategy to reduce mineral deficiencies, especially in areas of the world where this crop plays a key
role in the diet. In this study, a panel of diversity encompassing 192 homozygous genotypes, was
screened for iron, zinc and phytate seed content. Results indicate a broad variation of these traits
and allowed the identification of accessions reasonably carrying favourable trait combinations. A
significant association between zinc seed content and some molecular SNP markers co-located on the
common bean Pv01 chromosome was detected by means of genome-wide association analysis. The
gene Phvul001G233500, encoding for an E3 ubiquitin-protein ligase, is proposed to explain detected
associations. This result represents a preliminary evidence that can foster future research aiming at
understanding the genetic mechanisms behind zinc accumulation in beans.
Micronutrient deficiencies globally afflict more than two billion p eople1. Such deficiencies mostly occur when
the intake of minerals and vitamins is too low to maintain good health and development or can also be caused
by a combination of factors such as poor diet, disease and/or increased micronutrient n eeds2–4. Limited access,
low availability, scarce intake or complete lack of fisheries and livestock in the diet, consumption of staple crops
characterised by low tissue mineral concentration, and/or low mineral bioavailability can result in the impair-
ment of many metabolic processes leading to clinical c onsequences5–7. In this context, mineral deficiencies are
currently considered among the most serious global challenges to face in the next decades6.
Among pathologies caused by mineral deficiencies, anaemia affects roughly a third of the world’s population.
The World Health Organisation assessed that worldwide 42% of pregnant women, 30% of preschool children
(aged 0 to 5 years) and 12.7% of men older than 15 years are a naemic8. It has been recently estimated that roughly
half of the cases of anaemia worldwide are associated with a scarce iron dietary intake and absorption9,10. Iron
is an essential component of haemoglobin in red blood cells and myoglobin in muscles, which contain around
60% of total body iron10. In humans, iron is necessary for correct functioning of several cellular mechanisms,
including DNA synthesis and mitochondrial energy g eneration11. Indeed, Iron Deficiency Anaemia (IDA) has
been associated with several chronic diseases such as chronic kidney d isease9, chronic heart f ailure12, cancer
13
and inflammatory bowel disease .
Zinc is the second most abundant mineral element in the human body and is the most abundant intracellular
one14. Although its abundance, in humans there is no dedicated store; the lack of a zinc reserve causes impairment
of some physiological functions when the availability of this element is scarce. It has been reported that inad-
equate zinc intake—as result of a diet low in zinc itself or rich in phytate—is the main cause of zinc deficiency15,16.
As zinc has a large number of physiological roles in humans, especially in regulating growth and functioning
of the immune system17, a deficiency can lead to diverse clinical conditions among which growth failure, easy
development of infections or decline in muscle work capacity can have the most severe consequences15. Regard-
ing zinc, its deficiency seems to be as common as I DA18.
1
Dipartimento di Scienze Agrarie, Alimentari e Ambientali (DSA3), Università Degli Studi Di Perugia, Borgo XX
Giugno 74, 06126 Perugia, Italy. 2Division of Human Nutrition and Health, Wageningen University and Research,
PO Box 17, 6700 AA Wageningen, The Netherlands. 3HarvestPlus, International Center for Tropical Agriculture
(CIAT), Km 17 Recta Cali‑Palmira, Cali, Colombia. 4Genetic Resources Program, International Center for Tropical
Agriculture (CIAT), Km 17 Recta Cali‑Palmira, Cali, Colombia. 5These authors contributed equally: Leonardo
Caproni and Lorenzo Raggi. *email: valeria.negri@unipg.it
Scientific Reports | (2020) 10:19775 | https://doi.org/10.1038/s41598-020-76417-3 1
Vol.:(0123456789)
www.nature.com/scientificreports/
Many crops—including legumes, cereals and vegetables—are rich sources of phytic acid (myo-inisitol-
1,2,3,4,5,6-hexa-kis-phospate, InsP6) and its derivatives (InsP5, InsP4)10,16. IndP6 and its derivates are the most
abundant storage form of phosphorus in plant seeds; they are accumulated during the ripening period and con-
stitute 60% to 90% of total phosphorus store in s eeds19. Converted into phosphates during germination, these
compounds are the major source of phosphorus during seedling d evelopment20,21. On the other hand, due to their
ability to chelate minerals, these compounds act as anti-nutrients: phytic acid binds to mono and divalent dietary
mineral cations forming phytate complexes that are very stable at neutral p H22,23. A high phytate intake is gener-
ally associated with reduced mineral absorption—especially of iron and zinc—in the gastrointestinal tract16. Iron
and zinc bioavailability for humans is generally estimated through molar ratios calculation of phytate:minerals. It
has been reported that molar ratio values of phytate:iron above 1 have negative effect on iron absorption24 while
a phytate:zinc molar ratio major than 15 is associate with low zinc b ioavailability25.
In order overcome mineral deficiencies, several strategies can be considered: (i) food diversification, (ii)
mineral supplementation, (iii) food fortification and (iv) b iofortification2,7. The latter is defined as a process
that relies on agronomical practices, conventional plant breeding or modern biotechnology to increase nutrient
density and bioavailability in edible parts of c rops2. Even if many nutritional traits can possibly be enhanced
through biofortification, to date, most of research efforts focused their attention on minerals and v itamins26.
Common bean (Phaseolus vulgaris L.) is one of the most important sources of proteins and nutrients, like
iron and zinc, for millions of people living in areas of the world where prevalence of undernourishment is the
highest (e.g. Eastern Africa, as part of the Sub-Saharan Africa (31.4%) and the Caribbean (16.5%))1,27. Indeed, in
some parts of these regions, cereal/bean-based diets can cause iron and zinc d eficiency27. As such, biofortification
of beans would allow to increase dietary intake of iron and zinc without requiring any food behaviour change
of people living in the above-mentioned areas, where beans have a key role in their diet, making this approach
potentially successful.
It is well known that common bean offers wide variability in terms of iron and zinc concentration, which is
a basic requirement for attaining biofortification through plant breeding.
In common bean iron concentration ranges from 35 to 90 µg/g28 and is higher when compared to other major
crops such as rice (6.3 to 24.4 µg/g)29, wheat (25 µg/g to 56 µg/g)30 and maize (9.6 to 63.2 µg/g)31. This species
also shows relatively high zinc seed content (21 to 54 µg/g28). Nevertheless, common bean seeds are also charac-
terised by high phytate content (1–3% of total seed w eight16,32) that significantly reduces mineral bioavailability.
The common bean is a predominantly self-pollinating species, characterised by a diploid set of 11 chromo-
somes. The germplasm of this species can be classified into two distinct genepools; many studies confirmed
such genetic structure that derives from two independent domestication events, occurred in Central and South
America, giving rise to the Mesoamerican and the Andean genepool, r espectively33.
Screening unexplored common bean diversity can possibly disclose accessions of interest for breeding and, at
the same time, allows to study which genetic determinants can potentially contribute to the regulation of various
traits, including those relevant for biofortification.
To date, genetic control of iron, zinc and phytate seed content in beans has been the object of several studies.
In this species, Quantitative Trait Loci (QTL) analyses of biofortification-related traits have been conducted using
bi-parental mapping populations from both intra and inter genepool c rosses34–36. Some genomic regions were
already associated with the accumulation of iron and zinc in seeds, most notably in 8 out of 11 c hromosomes37;
a similar approach has also been used for phytate. It has been shown that a number of QTLs control the accumu-
lation of phytate and phosphorus in bean seeds. Some of these QTLs were associated with phytic acid pathway
genes, in particular the myo-inisitol (3)P1 synthase gene as well as other loci in the bean genome38.
Currently, Genome Wide Association Studies (GWAS) are regarded as the next step, after QTL mapping, to
potentially identify candidate genes involved in the control quantitative traits39. The GWAS approach represents
an alternative strategy to QTL mapping, in fact it can generally consider a higher number of recombination events
by using a wide panel of diverse individuals within a defined species40, each of them potentially characterised
by a diverse “recombination history”. GWAS has been applied to a multitude of quantitative traits in common
bean41–44, including those related to iron and zinc b iofortification37,45.
During the last decade, progress has been made to foster biofortification of staple c rops46; in fact, many
reliable and cost-effective methods have been developed and validated to screen large panels of accessions.
Regarding minerals, methods based on Energy Dispersive X-Ray Fluorescence (EDXRF) technology have been
developed for wheat, rice, pearl m illet47 and, recently, also for maize and common b ean48. The EDXRF is based
on the principle that each element upon exposure to X-rays of suitable energy produces secondary ‘fluorescent’
X-rays. The emitted X-ray spectrum is indicative of the element and the intensity is related to its c oncentration48.
The EDXRF is a non-destructive technology (i.e. no chemical reagents are needed), a feature that reduces costs,
time and avoids the production of toxic waste.
The aims of this work were to: (i) explore the diversity of a panel of highly homozygous common bean geno-
types for iron, zinc and phytate seed content, (ii) use reliable and cost-effective methods for phenotyping, (iii)
identify genotypes characterised by high biofortification potential and (iv) test associations between the studied
quantitative traits and the genetic constitution of the panel.
Results
Iron, zinc and phytate quantification method evaluations. Considering the high number of ana-
lysed samples, the quick, non-destructive and, chemical reagent-free EDXRF method was the one of choice for
iron and zinc analyses. Low coefficients of variation between experimental replicates, recorded for both minerals
(0.9% and 2.3% for iron and zinc, respectively), indicated high reproducibility of the used protocol.
Scientific Reports | (2020) 10:19775 | https://doi.org/10.1038/s41598-020-76417-3 2
Vol:.(1234567890)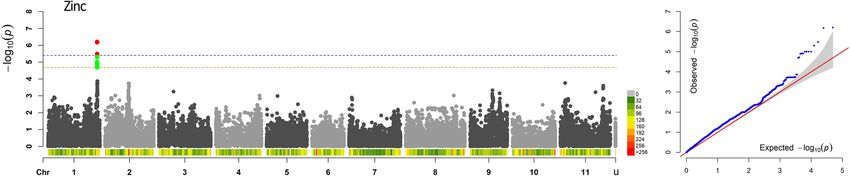
www.nature.com/scientificreports/
Mean Range (min–max) CV (%) He2Ba (SE) Spatial model Efficiency (%)b
c
Iron (µg/g) 61.7 38.4–93.7 31.3 0.168 (0.148) Crd 100
Zinc (µg/g) 30.7 18.9–43.6 31.1 0.414 (0.131) Crd 100
Phytate (mg/g) 11.9 4.8–19.9 34.7 0.434 (0.133) Crd 100
Table 1. Descriptive statistics, He2B and spatial model along with its efficiency of iron, zinc and phytate
seed content BLUEs of 192 common bean genotypes. a Broad sense heritability. b Spatial model efficiency.
c
Completely randomised design.
Figure 1. Boxplots of BLUE values of 178 common bean genotypes according to their genepool attribution:
Mesoamerican (K1, magenta) and Andean (K2, yellow).
To ensure a high quality phytate characterisation, a method based on the procedure developed by Latta and
Eskin49 was used after minor modification. With an average coefficient of variation of total seed phytate between
experimental replicates of 2.9% only, this method showed high reproducibility too.
Iron, zinc, phytate quantification and data analysis. Iron, zinc and phytate quantification was per-
formed on seed samples from a single, partially replicated experiment carried out under controlled conditions;
the collected samples allowed to successfully characterise 93% of the 192 genotypes included in the trial. Results
of the analysis for possible spatial biases due to plant position showed that the Completely randomised design
(Crd) was always the most efficient model over the others; this evidence confirmed that the used experimental
design did not introduce any spatial bias. Best Linear Unbiased Estimators (BLUEs) were then calculated for the
three traits (Table S1). BLUEs analyses showed that the panel is characterised by a high level of phenotypic diver-
sity (Table 1). Estimated levels of broad sense heritability (He2B) were also relatively high for zinc and phytate
while lower for iron (Table 1).
A significant correlation between ‘iron and zinc’ seed content was observed (Pearson’s coefficient 0.50,
p ≤ 0.001); significant correlations were also observed between ‘phytate and iron’ and ‘phytate and zinc’ with
values of 0.38 and 0.46, respectively (p ≤ 0.001). Within the screened panel, iron and zinc seed content showed a
wide range of variation (Table 1) while phytate was characterised by lower range of variation (Table 1).
Three genotypes of Mesoamerican origin showed particularly high iron seed content (> 90 µg/g; 95th per-
centile = 82.9 µg/g): two of the genotypes derived from different landrace climbing accessions from Costa Rica
(PI-309837 and PI-309885) while the other from an Italian bushy landrace (4135, FAO-363). Genotypes 4914,
7185, G993, G20110A, PI-309837, PHA1916 and PHA1474, derived from six landraces and a single cultivar,
resulted the most promising accessions for zinc seed content (95th percentile = 41.8 µg/g). Finally, five accessions
characterised by low phytate were also identified: developed from an Italian landrace of Andean origin, genotype
5071 showed the lowest value (≤ 6.0 mg/g, unique case) while other four genotypes—PHA6857, G1018, G10252,
G11573—showed a phytate content minor than 7.0 mg/g (5th percentile = 7.2 µg/g).
Results of the characterisation were also analysed considering genotype attributions to the Mesoamerican
and the Andean genepool by taking advantage of a previous analysis of the genetic structure of this p anel41,50.
When the factor ‘genotype origin’ (i.e. Mesoamerican or Andean) was considered, no significant differences
(p ≤ 0.001) were observed (Fig. 1). Dispersions of iron, zinc and phytate BLUEs—grouped according to the
genepool attribution—are reported in Fig. 1.
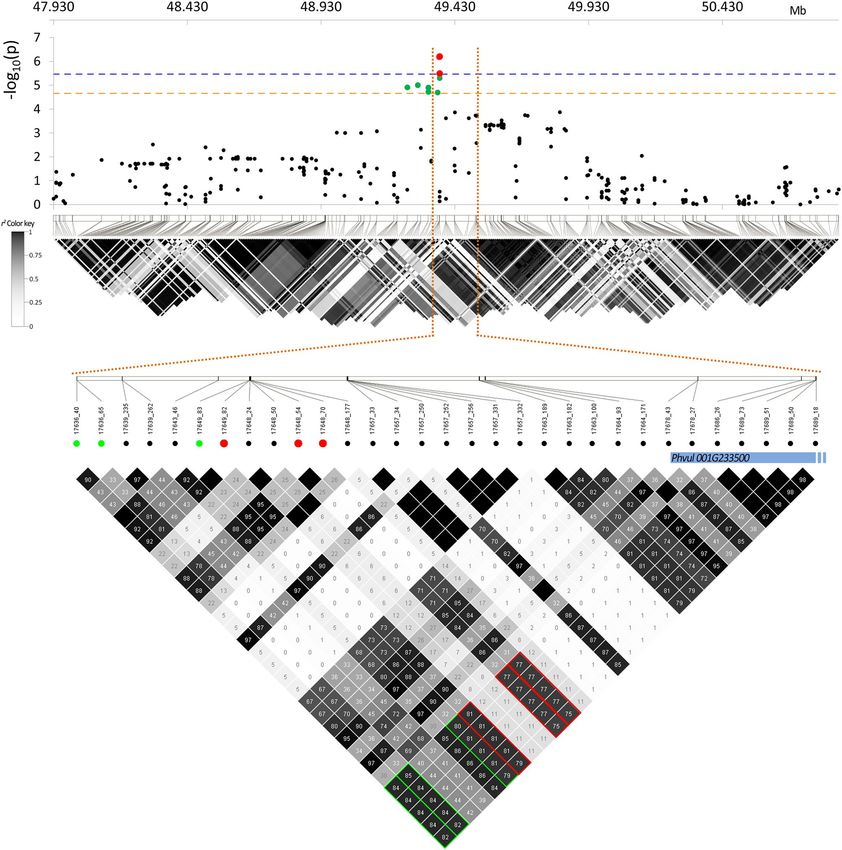
Bearing in mind the desired levels of the three traits together (i.e. high iron, high zinc and low phytate), the
pure line G15790—derived from a Spanish landrace of Andean origin—resulted the most promising: its seed
is characterised by high iron (87.9 µg/g), high zinc (37.5 µg/g) and, low phytate content (8.8 mg/g) (Fig. 2a,b).
Furthermore, the pure line PI-309837—derived from a Mesoamerican landrace from Costa Rica—showed the
best combination of iron and zinc, both over the 95th percentile (93.7 and 42.6 µg/g, respectively); however, this
line is also characterised by high phytate seed content (15.6 mg/g) (Fig. 2a,b).
Scientific Reports | (2020) 10:19775 | https://doi.org/10.1038/s41598-020-76417-3 3
Vol.:(0123456789)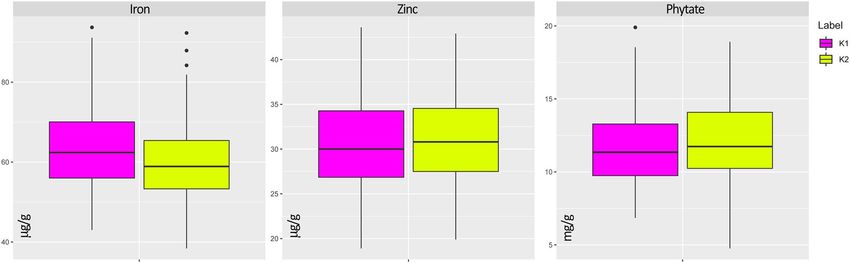
www.nature.com/scientificreports/
Figure 2. Bubble plot (a) and line plot (b) of iron, zinc and phytate BLUEs of 178 common bean genotypes. In
the bubble plot (a), the two axes show iron and zinc seed content, while the area of the bubbles is according to
total phytate seed content. Genotypes with best combination of the three traits are highlighted in green. In the
line plot (b), genotypes are plotted according to increasing levels of phytate (green dots), for each genotype, iron
(red dots) and zinc (yellow dots) seed content are also reported.
Figure 3. Two-dimensional PCA of iron, zinc and phytate BLUEs of 178 common bean genotypes. In the biplot
genotype colours are according to genetic STRUCTURE groups: K1 Mesoamerican (magenta), K2 Andean
(yellow) and admixed (black) while shapes to geographical origin: Europe (dot), Central America (triangle)
and South America (square). In the biplot, projections of the original axes (variables) onto the scattergram are
reported in green.
In the Principal Component Analysis (PCA) of the three traits, the first two principal components explained
84.1% of the total variation (Fig. 3). According to the results, neither geographical origin (i.e. Europe, South and
Central America) nor membership to the different genetic groups (Mesoamerican or Andean) explained the
observed phenotypic diversity. As from results of the PCA, most of the samples are characterised by low iron,
zinc and phytate content (PC1, negative values).
Estimation of iron and zinc relative bioavailability. Within the screened bean diversity panel,
phytate:iron ranged from 8.2 to 32.0 (mean 16.7) while phytate:zinc from 19.8 to 76.5 (mean 39.0) (Table S1).
Results indicated genotype 5071 (ITA-363) and G15790 (CIAT) as those characterised by the best molar ratios
with values of 8.2 and 8.4 and of 19.8 and 23.2 for phytate:iron and phytate:zinc, respectively. Notably, these two
genotypes were already identified for lowest phytate seed content (5071) and best overall combination of the
three traits (G15790).
Genome‑wide association analysis. In the GWAS analysis—carried out through a Mixed-Linear Model
(MLM) accounting for both population structure and genetic cryptic relatedness on a pruned-dataset of 49,518
SNPs—two thresholds of significance were calculated at two different alpha levels. Since 2443 independent
recombination blocks were identified within the panel, the two Bonferroni thresholds of significance for associa-
Scientific Reports | (2020) 10:19775 | https://doi.org/10.1038/s41598-020-76417-3 4
Vol:.(1234567890)www.nature.com/scientificreports/
Figure 4. Manhattan and QQ-plot of zinc seed content. In the Manhattan plot, the horizontal lines indicate the
genome-wide significance thresholds: 5.4 (blue, Bonferroni correction based on α = 0.01) and 4.7 (orange, based
on α = 0.05). SNPs with a p-value above the selected thresholds are highlighted in red and green, respectively. For
each chromosome, SNP density within 1 Mb window is reported. SNP density is according to the colour key.
SNP Chromosome Positiona −Log10(p) R2 MAF
17648_70 Pv01 49,373,158 6.20 0.153 A (0.48)
17648_54 Pv01 49,373,142 6.17 0.153 A (0.48)
17649_82 Pv01 49,373,009 5.48 0.136 A (0.48)
Table 2. List of SNPs associated with zinc seed content (α = 0.01). Chromosome physical position, significance
level (−Log10(p)) of the detected association, phenotypic variation explained by the SNP ( R2) and Minor Allele
Frequency (MAF) are reported. a P. vulgaris reference genome v1.0.
tion analyses were set at 5.4 and 4.7 – log10(p) using alpha values of 0.01 and 0.05, respectively. Considering such
conservative thresholds, no significant associations were detected for iron and phytate seed content. However,
the GWAS analysis revealed significant associations between zinc seed content and 12 SNPs located on a distal
portion of chromosome Pv01, spanning over a window of about 120 kb (Fig. 4). The three SNPs characterised by
lowest p-values (17648_70, 17648_54 and 17649_82) co-localised in a chromosome segment of 150 bp only and
resulted significant also after the application of the most severe Bonferroni correction (alpha = 0.01). Significant
markers within this genomic region explained a proportion of the phenotypic variation of zinc seed content
from 0.136 to 0.153 (Table 2). Features of the three SNPs associated with zinc are reported in Table 2 while
of the other SNPs significantly associated after the correction based on alpha = 0.05 in Table S2. The search of
positional candidate genes for the detected associations resulted in the identification of Phvul001G233500. Such
candidate encodes for a E3 ubiquitin-protein ligase characterised by a specific domain selectively interacting
with zinc ions.
Linkage disequilibrium analysis. According to our results, the three SNP markers characterised by the
lowest p-values and the candidate gene fall in a genomic region of about 200 kb (Fig. 5). Size of this genomic
region is compliant with the evidence from a previous study—carried on the same panel of genotypes and using
the same SNP pruned-dataset—where LD decays on average within 240 kb41.
Results of the Linkage Disequilibrium (LD) analysis showed that SNP markers significantly associated with
zinc seed content and the identified positional candidate Phvul001G233500 are characterised by high r2 values
(Fig. 5). In particular, the three most significant markers are characterised by r2 values ranging from 0.75 to 0.81
with markers localised within the gene (Fig. 5, bottom, red dots); such evidence shows non-random occurrence
of alleles at significant loci with those located within the sequence of best identified candidate gene. This also
applies to markers that remained significant after the application of Bonferroni correction considering an alpha
of 0.05 (4.7) (Fig. 5, bottom, green dots).
Discussion
The used common bean panel of diversity41,50 resulted an excellent experimental material to screen the within-
species phenotypic variation of iron, zinc and phytate seed content. The methods used for the phenotyping
showed high reproducibility and, at the same time, can be regarded as cost-effective tools for biofortification-
oriented breeding programmes. According to our results, the explored phenotypic diversity was high for all three
traits when compared to other extensive germplasm characterisations26,38,45,51. Results of our screening allowed to
identify promising accessions carrying favourable levels or combinations of the studied traits. In addition, taking
advantage of the latest genomic analysis methods, we were also able to detect a candidate potentially involved
in the regulation of zinc accumulation in bean seeds.
Iron, zinc and phytate quantification methods. Regarding the available options to perform simulta-
neous determination of mineral elements in plants, Inductively Coupled Plasma-Optical Emission Spectrometry
(ICP-OES) has been extensively used in recent y ears52 and applied to biofortification-oriented r esearch51,53. Even
Scientific Reports | (2020) 10:19775 | https://doi.org/10.1038/s41598-020-76417-3 5
Vol.:(0123456789)www.nature.com/scientificreports/
Figure 5. Top: Manhattan plot and LD heatmap of zinc seed content over a chromosomic region (Pv01)
of ± 1.5 Mb centred on the associated SNP markers. In the Manhattan plot, the horizontal lines indicate the
genome-wide significance thresholds: 5.4 (blue) and 4.7 (orange) for Bonferroni correction based on α = 0.01
and α = 0.05, respectively. SNPs with a p-value above the selected thresholds are highlighted in red and green,
respectively. Bottom: LD heatmap zoom over a chromosomic region of 180 kb containing the associated SNPs
and the positional candidate gene. In the figure r2 values (%) between SNP markers and the candidate are
highlighted according to their significance: in red and green for α = 0.01 and α = 0.05, respectively. In the figure
physical position of the identified gene (Phvul001G233500) is reported (blue bar).
if ICP-OES has proved to be an accurate method, it requires lengthy sample preparation, costly reagents and
highly trained analysts; consequently, it does not provide as a matter of fact a practical and cost-effective tool
to perform extensive germplasm characterisation. On the other hand, EDXRF has shown to be a cost-effective
method to screen high number of samples being already validated for iron and zinc in common bean, maize
and cowpea48. In our study this technique has been successfully used to generate an accurate and reproducible
phenotypic characterisation.
Regarding the quantification of phytate seed content, the use of the modified Latta-Eskin method allowed to
produce an extensive phenotypic characterisation too. Low cost of reagents, and the use of a resin that can easily
be regenerated multiple times, makes this method cost-effective and suitable to screen within-species diversity. In
Scientific Reports | (2020) 10:19775 | https://doi.org/10.1038/s41598-020-76417-3 6
Vol:.(1234567890)www.nature.com/scientificreports/
addition, low coefficients of variation between replicates further confirmed its reproducibility and reliability. The
combination of these methods opens new possibilities to effectively phenotype large common bean germplasm
panels at low cost and high effectiveness; in our opinion, these aspects are relevant conditions to enhance future
efforts of biofortification-oriented common bean breeding programs.
Iron, zinc and, phytate characterization. Results of the phenotypic characterisation of iron and zinc—
based on a single, partially replicated experiment under controlled conditions—are in line with those reported
by other s tudies28,54,55. In particular, we observed iron and zinc ranges compliant with levels recorded in the
world largest common bean core collection (1031 accessions) held at C IAT28, where iron ranged from 34 to
89 µg/g (mean 55 µg/g) while zinc from 21 to 54 µg/g (mean 35 µg/g). Concerning phytate, our screening
revealed the existence of high variability; reviewing the existing literature, Sparvoli and colleagues reported a
wider window of variation (from 3.4 to 28.7 mg/g)16; however, it should be noted that the reviewed studies used
different quantification methods and germplasm, this could have affected the reported variability.
The three genotypes identified in our study that showed the highest potential to increase iron seed content
were developed starting from Mesoamerican landrace accessions. Even if no correlation between geographic dis-
tribution and iron seed content has been reported in the literature, and confirmed by our data, a previous study28
highlighted the tendency of Andean genotypes to have higher iron concentration than Mesoamericans. On the
contrary, in our diversity panel, Mesoamerican genotypes were characterised by a slightly higher average value
when compared to the Andeans (64.1 µg/g vs. 59.6 µg/g, respectively); however, this difference was not significant
indicating that, in this species, iron seed content is not substantially affected by genepool membership. Similarly,
the phenotypic characterisation of zinc allowed the identification of other genotypes that could be exploited to
develop cultivars characterised by an increased content of this mineral. Also in this case, genepool membership
did not affected the expression of this the trait. Interestingly, characterising a common bean collection of breed-
ing lines of Middle American ancestry, McClean and colleagues observed iron content ranging from 47.0 to 83.5
(mean 61.4) while zinc from 23.50 to 38.1 (mean 30.87)56. Even if our collection encompasses a lower number of
Mesoamerican genotypes, its variability for the same minerals resulted wider: from 43.0 to 93.7 (mean 63.61) for
iron and from 18.9 to 43.6 (mean 30.4) for zinc. In our opinion this is a good indication that supports the use of
landraces when screening complex quantitative traits like accumulation of iron and zinc in seeds.
Iron and zinc relative bioavailability. The quantification of iron, zinc and phytate seed content allowed
to estimate relative bioavailability of the two minerals that is commonly calculated as the molar ratio of
phytate:minerals. Values of the molar ratios observed within the diversity panel gave a comprehensive overview
of the natural variation of this important nutritional aspect within this species. In this regard, quite different con-
ditions were found. Interesting enough, some accessions showed promising bioavailability levels, especially for
zinc. In particular, the best identified genotype (5071, ITA 363) is characterised by a phytate:zinc molar ratio of
19.8 that is very close to the threshold of 15 generally associated with moderate zinc bioavailability (correspond-
ing to about 15% of total zinc bioavailable)25,57. It is noteworthy to mention that the molar ratios reported in our
study were obtained though analysis of unprocessed bean seeds. In fact, it has been showed that seed phytic acid
content can decrease after seed processing (soaking in particular) due to activation of an endogenous phytase
(myo-inositol hexakisphosphate phosphohydrolase)19. This suggests that higher mineral bioavailability levels are
expected to occur after processing; this also applies to the most promising genotypes.
These findings confirm the importance of screening underutilised landrace germplasm when looking for qual-
ity traits. Often characterised by favourable combinations of quality traits (e.g. good taste or flavour) landraces
also offer great potential to attain better human nutrition as shown by our results. For instance, the line derived
from the accession G15790 showed good phytate:minerals molar ratio values and best overall combination of
the three traits; this genotype can profitably be included in biofortification-oriented common bean breeding pro-
grammes or—after testing consumer acceptance—even be used for direct cultivation and human consumption.
Genome‑wide association analysis for biofortification. The use of a partially replicated experi-
mental design allowed to perform association analyses using data from a single experiment carried out under
controlled conditions allowing to test for possible spatial biases due to plant position. As from the results of
the bi-dimensional spatial analysis, the ‘Completely randomised design’ (Crd) was the best model for BLUEs
calculation showing that no biases affected the produced phenotypic dataset. This evidence confirms that use
of same soil composition, soil volume and, growing conditions allowed to achieve high standardisation of the
experiment. The partially replicated experimental design also allowed to estimate broad sense heritability of the
three studied traits using data from single year; this is particularly relevant since a high heritability is a prerequi-
site to succeed GWAS42,58. We observed relatively high heritability for zinc and phytate while a lower value was
estimated for iron. According to our results, iron seed content variability within biological replicates can be the
main reason explaining the absence of associations with the genetic constitution of the diversity panel. However,
it should be always considered that the reported heritability values are estimations based on a single experiment
carried out in isolated and highly standardised conditions. Collecting data on phytate and mineral on the same
genotypes in multiple locations across different growing seasons will allow to test the role of the environment on
mineral and phytate seed accumulation.
The MLM used in this study, accounting for both genetic structure and kinship, allowed to identify significant
associations between seed zinc content and a genomic segment in chromosome Pv01. According to our results
Phvul001G233500 is the best positional candidate to explain the effect of the significant SNPs co-located in this
region, spanning over a chromosomic portion of 42 kb. Phvul001G233500 encodes for a E3 ubiquitin-protein
ligase which is an intracellular membrane-localised protein with E3 ligase activity and its C-terminus facing the
Scientific Reports | (2020) 10:19775 | https://doi.org/10.1038/s41598-020-76417-3 7
Vol.:(0123456789)www.nature.com/scientificreports/
cytoplasm. This protein is known to be involved in the regulation of Abscisic Acid (ABA) signalling. Encoded by
the homolog At3G55530, the overexpression of this protein lead to an increased sensitivity to ABA in Arabidopsis
thaliana, while loss of function alleles to a decreased sensitivity59.
More relevant for our study is the fact that this protein is characterised by a specific domain interacting
selectively and non-covalently with zinc ions. In addition, in P. vulgaris, this gene is highly expressed in the green
pods (i.e. during seed development); in our opinion, this evidence might explain its possible involvement in the
translocation of zinc into seeds. Interestingly, a recent study by Izquierdo and colleagues37 evidenced the presence
of a meta-QTL significantly associated with both iron and zinc seed content in the same region of chromosome
Pv01. Even if the authors proposed a different candidate (i.e. Phvul001G225000), the genomic region harbouring
this gene is relatively close to the one found in our work, at about 650 kb. Since in our study no clear association
was found for iron seed content in the same chromosomic region, a potentially different QTL mechanism from
that proposed by Izquierdo and colleagues emerges. However, results of both studies confirm that this distal
region of chromosome Pv01 harbours genes involved in zinc accumulation; if additional studies will confirm
the role of this genomic portion, this knowledge will contribute fostering future breeding activities aiming at
releasing beans characterised by higher zinc content. It is also relevant to mention that another recent GWAS by
Katuuramu and colleagues45 revealed the presence of other regions significantly associated with zinc content on
chromosomes Pv07 and Pv10, not found in our study; these results were obtained screening cooked dry beans on
a diversity panel composed of Andean genotypes only. The complex genetic control of the regulation of mineral
content in seeds, together with the use of different germplasm can reasonably explain the identification of dif-
ferent chromosomic regions. Indeed, the amount of minerals in seeds depends on a high number of processes
like their mobilisation from the soil, uptake by roots, translocation, and redistribution within the plant. Each of
these processes is likely to be under the control of many genes, making the accumulation of minerals in seeds
a highly complex polygenic trait60. It is known that the absorption and translocation of cations, such as zinc, is
carried out by carbon-based compounds through non-covalent i nteractions61 as for the protein encoded by the
gene identified in this study. This evidence supports a possible contribution or major effect of Phvul001G225000
in the control of zinc accumulation in common bean seeds. Rather reliable in terms of number of analysed geno-
types and SNP markers, minerals and phytate quantification methods and the GWAS model, this result must
be considered a preliminary evidence; future GWAS, based on data from multilocation field trials, will possibly
confirm the major role of this gene in the accumulation of zinc in bean seeds.
Conclusions
Iron and zinc deficiencies are widely spread nutritional disorders, affecting billions of people worldwide. Thanks
to many efforts of the international research community, iron and zinc biofortification has been already achieved
for some crops where major genes involved in the translocation of these minerals have been identified62–64.
Regarding the common bean, efforts are still needed to develop better iron and zinc biofortified varieties also
characterised by high bioavailability of these minerals. Development and utilisation of biofortified bean varieties,
characterised by high nutritional value, will potentially have a strong beneficial impact on more than two billion
people living in areas where beans play a main role in their diet.
Materials and methods
Plant material. The bean diversity panel used in this study was already described by Caproni and
c olleagues50. Briefly, a total of 192 highly homozygous common bean genotypes (i.e. pure lines) were initially
developed starting from 179 landraces and 13 cultivars by five generations of Single Seed Descent (SSD). The idea
behind the constitution of this diversity panel was also to represent a relevant portion of the European common
bean diversity (153 accessions) also including some accessions from the Americas (22 and 17 from South and
Central America, respectively). A balanced representativeness of the two existing common bean genepools65,66
was obtained by including a similar number of Andean and Mesoamerican accessions in the panel41,67. The
original accessions were obtained from the International Center for Tropical Agriculture (CIAT, Cali, Colombia)
(70), University of Perugia (Perugia, Italy, ITA-363) (58), United States Department of Agriculture (USA) (34),
IPK Gatersleben (Gatersleben, Germany) (28) and NordGen (Alnarp, Sweden) (2).
Experimental setup. In order to produce seed samples for subsequent iron, zinc and phytate quantifica-
tion, each genotype (entry) was grown under isolated condition in a nursery at the experimental station of the
Department of Agricultural, Food and Environmental Science (DSA3) of the University of Perugia, located in
Sant’Andrea d’Agliano (43°3′15.12″ N; 12°23′41.64″ E, 175 m a.s.l., Perugia, Italy), in a single experiment, carried
out in 2017. Plant isolation was obtained covering the experiment with a standard anti-insect net. Plants were
sowed in pots (diameter 40 cm), using a soil mixture of clay loam (40%) and potting compost (60%)68; plants
were supplied with water throughout the growing cycle using an automatic drip irrigation system. Plants were
arranged using a partially replicated randomised design in which five genotypes were replicated five times while
two six times, producing a total of 222 samples out of 192 entries41,50.
Sample preparation. At maturity, seed samples were manually harvested, dried, and stored carefully,
avoiding any possible contact with metal objects. Seed samples were then prepared for the analyses as follows: (i)
surface cleaned with ethanol to remove potential soil and dust traces; (ii) oven-dried at 60 °C for 72 h to stand-
ardise and reduce the relative humidity; (iii) 4.3 g of seeds (± 0.1 g) weighted and milled for 4.0 min in a custom-
built system (CIAT, Cali, Colombia) equipped with elliptical chambered Teflon capsules and 10.0 mm zirconium
oxide beads. The resulting fine flour was used to perform mineral and phytate quantification.
Scientific Reports | (2020) 10:19775 | https://doi.org/10.1038/s41598-020-76417-3 8
Vol:.(1234567890)www.nature.com/scientificreports/
Conditions Iron Zinc
Atmosphere Air Air
X-Ray tube Tungsten Tungsten
Voltage (kV) 26 15
Current (µA) 115 200
Acquisition time (s) 180 180
Tube filter W5 A6
Table 3. EDXRF conditions used for the analysis of the samples.
Iron and zinc quantification. Iron and zinc analyses were carried out using EDXRF on an X-supreme
8000 (Oxford Instruments, Abingdon-on-Thames, UK) fitted with a 10-sample carousel. Scans were conducted
on 4.0 g of sample in aluminium cups assembled with polypropylene inner cups, sealed at one end with 4 µm
Poly-4 XRF sample film. Method calibration and validation are described in detail by Guild and colleagues48.
Measurement conditions for the two minerals are reported in Table 3.
Phytate extraction, purification, and quantification. Phytate extraction was carried out using 0.50 g
of fine bean sample flour mixed with 20 ml of hydrochloric acid (HCl) 0.65 M in a 50 ml polypropylene tube
(VWR, Radnor, Pennsylvania, USA). The resulting mixture was mechanically shaken using a VX 2500 multitube
vortex (VWR, Radnor, Pennsylvania, USA) for 2 h and then centrifuged at 3600 rpm at 18 °C for 15 min in a
5810R centrifuge (Eppendorf, Hamburg, Germany). Then, an aliquot of 10 ml of the supernatant was transferred
into a 15 ml polypropylene tube (VWR Radnor, Pennsylvania, USA).
Total phytate content was then quantified using a modified Latta and E skin49 procedure, as in Park and
colleagues69, using poly-prep pre-filled chromatographic columns containing AG-1-X8 anion exchange resin
(100–200 mesh chloride form, 0.8 × 4 cm) (Bio-Rad Laboratories, Richmond, California, USA).
In order to bind phytates with the resin, 2 ml of the previously collected supernatant were diluted using
6 ml of deionised water (1:4) and loaded on the column placed on an Extraction Vacuum Manifold operating
at atmospheric pressure. Column-bound phytate were washed using 10 ml of 0.07 M Sodium Chloride (NaCl)
to eliminate free phosphates and other impurities. Phytate were subsequently eluted using 30 ml of 0.7 M NaCl
(i.e. 3 × 10 ml washes).
Phytate quantification was carried out using an aliquot (900 µl) of the eluate mixed with 300 µl of the Wade
reagent (0.03% iron (III) chloride, 0.3% sulfosalicylic acid). The absorbance of salicylate-Fe (III) was estimated
at 500 nm using an Epoch 2 microplate spectrophotometer (BioTek, Winooski, Vermont, USA). For each experi-
ment, the concentration of total phytate was estimated using a calibration curve prepared with a solution of
phytic acid dipotassium salt (Sigma-Aldrich, Saint Louis, Missouri, USA) and 0.7 M NaCl, using concentra-
tions ranging from 0 to 60 µg/ml. To monitor method performance, each sample was extracted, purified, and
quantified in duplicate.
Iron, zinc and phytate data analyses. The partially replicated experimental design allowed the calcula-
tion of Best Linear Unbiased Estimators (BLUEs) of iron, zinc and phytate seed content. BLUEs were generated
using GenStat70 software71,72. In brief, for each of the three traits, BLUEs of genotype effects were calculated
using the most suitable spatial model determined for the row and column field layout as described by Singh and
colleagues73. Out of the nine tested models, the best was then selected in accordance to the Akaike Information
Criterion74. This procedure also allowed the estimation of broad sense heritability (He2B) for each trait, based on
data from a single, partially replicated experiment carried out under controlled conditions.
The following analyses were performed using the BLUEs dataset. Descriptive statistics, frequency distribu-
tion and Pearson’s correlation coefficients among traits were estimated using the R package ‘agricolae’75 and
the software ‘Past3’76. A Principal Component Analysis (PCA) was then carried out on normalised data taking
into account sample origin (Europe, Centrale and South America) and information on the genetic structure of
the panel41. Trait differences between different genetic groups were then tested using the univariate t-test and
visualised as data dispersions using the R package ‘ggplot2’77.
To identify genotypes characterised by high breeding potential for common bean biofortification, the three
dimensions of data were jointly visualised in a bubble chart and in a scatterplot where samples were ordered by
increasing phytate seed content. Finally, genotypes characterised by high iron and zinc (i.e. 95th percentile of iron
and zinc seed content) and low phytate content (i.e. 5th percentile of total phytate seed content) were identified.
Relative bioavailability of iron and zinc was estimated through the calculation of molar ratios of phytate:iron
and phytate:zinc, r espectively78,79. The molar ratios were calculated using BLUEs of the three traits and a value
of 660.3 g/mol as molecular weight of phytate as described by Castro-Alba and c olleagues57.
Genotyping. The genotyping was performed as described by Raggi and c olleagues41. Briefly, DNA of the
192 genotypes was extracted using the TissueLyser II (Qiagen) and the DNeasy 96 plant kit (Qiagen, Hilden,
Germany)80. Sample information is available at the National Center for Biotechnology Information. Before
library preparation, concentration and quality of DNA were estimated by means of: (i) UV–vis spectroscopy
with a Nanodrop 2000 (Thermo Scientific Waltham, Massachusetts, USA) and (ii) a fluorometric assay using a
Scientific Reports | (2020) 10:19775 | https://doi.org/10.1038/s41598-020-76417-3 9
Vol.:(0123456789)www.nature.com/scientificreports/
Qubit 2.0 (Invitrogen, Carlsbad, California, USA). A double digest Restriction-site Associated DNA sequencing
(ddRAD-seq)81 approach was used for genotyping. Digestion was carried out using SphI and MboI restriction
enzymes. The sequencing was performed on an Illumina HiSeq2500 platform (Illumina, San Diego, California,
USA). The sequenced fragments were then aligned against the reference genome v. 1.0 using BWA-MEM82 and
SNPs were called using functions implemented in Stacks 2.083. The genotyping resulted in a dataset of 106,072
polymorphic loci. A pruned-dataset of 49,518 SNPs was obtained after removing loci and genotypes character-
ised by ≥ 10% missing data and loci with a minor allele frequency ≤ 5% and heterozygosity ≥ 2% using functions
implemented in PLINK v. 1.0784 and Tassel v. 5.285 software.
Genome‑wide association analysis and candidate gene identification. The association analysis
was performed using the pruned-dataset of 49,518 SNPs trough a Mixed-Linear Model (MLM) implemented
in Tassel v. 5.285. The tested phenotypes consisted in the BLUEs dataset obtained from a single experiment car-
ried out under controlled conditions. The MLM accounted for both population structure and genotype cryptic
relatedness (kinship). In this regard, results of STRUCTURE and kinship analyses were retrieved from Raggi
and colleagues41. Briefly, STRUCTURE results indicated that the common bean panel of diversity consists of
two main clusters: 87 genotypes were attributed to K1 (Mesoamerican), 94 to K2 (Andean) while 11 resulted
admixed. The kinship analysis showed different relatedness levels among genotypes and highlighted no genetic
redundancy. Results of the association analysis were corrected for multiple testing using the Bonferroni adjust-
ment considering two alpha values (0.01 and 0.05); the correction was applied considering the number of haplo-
type blocks within the panel, as described by Gabriel and c olleagues86; number of haplotype blocks was inferred
using a function implemented in PLINK software84.
Candidate gene search was carried out based on proximity to significant SNPs by browsing the P. vulgaris
genome v. 2.1 in Phytozome 12.187 as follows: sequenced fragments containing significant SNPs identified after
GWAS analysis were aligned against the reference v. 2.1. Sequences of the putative candidate genes, translated
into the corresponding protein, were then compared against the A. thaliana protein database (Araport11 protein
sequences) using the online tool BLASTP in TAIR (https://www.arabidopsis.org/Blast/). Once the gene was
selected, it was subsequently positioned on the common bean reference genome v 1.0 as the SNP dataset used
in this study has been mapped using the same reference.
Linkage disequilibrium analysis. To ascertain whether the identified SNP markers located in non-cod-
ing regions and candidate genes are in Linkage Disequilibrium (LD)—meaning that they tend to be inherited
together—a LD analysis was carried out in HaploView 4.288. Pairwise LD between markers (r2) was calculated
within a window of ± 1.5 Mb around the most significant marker associated with the corresponding trait. To bet-
ter visualise LD patterns between a candidate gene and the associated markers, further analyses were performed
and visualised in narrower windows.
Code availability
Accession codes NCBI, from SAMN12035168 to SAMN12035359. The genotyping dataset is available at: https://
www.ebi.ac.uk/ena/data/view/PRJEB33063.
Received: 7 May 2020; Accepted: 21 October 2020
References
1. FAO, IFAD, WFP, WHO & UNICEF. The State of Food Security and Nutrition in the World 2018. (2018).
2. Bouis, H. E., Hotz, C., McClafferty, B., Meenakshi, J. V. & Pfeiffer, W. H. Biofortification: A new tool to reduce micronutrient
malnutrition. Food Nutr. Bull. 32, 31–40 (2011).
3. Muthayya, S. et al. The global hidden hunger indices and maps: An advocacy tool for action. PLoS ONE 8, e67860 (2013).
4. Beintema, J. J. S., Gallego-Castillo, S., Londoño-Hernandez, L. F., Restrepo-Manjarres, J. & Talsma, E. F. Scaling-up biofortified
beans high in iron and zinc through the school-feeding program: A sensory acceptance study with schoolchildren from two
departments in southwest Colombia. Food Sci. Nutr. 6, 1138–1145 (2018).
5. Welch, R. M. & Graham, R. D. Breeding for micronutrients in staple food crops from a human nutrition perspective. J. Exp. Bot.
55, 353–364 (2004).
6. Poletti, S., Gruissem, W. & Sautter, C. The nutritional fortification of cereals. Curr. Opin. Biotechnol. 15, 162–165 (2004).
7. White, P. J. & Broadley, M. R. Biofortification of crops with seven mineral elements often lacking in. New Phytol. 182, 49–84 (2009).
8. De Benoist, B., Egli, I. & Cogswell, M. Worldwide Prevalence of Anemia 1993–2005 (World Heal. Organ., Geneva, 2008).
9. Kassebaum, N. J. et al. A systematic analysis of global anemia burden from 1990 to 2010. Blood 123, 615–624 (2014).
10. Lopez, A., Cacoub, P., Macdougall, I. C. & Peyrin-Biroulet, L. Iron deficiency anaemia. Lancet 387, 907–916 (2016).
11. Steinbicker, A. & Muckenthaler, M. Out of balance—systemic iron homeostasis in iron-related disorders. Nutrients 5, 3034–3061
(2013).
12. Rocha, B. M. L., Cunha, G. J. L. & Menezes Falcão, L. F. The burden of iron deficiency in heart failure. J. Am. Coll. Cardiol. 71,
782–793 (2018).
13. Sankaran, V. G. & Weiss, M. J. Anemia: Progress in molecular mechanisms and therapies. Nat. Med. 21, 221–230 (2015).
14. Miller, L. V. et al. Size of the zinc pools that exchange rapidly with plasma zinc in humans: Alternative techniques for measuring
and relation to dietary zinc intake. J. Nutr. 124, 268–276 (1994).
15. Livingstone, C. Zinc: Physiology, deficiency, and parenteral nutrition. Nutr. Clin. Pract. 30, 371–382 (2015).
16. Sparvoli, F., Bollini, R. & Cominelli, E. Nutritional value. In Grain Legumes 291–326 (Springer Science & Business Media, Berlin,
2015).
17. Keen, C. L. & Gershwin, M. E. Zinc deficiency and immune function. Annu. Rev. Nutr. 10, 415–431 (1990).
18. Welch, R. M. & Graham, R. D. Breeding crops for enhanced micronutrient content. Plant Soil 245, 205–214 (2002).
19. Reddy, N. R. & Sathe, S. K. Food Phytates (CRC Press, Boca Raton, 2001). https://doi.org/10.1201/9781420014419
Scientific Reports | (2020) 10:19775 | https://doi.org/10.1038/s41598-020-76417-3 10
Vol:.(1234567890)www.nature.com/scientificreports/
20. Lott, J. N. A., Ockenden, I., Raboy, V. & Batten, G. D. Phytic acid and phosphorus in crop seeds and fruits: A global estimate. Seed
Sci. Res. 10, 11–33 (2000).
21. Sparvoli, F. & Cominelli, E. Seed biofortification and phytic acid reduction: A conflict of interest for the plant?. Plants 4, 728–755
(2015).
22. Harland, B. F. & Morris, E. R. Phytate: A good or a bad food component?. Nutr. Res. 15, 733–754 (1995).
23. Morris, E. R. & Hill, A. D. Inositol phosphate content of selected dry beans, peas, and lentils, raw and cooked. J. Food Compos.
Anal. 9, 2–12 (1996).
24. Hurrell, R. & Egli, I. Iron bioavailability and dietary reference values. Am. J. Clin. Nutr. 91, 1461S-1467S (2010).
25. Lonnerdal, B. Phytic acid-trace element (Zn, Cu, Mn) interactions. Int. J. Food Sci. Technol. 37, 749–758 (2002).
26. Blair, M. W., Izquierdo, P., Astudillo, C. & Grusak, M. A. A legume biofortification quandary: Variability and genetic control of
seed coat micronutrient accumulation in common beans. Front. Plant Sci. 4, 1–14 (2013).
27. Petry, N., Boy, E., Wirth, J. P. & Hurrell, R. F. Review: The potential of the common bean (Phaseolus vulgaris) as a vehicle for iron
biofortification. Nutrients 7, 1144–1173 (2015).
28. Beebe, S., Gonzalez, A. V. & Rengifo, J. Research on trace minerals in the common bean. Food Nutr. Bull. 21, 387–391 (2000).
29. Gregorio, G. B. Progress in breeding for trace minerals in staple crops. J. Nutr. 132, 500S–502S (2002).
30. Ortiz-Monasterio, J. I. et al. Enhancing the mineral and vitamin content of wheat and maize through plant breeding. J. Cereal Sci.
46, 293–307 (2007).
31. Bänziger, M. & Long, J. The potential for increasing the iron and zinc density of maize through plant-breeding. Food Nutr. Bull.
21, 397–400 (2000).
32. Blair, M. W., Sandoval, T. A., Caldas, G. V., Beebe, S. E. & Páez, M. I. Quantitative trait locus analysis of seed phosphorus and seed
phytate content in a recombinant inbred line population of common bean. Crop Sci. 49, 237–246 (2009).
33. Schmutz, J. et al. A reference genome for common bean and genome-wide analysis of dual domestications. Nat. Genet. 46, 707–713
(2014).
34. Blair, M. W., Astudillo, C., Rengifo, J., Beebe, S. E. & Graham, R. QTL analyses for seed iron and zinc concentrations in an intra-
genepool population of Andean common beans (Phaseolus vulgaris L). Theor. Appl. Genet. 122, 511–521 (2011).
35. Perez-Vega, E. et al. Mapping of QTLs for morpho-agronomic and seed quality traits in a RIL population of common bean (Pha-
seolus vulgaris L.). Theor. Appl. Genet. 120, 1367–1380 (2010).
36. Gelin, J. R., Forster, S., Grafton, K. F., McClean, P. E. & Rojas-Cifuentes, G. A. Analysis of seed zinc and other minerals in a recom-
binant inbred population of navy bean (Phaseolus vulgaris L.). Crop Sci. 47, 1361–1366 (2007).
37. Izquierdo, P. et al. Meta-QTL analysis of seed iron and zinc concentration in common bean (Phaseolus vulgaris L.). Theor. Appl.
Genet. 131, 1645–1658 (2017).
38. Blair, M. W. et al. Inheritance of seed phytate and phosphorus levels in common bean (Phaseolus vulgaris L.) and association with
newly-mapped candidate genes. Mol. Breed. 30, 1265–1277 (2012).
39. Visscher, P. M. et al. 10 Years of GWAS discovery: Biology, function, and translation. Am. J. Hum. Genet. 101, 5–22 (2017).
40. Wang, W. Y. S., Barratt, B. J., Clayton, D. G. & Todd, J. A. Genome-wide association studies: Theoretical and practical concerns.
Nat. Rev. Genet. 6, 109–118 (2005).
41. Raggi, L., Caproni, L., Carboni, A. & Negri, V. Genome-wide association study reveals candidate genes for flowering time variation
in common bean (Phaseolus vulgaris L.). Front. Plant Sci. 10, 962 (2019).
42. Moghaddam, S. M. et al. Genome-wide association study identifies candidate loci underlying agronomic traits in a Middle Ameri-
can diversity panel of common bean. Plant Genome 9, 0 (2016).
43. Cichy, K. A., Wiesinger, J. A. & Mendoza, F. A. Genetic diversity and genome-wide association analysis of cooking time in dry
bean (Phaseolus vulgaris L.). Theor. Appl. Genet. 128, 1555–1567 (2015).
44. Kamfwa, K., Cichy, K. A. & Kelly, J. D. Genome-wide association analysis of symbiotic nitrogen fixation in common bean. Theor.
Appl. Genet. 128, 1999–2017 (2015).
45. Katuuramu, D. N. et al. Genome-wide association analysis of nutritional composition-related traits and iron bioavailability in
cooked dry beans (Phaseolus vulgaris L.). Mol. Breed. 38, 44 (2018).
46. Bouis, H. E. & Saltzman, A. Improving nutrition through biofortification: A review of evidence from HarvestPlus, 2003 through
2016. Glob. Food Sec. 12, 49–58 (2017).
47. Paltridge, N. G., Palmer, L. J., Milham, P. J., Guild, G. E. & Stangoulis, J. C. R. Energy-dispersive X-ray fluorescence analysis of zinc
and iron concentration in rice and pearl millet grain. Plant Soil 361, 251–260 (2012).
48. Guild, G. E., Paltridge, N. G., Andersson, M. S. & Stangoulis, J. C. R. An energy-dispersive X-ray fluorescence method for analysing
Fe and Zn in common bean, maize and cowpea biofortification programs. Plant Soil 419, 457–466 (2017).
49. Latta, M. & Eskin, M. A simple and rapid colorimetric method for phytate determination. J. Agric. Food Chem. 28, 1313–1315
(1980).
50. Caproni, L., Raggi, L., Ceccarelli, S., Negri, V. & Carboni, A. In-depth characterisation of common bean diversity discloses its
breeding potential for sustainable agriculture. Sustainability 11, 5443 (2019).
51. Blair, M. W., Astudillo, C., Grusak, M. A., Graham, R. & Beebe, S. E. Inheritance of seed iron and zinc concentrations in common
bean (Phaseolus vulgaris L.). Mol. Breed. 23, 197–207 (2009).
52. Zarcinas, B. A., Cartwright, B. & Spouncer, L. R. Nitric acid digestion and multi-element analysis of plant material by inductively
coupled plasma spectrometry. Commun. Soil Sci. Plant Anal. 18, 131–146 (1987).
53. Blair, M. W., Wu, X., Bhandari, D. & Astudillo, C. Genetic dissection of ICP-detected nutrient accumulation in the whole seed of
common bean (Phaseolus vulgaris L.). Front. Plant Sci. 7, 1–9 (2016).
54. Islam, F. M. A., Basford, K. E., Jara, C., Redden, R. J. & Beebe, S. Seed compositional and disease resistance differences among gene
pools in cultivated common bean. Genet. Resour. Crop Evol. 49, 285–293 (2002).
55. Cichy, K. A. et al. A Phaseolus vulgaris diversity panel for andean bean improvement. Crop Sci. 55, 2149–2160 (2015).
56. McClean, P. E. et al. Phenotypic diversity for seed mineral concentration in North American dry bean germplasm of middle
american ancestry. Crop Sci. 57, 3129–3144 (2017).
57. Castro-Alba, V., Lazarte, C. E., Bergenståhl, B. & Granfeldt, Y. Phytate, iron, zinc, and calcium content of common Bolivian foods
and their estimated mineral bioavailability. Food Sci. Nutr. 7, 2854–2865 (2019).
58. Visioni, A. et al. Genome-wide association mapping of frost tolerance in barley (Hordeum vulgare L.). BMC Genomics 14, 424
(2013).
59. Zhang, Y. et al. SDIR1 is a RING Finger E3 ligase that positively regulates stress-responsive abscisic acid signaling in Arabidopsis.
Plant Cell 19, 1912–1929 (2007).
60. Vreugdenhil, D., Aarts, M. G. M., Koornneef, M., Nelissen, H. & Ernst, W. H. O. Natural variation and QTL analysis for cationic
mineral content in seeds of Arabidopsis thaliana. Plant. Cell Environ. 27, 828–839 (2004).
61. Taiz, L. & Zeiger, E. Plant Physiology (Sinhauser Associates, Inc., Hanover, 2010).
62. Masuda, H. et al. Iron-biofortification in rice by the introduction of three barley genes participated in mugineic acid biosynthesis
with soybean ferritin gene. Front. Plant Sci. 4, 132 (2013).
63. Narayanan, N. et al. Biofortification of field-grown cassava by engineering expression of an iron transporter and ferritin. Nat.
Biotechnol. 37, 144–151 (2019).
Scientific Reports | (2020) 10:19775 | https://doi.org/10.1038/s41598-020-76417-3 11
Vol.:(0123456789)You can also read