Evolution of the superconducting properties from binary to ternary APC- Nb3Sn wires
←
→
Page content transcription
If your browser does not render page correctly, please read the page content below
Superconductor Science and Technology

PAPER • OPEN ACCESS

Evolution of the superconducting properties from binary to ternary APC-
Nb3Sn wires
To cite this article: M Ortino et al 2021 Supercond. Sci. Technol. 34 035028

View the article online for updates and enhancements.

                               This content was downloaded from IP address 46.4.80.155 on 27/04/2021 at 06:59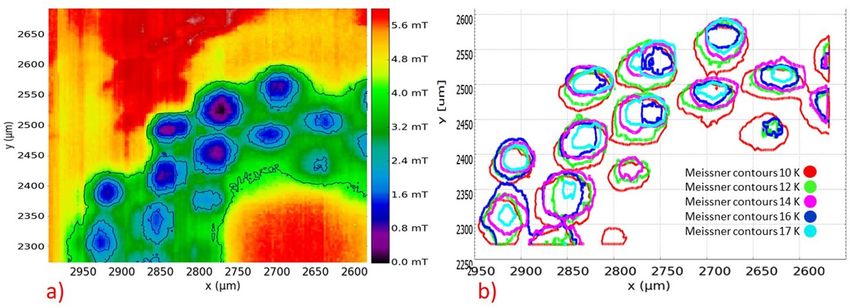
Superconductor Science and Technology
Supercond. Sci. Technol. 34 (2021) 035028 (12pp) https://doi.org/10.1088/1361-6668/abd5f4
Evolution of the superconducting
properties from binary to ternary
APC-Nb3Sn wires
M Ortino1, S Pfeiffer2, T Baumgartner1, M Sumption3, J Bernardi2, X Xu4
and M Eisterer1
1
Atominstitut (ATI), TU Wien, Stadionallee 2, 1020 Vienna, Austria
2
University Service Centre for Transmission Electron Microscopy (USTEM), TU Wien, Wiedner
Hauptstrasse 8-10, 1040 Vienna, Austria
3
Department of MSE, The Ohio State University, Columbus, OH 43210, United States of America
4
Fermi National Accelerator Laboratory, Batavia, IL 60510, United States of America
E-mail: ortino.mattia@tuwien.ac.at
Received 5 September 2020, revised 23 November 2020
Accepted for publication 22 December 2020
Published 4 February 2021
Abstract
We present a study conducted on binary Tube Type and ternary powder-in-tube Nb3 Sn wires
manufactured using the artificial pinning centres-internal oxidation method. All the specimens
are doped with Zr: oxide nano-particles of this element are responsible for the pinning
improvement, both by refining the A-15 grain-size and their own point-pinning contribution.
Low-field Jc magnetometry confirms that the hadron-hadron Future Circular Collider (FCC-hh)
specifications are met by one ternary doped-sample. The differences in microstructure were
assessed by scanning electron microscopy/transmission electron microscopy to clarify the
reasons for the pinning improvement between the two generations. The deviations from the Dew
Hughes model are also discussed, underlying some non-linear addition due to competition
between the two pinning mechanisms. Finally, we show how the introduction of Ta as a ternary
addition influences the A-15 phase by focusing on the radial inhomogeneities, evaluating the Tc
distribution and Sn composition gradients. The latter are used to model the currents, enabling us
to evaluate the individual weights of the pinning mechanisms and their absolute contributions at
the High Luminosity-Large Hadron Collider and FCC-hh dipoles operational points.
Keywords: Nb3 Sn, FCC, APC, pinning, homogeneities
(Some figures may appear in colour only in the online journal)
1. Introduction superconducting performance of technical conductors. Nb3 Sn
is still the leading material for industrially produced con-
Research on Nb3 Sn is sparking new interest in the last six ductors for magnet applications within the 10 T–20 T range
years, since latest manufacturing techniques improved the [1], while the market in this field is slowly growing. As an
example, high-energy physics projects such as the next Future
Circular Collider (FCC-hh) at CERN require new powerful
magnets for bending higher energy particles [2]. For the con-
ductor, the target non-Cu Jc —the critical current Ic divided
Original Content from this work may be used under the
terms of the Creative Commons Attribution 4.0 licence. Any
by the non-copper area of the conductor—has been fixed to
further distribution of this work must maintain attribution to the author(s) and 1.5 kA mm−2 at 4.2 K and 16 T. The best commercial Nb3 Sn
the title of the work, journal citation and DOI. restacked rod process (RRP) and powder-in-tube (PIT) strands
1361-6668/21/035028+12$33.00 1 © 2021 The Author(s). Published by IOP Publishing Ltd Printed in the UK
Supercond. Sci. Technol. 34 (2021) 035028                                                                                       M Ortino et al

do not reach yet the FCC goals, lacking at least 20 % in Jc :             2. Experimental
there is still room for bridging this gap [3] and the internal
oxidation method is a promising solution [4]. This technique              The investigated wires were provided by Hyper Tech
consists of replacing the usual central Sn supplier -powder or            Research, Inc. (HTR). All these strands have a 48/61 config-
rod- by a S + oxide powder: the latter provides oxygen, by                uration, where 48 is the number of sub-elements and 61 is the
diffusing during the heat-treatment to the surrounding Nb–Zr              stack number. Type of precursors, diameter and heat treatment
solid matrix. In this way, exploring the possibility of increas-          specifications are listed below.
ing the fine-grains population—and consequently the pinning
capacity of the A-15 layer—some promising results have been               • Binary Nb-1 at%Zr tube + Sn/Cu/SnO2 powders, 48/61
shown in the past on Nb3 Sn foils [5], demonstrating a grain-               sub-elements, HT: 650 ◦ C × 250 h, ϕ = 0.72 mm, code:
size refinement and an increasing Jc . During the 2000s this                B-650x250
method has been tried also on strands [6, 7]: through sev-                • Binary Nb-1 at%Zr tube + Sn/Cu/SnO2 powders, 48/61
eral attempts (proper oxide, alloying elements, heat-treatment              sub-elements, HT: 640 ◦ C × 300 h, ϕ = 0.52 mm, code:
procedures) the Ohio State University identified the proper                 B-640x300
wire design to be used together with SnO2 powder as the                   • Ternary Nb-4 at%Ta-1 at%Zr tube + Sn/Cu/SnO2
internal oxygen supplier, creating ZrO2 nanoparticles in the A-             powders, HT: 675 ◦ C × 317 h, ϕ = 0.71 mm, code: T-
15 lattice and successfully refining the grains down to 50 nm               675x317
[8, 9]. Still lacking a sufficiently high upper critical field H c2       • Ternary Nb-4 at%Ta-1 at%Zr tube + Sn/Cu/SnO2
(21.9 T–23.5 T at 4.2 K), those first attempts of tube type (TT)            powders, HT: 685 ◦ C × 236 h, ϕ = 0.84 mm, code: T-
and PIT manufacturing have been recently further developed                  685x236
by introducing Ta as a ternary addition, which should not
interfere with the formation of the precipitates but raises H c2          A commercial PIT (Ta-alloyed, 675 ◦ C × 110 h, 192 sub-
to values higher than in the best commercial RRP and PIT                  elements, code: T-PIT) was analysed as a reference without
wires [10]. Furthermore, also Hf has been tried in place of               APC, not intended to be considered as a ‘pristine version’ of
Zr, with similar results in terms of Jc and H c2 , inspiring              the APC samples but just for comparison with a representat-
as well other research groups worldwide trying to achieve                 ive of the best commercial wires. Further details about APC
the same performances through slightly different approaches               Nb3 Sn most recent design are available in [10].
(with and without internal oxygen source) [11]. This tech-                   The binary samples, as being the first attempts of manu-
nology still requires optimization—e.g. the effective filament            facturing a multi-filamentary APC wire, were not yet optim-
size Deff should be  150—and some questions remain open: how the grain-                  showing a uniform internal oxidation, small grain size but
size refinement affects the gain in Fp max quantitatively, or how         thin Nb3 Sn layer; other filaments had instead lower oxygen
well the state-of-the-art pinning models describe their pinning           content so there was reduced oxidation effect, resulting in a
behaviours?                                                               large grain size. Moreover, longitudinal inhomogeneities were
    In this article, we show by means of SQUID (superconduct-             observed in these binary samples: a non-uniform A-15 thick-
ing quantum interference device) magnetometry how the low                 ness through the wire length can produce misleading calcula-
field Jc changes from the binary to the ternary artificial pin-           tions of magnetometry-J c , since its analysis relies on the eval-
ning centers (APC) generation, demonstrating that Jc obtained             uation of the A-15 cross-section.
by extrapolation of the volume pinning force, F p , to high fields           We prepared our samples for both local-magnetic and
meets the FCC-specifications at 16 T. The precipitate size                microstructural investigations. In particular, each specimen
and density of both APC-wire generations are measured and                 has been prepared to first perform Hall-probe scans and then
related to the pinning force, the maximum of which is always              scanning electron microscopy (SEM) and transmission elec-
measured within the magnetometry field range at 4.2 K–15 K.               tron microscopy (TEM) on the same cross-section: this exper-
An increase of the point-pinning (PP) contribution in the tern-           imental sequence allows us to remove lamellae from the sur-
ary generation is visible, even though the overall pinning beha-          faces after scanning Hall probe microscopy (SHPM), grant-
viour show non-negligible deviations from the Dew Hughes                  ing consistency for correlating superconducting and micro-
pinning models.                                                           structural properties. For that purpose, the wires were first
    The evaluation of the inhomogeneities in the A-15 phase               cut with a diamond saw, embedded in epoxy resin and then
was carried out via magnetic methods and energy dispers-                  gradually polished with SiC followed by Al2 O3 abrasive
ive x-rays (EDX) spectroscopy, so addressing the differences              paper.
between the two generations and the commercial state-                        In addition, we focused on polishing the samples aiming at
of-the-art. Finally, the effects of the radial Sn concentra-              the thinnest achievable thickness, trying to avoid crack form-
tion gradients on the pinning scaling behaviour is modelled               ation and/or surface damages to the samples. In fact, as poin-
to derive the individual contributions of the two pinning                 ted out by Eisterer in [12], low thickness is fundamental in
mechanisms.                                                               order to extract valuable Jc information from the remanent

                                                                      2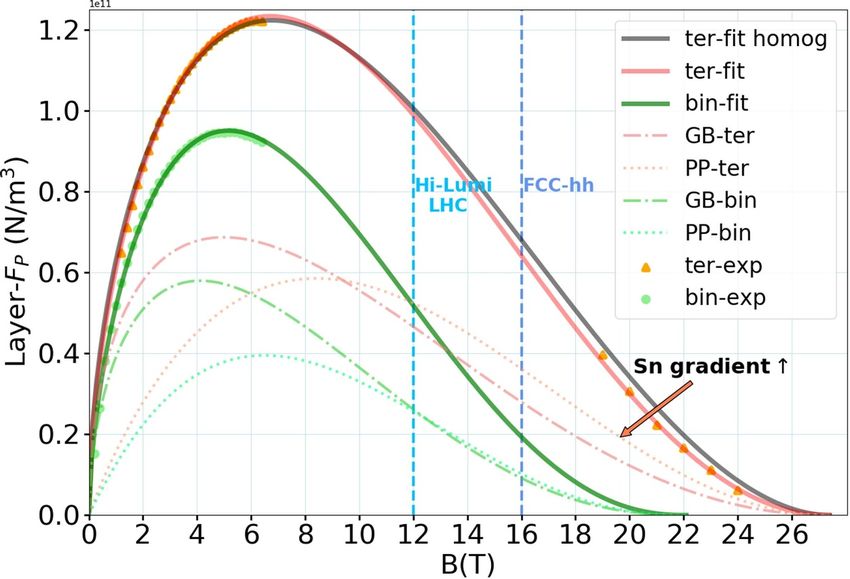
Supercond. Sci. Technol. 34 (2021) 035028                                                                                            M Ortino et al

                                                                                                        1
                                                                                           mirr (B) =     · (mdec (B) − minc (B)),             (1)
                                                                                                        2
                                                                            using the relation

                                                                                                         3    mirr
                                                                                                  Jc =     ·                                   (2)
                                                                                                         4 NL(ρ3o − ρ3i )

                                                                            introduced by Baumgartner et al [15], where ρo and ρi are
                                                                            the outer and inner radii of the single A-15 hollow cylin-
                                                                            der respectively, N is the number of filaments and L their
                                                                            length. The measurements were repeated with three contigu-
                                                                            ous (4 mm) pieces of each wire in order to unmask any pos-
                                                                            sible longitudinal inhomogeneities throughout the wire itself
                                                                            (e.g. A-15 sausaging), which could lead to different Jc values
                                                                            depending on which part of the sample is under investigation.
                                                                            Moreover, self-field effects have been neglected for a simple
                                                                            Jc calculation [16].
Figure 1. Embedded sample under optical microscope before
SHPM: the darker areas refer to the deepest points (base plane), the            Finally, also Bc2 is necessary for the analysis of the pinning
lighter ones to the thickest. After polishing, the specimen is only         forces. In fact, Bc2 values were not left as free parameters in the
16 µm thick with a flatness of 7 % throughout the whole cross               F p (B) fitting function: Bc2 of the ternary samples was determ-
section.                                                                    ined by the resistivity method, identified at ρ = 0.9ρnormal state at
                                                                            4.2 K in a 31 T cryostat whereas a 17 T system was used for the
                                                                            binaries. In the latter case, the strands were tested by applying
field profiles of SHPM scans. The flatness levels of the samples            a fixed field while reducing the temperature. Bc2 (t) is extra-
were assessed with a KEYENCE VHX-7000 digital micro-                        polated to 4.2 K by using the following fit to the Werthamer–
scope by measuring 9 points/sample over a defined base plane                Helfand–Hohenberg (WHH) temperature dependence [17–19]
as it is shown in figure 1: all the surfaces showed a maximum
deviation of 7 % from the measured mean value of the thick-                           WHH(t) =1 − t − C1 (1 − t)2 − C2 (1 − t)4 ,
ness, which ensured that differences in the magnetic signal                                               (        )
                                                                                                            WHH(t)
arise from variations in the sub-elements geometry or com-                             Bc2 (t) =Bc2 (0) ·                                      (3)
                                                                                                            WHH(0)
position rather than inhomogeneous sample preparation.
                                                                            where C1 and C2 were set to 0.153 and 0.152 respectively, as
                                                                            these values were found to be a good approximation of the
2.1. Jc and Bc2                                                             WHH dirty limit temperature dependence [20].
We decided to obtain our Jc (T,B) data from magnetometry
essentially for three reasons: first, it is difficult to measure such       2.2. Local properties and microstructure
high critical currents at low temperatures with the available
                                                                            We used AC magnetometry for the evaluation of the crit-
transport set-up; second, it is interesting to look at the evol-
                                                                            ical temperature distribution within the A-15 phase, to be
ution of the low-field Jc since the maximum pinning forces
                                                                            eventually related with the Sn-concentration gradient data
FP−max is reached below 7 T; finally, transport-measurements
                                                                            from SEM-EDX measurements. Furthermore, we assessed the
above 19 T are already available [10], so a benchmark at low
                                                                            Nb3 Sn grain and nano-particle size via TEM together with
fields is required in order to understand the Jc potential at
                                                                            their density within the A-15 region. In particular, the latter
16 T (4.2 K) before addressing the wire-stability in the low-
                                                                            information is essential for addressing the role of the inclu-
field range. Moreover, it is particularly interesting to cross-
                                                                            sions in the overall pinning scenario.
check the validity of the Jc fitting procedure [1, 13, 14] if per-
formed on experimental data obtained by different measuring
techniques (magnetometry and transport current).                            2.2.1. Radial Inhomogeneities.        As recently demonstrated by
    Our magnetization measurements were performed using a                   Tarantini et al [21], Ta can substitute both the Nb and Sn sites.
Quantum Design MPMS XL SQUID magnetometer equipped                          For this reason, we analysed the differences between the APC
with a reciprocating sample option. The samples were cut into               generation, without and with Ta in the A-15, comparing them
4 mm-long straight pieces with a low speed diamond saw and                  also to a commercial Ta-alloyed PIT wire. We focused on the
mounted perpendicular to the applied magnetic field. The mag-               radial distribution of the critical temperature as one of the most
netization loops were recorded at 12 different temperatures                 indicative parameters of an inhomogeneous A-15 phase. We
(4.2 K, 5 K, 6 K, ..., 15 K) using field steps of 0.2 T up to 7 T.          used magnetometry since, for PIT and TT wires, a magnetic
The critical current density, Jc was calculated from the irre-              field applied parallel to the wire can penetrate a sub-element
versible magnetic moment mirr , by subtracting the moments                  from the barrier towards the core, thus allowing to probe the
measured in increasing and in decreasing field:                             radial Tc distribution [22]. We used both bulk (SQUID) and

                                                                        3
Supercond. Sci. Technol. 34 (2021) 035028 M Ortino et al
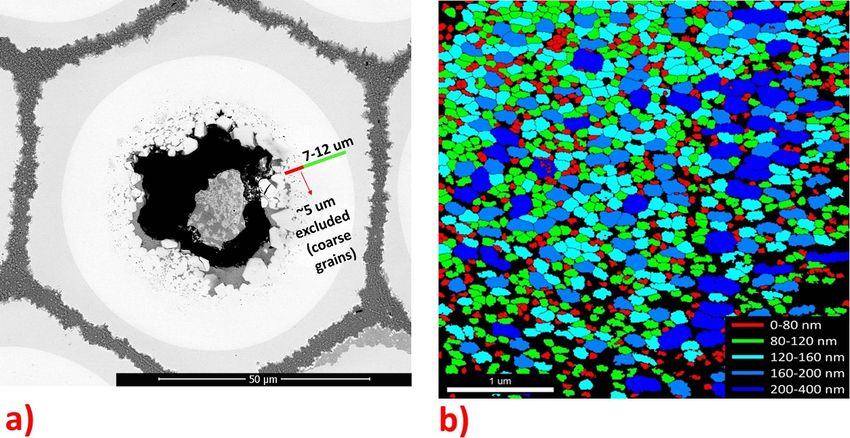
Figure 2. (a) SHPM Meissner-scan of a cross-section quadrant at 12 K and 5 mT; (b) shielding contours evaluation for B = 50 %Bapp : the
A-15 Meissner-shielding radii shrink with increasing temperature.
Figure 3. (a) Area-selection criterion adopted for SEM/TEM investigation. Coarse-grains region is excluded from grain/precipitate-size
determination. (b) 3 × 3 µm2 area of the B-640x300 wire magnified by TKD: five colours represent the five different size ranges.
local (SHPM) magnetometry in order to cross-check our res- and radial Sn gradient (with the highest value on the
ults. The latter is a self-built device based on piezo-positioners inside).
operating in a helium flow cryostat, offering a scan range of Scans of the magnetic field in the Meissner state recorded
3 × 3 mm2 with a spatial resolution of 1 × 1 µm2 . The magnet at increasing temperature via SHPM rely on less assumptions:
has a maximum magnetic field of 8 T, allowing for a full mag- the information is local (subelement-per-subelement) and the
netization of the samples in a wide temperature range (stable evaluation of the shielding radii(T) does not need an iterat-
between 2.5 K and 150 K). A description of the set-up can ive simulation as for the AC-susceptibility. On the other hand,
be found in [23]. First, we performed AC-magnetometry in a performing such an experiment is much more difficult and
Quantum Design MPMS XL SQUID: a 4 mm long piece of one can safely evaluate its output only thanks to an optimal
the wire was placed in an alternating magnetic field with an sample preparation: this is the only way to resolve meaning-
amplitude of 30 µT and a frequency of 33 Hz applied paral- ful differences in the recorded field profile, excluding experi-
lel to the wire using the AC option of the system. The critical mental artefacts coming from tilts of the specimen. Figure 2(a)
temperature Tc of each sample was assessed as being the mid- presents such a scan at 12 K, where a field of 5 mT was
point value of the superconducting to normal transition in the applied in order to safely measure below Hc1 : the shielding
susceptibility curves (table 1). From these data and numerical contours of the sub-elements are then evaluated where the
simulations the volume Meissner shielding fraction was eval- measured field equals 50 % of the applied field (in figure 2(b)),
uated as described in [15]: all sub-elements were assumed to demonstrating how the effective shielding changes with
be identical parallel tubes with same geometry, composition temperature.
4
Supercond. Sci. Technol. 34 (2021) 035028                                                                                        M Ortino et al

Figure 4. Low-field Jc (4.2 (K) data are fitted through the pinning force law. For the samples T-685x236 and T-PIT also experimental
high-field values are plotted. The FCC target is approached by the T-685x236 sample.

2.2.2. Microstructure.     Scanning and transmission electron                        Table 1. Bc2 , Tc and Jc —fit parameters.
microscopy were used in order to determine the grain and                 Type          Bc2 (4.2 K) (T)   Tc (K)   C (GN m−3 )     p        q
precipitate size together with the precipitates density. For the
grain/precipitate size determination we used the transmission            B-650x250          22.1         17.31        95         0.71    2.19
Kikuchi diffraction (TKD) method rather than the classical               B-640x300          22.3         17.28       108         0.67    1.78
electron backscatter diffraction because of the higher spatial           T-675x317          27.0         17.46        72         0.68    2.28
resolution. For that purpose, the already polished samples               T-685x236          27.1         17.63        88         0.68    2.34
                                                                         T-PIT              26.5         17.66        58         0.49    2.31
used for SHPM measurements were further prepared—on the
same cross-section—by removing lamellas of approximately
100 nm in thickness cut with Focus Ion Beam.
   Two lamellae were prepared per each sample (figure 3(b)),             where the parameters C, p and q were left as free paramet-
referring always to two different subelements. Elemental maps            ers. These values, together with the experimental Bc2 and Tc
were also recorded by means of EDX. This allowed us to eval-             are summarized in table 1. Figure 4 shows both low and high-
uate the compositional gradients within and between the grains           field Jc being fit by equation (4). Both datasets (from mag-
along the A-15 radial direction (figure 3(a)) and providing an           netometry and transport current, respectively) fit with good
additional cross-check on the suppression of the superconduct-           agreement (R2 = 0.98). It is clearly visible that the FCC tar-
ing properties by the changing Sn content in the superconduct-           get is approached by the T-685x236 sample (1457 A mm−2 ),
ing phase.                                                               mainly enabled by the improved behaviour at high fields
                                                                         caused by the change in Bc2 due to the Ta additions. On the
3. Results and discussion                                                other hand, a lowering of the low field (1 T–7 T) Jc com-
                                                                         pared to the binary generation is evident in the T-675x317
3.1. Jc and pinning
                                                                         sample. This should be beneficial for the wire development,
The critical currents of all samples are shown in figure 4.              since magnetization is the driving force for low-field flux
The Jc fitting curves shown in figure 4 were obtained from               jumps and field errors in magnets [24, 25]. These field errors
Fp = Jc B (the cross product Fp = |J⃗c × ⃗B| simplifies because          in the magnet aperture are in fact caused by shielding currents
applied field and irreversible currents are approximately per-           induced in the superconducting filaments during the accel-
pendicular) via the following equation                                   erator field-ramps, eventually degrading the accelerator per-
                                                                         formance in particular at low fields. This is usually the case
                               (         )p (       )q                   at the injection level [26]: decreasing the low field Jc should
                                    B            B
                 p (B) = C ·               · 1−
               F fit                                           (4)       improve low-field stability and help in suppressing these field
                                   Bc2          Bc2                      errors.

                                                                     5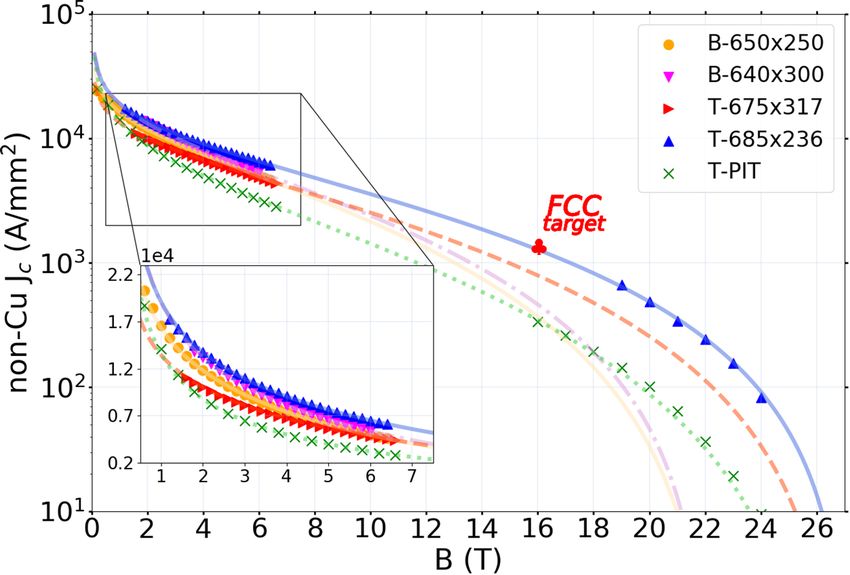
Supercond. Sci. Technol. 34 (2021) 035028 M Ortino et al
as defined in [31], the most appropriate equations to deploy in
30
B-640x300 our case are:
T-685x236
25 T-PIT
( )0.5 ( )2
µ0 Sv H2c2 B B
Number fraction [%]
F GB
p (B) = · · 1− (5)
20 4κ2 Bc2 Bc2
15
( ) ( )2
µ0 Vf H2c2 B B
10 F PP
p (B) = · · 1− . (6)
4.64sp κ2 Bc2 Bc2
5
Equation (5) refers to the ‘surface-core’ pinning (bpeak = 0.2),
0 widely accepted to be representative of the GB pinning mech-
0 50 100 150 200 250 300
Grain diameter [nm] anism in Nb3 Sn conductors. Since this pinning interaction
occurs when the grain-size is bigger than the inter-flux line
Figure 5. Distribution of grain sizes as the fraction of the measured spacing (about 20 nm at 6 T), this means that all the grains
area in both generations of APC-wires together with a reference could potentially be involved in pinning flux lines, making
Ta-alloyed PIT wire. The representative grain size is chosen as the it usually the dominant mechanism (a grain size ⩽ 20 nm
mean value of the fitted log-normal distribution.
has never been achieved so far in Nb3 Sn wires). Sv = 1/sg —
where ‘sg ’ is the grain-size–is the total grain boundary area per
The behaviour at high fields can be explained by consid- unit volume involved into the pinning process, while κ is the
ering the microstructural differences between the two gener- Ginzburg–Landau parameter.
ations: both grain and precipitate-refinements are observable Equation (6) refers to the ‘core-point pinning’ mechan-
in figures 5 and 6, likely due to the optimization of the recipe ism, occurring when the defect or precipitate dimensions are
and of the HT rather than the addition of Ta itself. Moreover, in all directions less than the inter flux line spacing, show-
an increase in density of nanoparticles from ca. 2500 µm−3 to ing bpeak = 0.33. Vf = (sp /l)3 is the fraction of the precipit-
ca. 25.000 µm−3 was measured via TEM, leading to similar ates which are actively pinning in a rigid lattice, where sp is
results also for both the measured ternary samples. The con- the precipitate size and l is the average distance between the
sequence of that is a further shift of the FP-max towards a more precipitates. The other possible pinning mechanisms are not
mixed-pinning character (figures 7 and 8), causing peak-shifts considered, since we do not observe any evidence of ‘∆κ’
towards a maximum of bpeak = BFp-max /Bc2 = 0.24—despite mechanism, which would exhibit as a second local maximum
the ≃ 20 % higher H c2 —registered in the T-685x236 wire. in F p (B), peaking at bpeak = 0.67 [32]. Likewise, a ‘magnetic’
This appears in agreement with the pinning theory of Kramer interaction is not possible because the ‘wavelength’ of the
[14], according to which the deployment of a wider and denser microstructure—represented by sp and l—is too small com-
population of point-pinners should lead to a shift of FP-max pared to the magnetic penetration depth λ. In fact, this does
towards the value of 0.33 [14]. not allow the induction B to adjust everywhere to its equi-
At the same time, we observe also a gain in FP-max . This librium value, thus creating a Bean–Livingston barrier to flux
appears to result as well from the higher PP contribution, motion at the interface between pin and matrix which would
but it is also caused by the simultaneous refinement of the be the cause of pinning [33]. Considering l to be ≃ (dp )−√ 1/3
—
grains. The smallest grain size is achieved in T-685x236 with where dp is the precipitates density—and κ = Hc2 / 2Hc
63 nm and the T-675x317 wire shows similar results. The as proposed in [34], the following ratios can be obtained
layer-F p (B) was calculated as explained in section 2.1, valid- from (5) and (6):
ating the effective current-carrying A-15 layer thickness from
SEM as well by means of local Hall-probe and trapped-field
−TER −TER
SQUID measurements [28]. As the collection of data for tern- F pGB
-max sBIN
g f GB
p (bpeak )
−BIN
≃ · −
(7)
ary Nb3 Sn in literature suggests [29], these refinements should F pGB
-max
TER
sg fpGB BIN
(bpeak )
lead to a Fp-max ≃ 11 × 1010 (N m−3 ) in the T-685x236 and
≃ 9.5 × 10¹⁰ (N m−3 ) in the T-675x317 samples, which are
consistent with the experimentally measured values listed in ( )2
−TER −TER
table 2. The ideal behaviour, free of inhomogeneities affect- F PP
p-max sTER
p dTER
p f PP
p (bpeak )
−BIN ≃ · · − (8)
ing the F p (B) trends [30], should be better addressed by a more F PP
p-max sBIN
p
BIN
dp fpPP BIN
(bpeak )
complete pinning model, where both grain-boundary (GB) and
point-particle (PP) pinning are considered. The summation of
the two contributions is in fact difficult to assess, since both where FP-max refers to the maximum value of F p (B), ‘TER’
grain and precipitate size refinements occur together. Look- to the ternary T-685x236 and ‘BIN’ to the binary B-640x300
ing at the formulation of the pinning forces per unit volume sample. From equations (7) and (8) we can see that sg and dp
6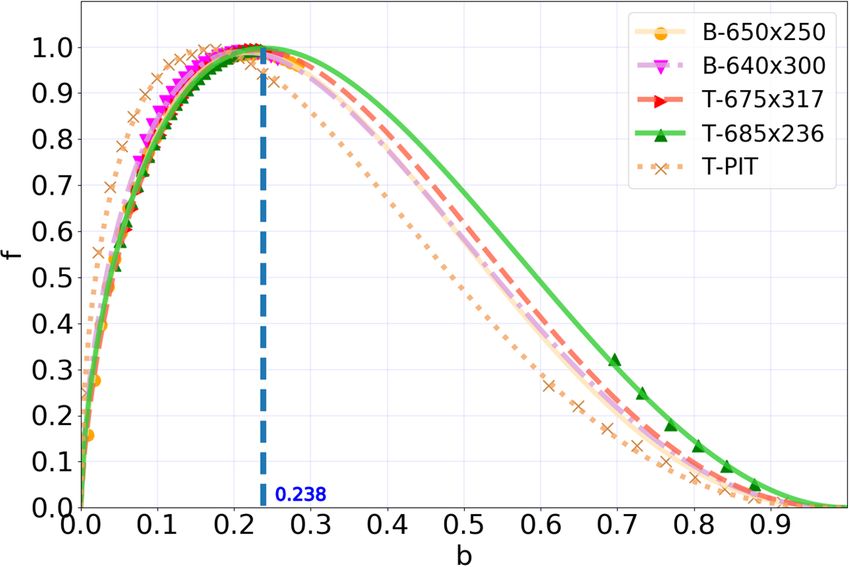
Supercond. Sci. Technol. 34 (2021) 035028                                                                                                                   M Ortino et al

                                                20

                                                18                                                                  B-640x300
                                                                                                                    T-685x236
                                                16
                           Rel. abundance [%]
                                                14

                                                12

                                                10

                                                 8

                                                 6

                                                 4

                                                 2

                                                 0
                                                     0   5    10      15     20     25       30     35        40            45   50
                                                                          Precipitate diameter [nm]
Figure 6. Distribution of binary (B-640x300) and ternary (T-685x236) nano-inclusion sizes as the fraction of the occupied area. The
representative size is defined as the mean value of the fitted log-normal distribution.

                                                             Table 2. Microstructural and pinning parameters.
                                                                                                              (         )                      (        )
                                                                                                                   1                               N
Sample                Grain size (nm)                        Inclusion size (nm)          Inclusion density       µm3
                                                                                                                                 Layer-FpMAX       m3              bpeak

B-650x250                115 ± 36a                           7 (±3.7)                     5650 (±500)                                 9.55 × 10¹⁰                  0.221
B-640x300                104 ± 44a                           8 (±3.9)                     2500 (±300)                                 1.03 × 10¹¹                  0.215
T-675x317                 70 ± 31                            4.6 (±2.6)                   25 500 (±2000)                              9.13 × 10¹⁰                  0.237
T-685x236                 63 ± 35                            4.5 (±2.7)                   25 000 (±2000)                              1.23 × 10¹¹                  0.233
T-PIT                    121 ± 41                            /                            /                                           6.35 × 10¹⁰                  0.195
a
  The binary samples show inhomogeneous A-15 structures through the wire cross-section. Independent studies on the same samples [27] show indeed
different grain sizes, varying from 50 to 80 nm.

have a linear impact on how F p (B) scales between the two gen-                         3.2. Radial inhomogeneities
erations, while it is quadratic for sp . If a direct summation of
GB and PP mechanisms was valid, the change in these prop-                               Ta additions have always been considered as problematic for
erties from the binary to the ternary generation should lead to                         APC-wires because of the sensitive thermodynamics involved
what is depicted in figure 9. In fact, by varying H c2 , Sv and V f                     in the formation of the nano-particles. This may lead to
as experimentally reported, the model foresees a twofold rel-                           a more heterogeneous phase, where Ta strongly affects the
evant increase, with a F GBp-max ≃ 60 % higher and a F p-max ≃
                                                           PP
                                                                                        superconducting properties as mentioned in section 2.2. For
300 % higher in the ternary than in the binary case.                                    this purpose, we focused on the radial evolution of the
    This result is in contrast with the experimental evidence as                        critical temperature by investigations with AC-susceptibility
it is clear from figure 7, where this two-fold increase in Fp-max                       and Scanning Hall Probe methods following the procedure
is not visible (F−  TER                               −BIN
                 p-max = is only 20 % higher than F p-max ). How-                       explained in section 2.2.1. Such an analysis can be seen in
ever, a pronounced shift of bpeak towards the predicted 0.265                           figure 10, where the critical temperature distributions T c (r)
is observed in the T-685x236 wire (figure 8): the experiment-                           are shown as a function of the relative position between the
ally measured 0.238 could be reduced by the A-15 inhomo-                                coarse grain region (close to the Sn-core) and the external
geneities which cause bpeak to be shifted to lower values [30].                         Nb-barrier. The shown data are the average of the results
This last evidence strongly indicates that the precipitates act as                      from AC-susceptibility and the SHPM measurements (the lat-
point-pinners according to the Dew Hughes theory, but leav-                             ter provides less data point than the former), between which
ing the suspicion of some sacrifice of a pinning mechanism in                           the relative difference was always less than 4%. All speci-
favour of the other one. The proper summation and possible                              mens show an approximately linear decrease in Tc for 0.2
deviations from the models deserve additional attention, mak-                           ⩽ r ⩽ 0.75—where a linear fit is applied—before reaching
ing this point a future outlook for the study.                                          a fall-off close to the barrier. The gradients stay in the range
                                                                                    7
Supercond. Sci. Technol. 34 (2021) 035028                                                                                    M Ortino et al

              Figure 7. Layer pinning force of two binary APC, two ternary APC and a commercial ternary PIT wire at 4.2 K.

Figure 8. Reduced pinning force of two binary APC, two ternary APC and a commercial ternary PIT wire at 4.2 K; the dashed blue line
shows bpeak = 0.24 in the T-675x380 wire.

of usual PIT strands (around 0.1 K µm−1 ), with the best res-          comparing to results from SEM EDX. We converted the Tc (r)
ult achieved with the B-650x250 wire. This is an indication            into the Sn content β [35–37] by using the model proposed by
that the oxygen diffusion (therefore the precipitates formation)       Godeke [1]:
does not interfere with the standard sequence of the phases
                                                                                                  c − Tc
                                                                                                T min     MAX
formation, during the heat treatment, in the PIT-APC techno-
                                                                                   Tc (β) =                       + Tc MAX             (9)
logy. These results from magnetometry were cross-checked by                                   1 + e(β−0.22)/0.009

                                                                   8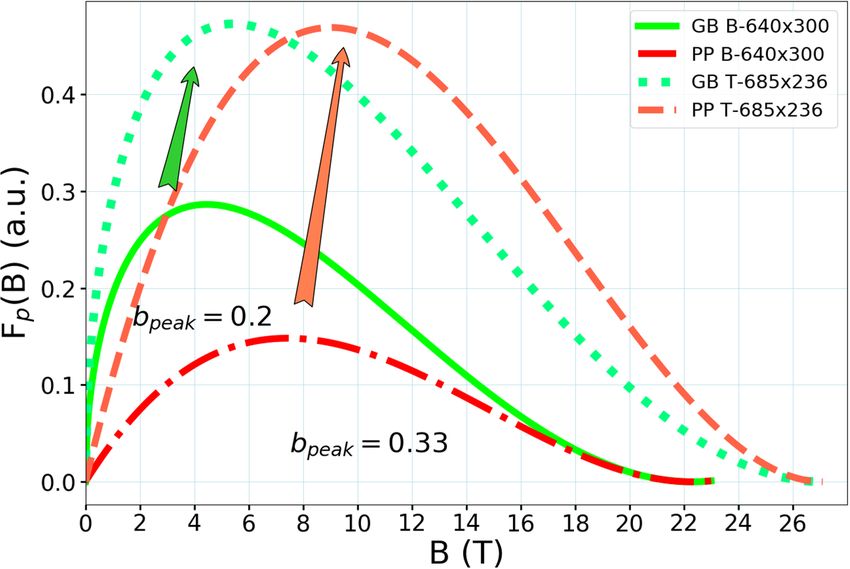
Supercond. Sci. Technol. 34 (2021) 035028                                                                                      M Ortino et al

Figure 9. F p (B) increase according to Dew Hughes theory from binary to ternary generation, where F GB
                                                                                                     p (B) is in green (GB = grain
boundary pinning) and F PP
                        p (B) (PP = point-particle pinning) in red. H c2 , Sv and V f are the experimental values.

Figure 10. Tc (r) distributions as the average of AC-susceptibility and SHPM results for two binary APC, one ternary APC and one
commercial ternary-PIT wire. Data are shown as a function of the relative position between the Sn-core and external Nb-barrier (this width
varied on average between 10 µm and 12 µm between the samples).

where T MAX
          c    = 18.3 K, the highest recorded value for Nb3 Sn            for binary samples, we modified the parameters by taking
[38]. Equation (9) represents a Boltzmann sigmoidal function              into account how Ta modifies Tc in the ternaries: at 4 at%,
fitting the datasets of Devantay et al [35], where the minimum            Ta is expected to decrease Tc by 0.45 K [39], which is
atomic Sn content for a stable A15 phase is 17 %, corres-                 in good agreement with the maximum values between 17.46
ponding to T min
               c   = 6.09 K. Since this model was proposed                and 17.63 K observed in our measurements on the ternary

                                                                      9
Supercond. Sci. Technol. 34 (2021) 035028 M Ortino et al
Table 3. Maximum Sn content and concentration gradients of three Table 4. Parameters of the fitting procedure.
selected samples.
Sample B-650x250 T-685x236
Sn gradient-MAG Sn gradient-EDS
Sample βmax (at%) (at% µm−1 ) (at% µm−1 ) p1 ∗ , q1 ∗ (GB) 0.49; 2.07 0.48; 2.16
p2 ∗ , q2 ∗ (GB) 0.95; 2.13 0.98; 2.06
−3
B-650x250 24.4 0.075 0.07 Ffit
p-max (N m ) 5.49 × 10¹¹ 6.55 × 10¹¹
T-685x236 25.1 0.105 0.11 GB-factor (C1 ) (%) 54.1 43.6
T-PIT 24.5 0.095 0.10 PP-factor (1-C1 ) (%) 45.9 56.4
The codes MAG and EDS stay for ‘magnetometry’ and ‘Energy dispersive b (HiLumi-LHC) 0.543 0.44
spectroscopy’ respectively. b (FCC-hh) 0.724 0.588
−3
F GB
p (HiLumi-LHC) (N m ) 2.64 × 10¹⁰ 4.73 × 10¹⁰
−3
PP
F p (HiLumi-LHC) (N m ) 2.64 × 10¹⁰ 5.36 × 10¹⁰
samples. Therefore, we obtained more appropriate parameters −3
F GB
p (FCC-hh) (N m ) 9.62 × 10⁹ 2.85 × 10¹⁰
−3
after subtracting 0.45 K from each calculated Tc (β) value, so PP
F p (FCC-hh) (N m ) 1.11 × 10¹⁰ 3.66 × 10¹⁰
fixing T MAX
c = 17.8 K to ensure a reasonable value at the phase
boundary (T c (β = 25.5) = 17.55 K) and obtaining by substi-
tution T min
c = 5.83 K. Table 3 demonstrates that the results where b = B/Bc2 (β), p1 = 0.5, p2 = 1 and q1 = q2 = 2.
from EDX are in a general agreement with the magnetometry Once obtained the critical current of each shell, the final Jc
data, confirming that Ta additions in APCs do not worsen the values are computed (‘JGB PP
c ’ for GB and ‘Jc ’ for PP mech-
phase homogeneity more than what we observe in commer- anisms, independently), as they would be measured in the
cial Ta-doped PIT wires. Moreover, recent works based on respective experiment: for simulations of transport measure-
EDS measurements [40] show that internally-oxidized Nb3 Sn ments by summing the currents in all elements and dividing
has indeed higher Sn at.% than standard non-oxidized Nb3 Sn, by the subelement cross section; for magnetometry, the mag-
which is consistent with our findings in this paper. netic moment generated by shells currents in increasing and
We included the effects of the composition gradients in the in decreasing applied field is computed, then Jc is obtained
calculation of the weights of the pinning mechanisms involved from the resulting irreversible moment. The two simulations
at 4.2 K. To do so, we first used the algorithm proposed by give similar results, so only magnetometry-based simulations
Baumgartner in [30], focusing on the samples B-650x250 and are used for the following. The simulated JGB PP
c and Jc profiles
T-685x236. In these simulations—which assumptions are the are then multiplied with B and fitted with (4) to extract the
same as explained in 2.2.1—the subelements are divided into proper pinning exponents (p1 ∗ , q1 ∗ , p2 ∗ , q2 ∗ ). The results of
concentric shells, assigning values for the Sn content to each this fitting procedure are summarized in table 4. Finally, the
of them. These profiles were taken from the experimental β as experimental pinning forces are fitted as follows:
outputs of the magnetometry measurements, represented by
βmax —the maximum Sn content in the subelement—and the ( ( )p1 ∗ ( )q1 ∗
B B
concentration gradient ∆β of the linear-fit region. The bin- F exp
p (B) =F fit · C1 NGB
p-max 1−
Bc2 Bc2
ary B-640x300 has βmax = 24.45 and ∆β = 0.6 at%, corres-
( )p2 ∗ ( )q2 ∗ )
ponding to a gradient of 0.075 at% µm−1 in the linear region B B
(3); The ternary has instead βmax = 25.1 at% and ∆β = 0.8 +(1 − C1 ) NPP 1−
Bc2 Bc2
at%, corresponding to a gradient of 0.11 at%/µm in the lin-
(12)
ear region. T c (β) and Bc2 (β) of each shell are then calcu-
lated based on their Sn content β as described in equations
(9) and (3). In this way, a ‘map’ of local Bc2 and Tc val- where Ffit p-max and C1 are left as free parameters. The exponents
ues is ascribed to each shell. Jc (T, B) of each current carry- p1 ∗ , q1 ∗ , p2 ∗ , q2 ∗ reflect the values predicted by Dew–Hughes
ing element is then computed based on its T c (β) and Bc2 (β) corrected for the influence of the observed Sn gradients. In the
using the Unified Scaling Law [41–43], where the strain and main brackets, the left term refers to the GB pinning contribu-
temperature dependences were omitted since their influence tion, and the right one to the PP mechanism. The pre-factors
on the pinning scaling behaviour are beyond the scope of NGB and NPP are used for normalizing the peak in the field
this work: dependencies to one. The output of such a fitting procedure is
shown in figure 11:
Fp (b) = Fp max f(b) (10) where ‘bin’ refers to the binary B-650x250, ‘ter’ to the T-
685x236 wire, ‘exp’ to the experimental points, ‘fit’ to the
where Fp max is the maximum volume pinning force (peak of applied fit and ‘homog’ to the simulated ternary wire neglect-
F p (B,T)). Equation (10) is used for simulating the pinning ing radial inhomogeneities. Moreover, the GB and PP curves
forces in pure GB and PP scenarios, separately. For this pur- (as components of the total F p (B)) are shown individually for
pose, the field dependence f (b) was modelled as follows: both wires.
The input and output parameters used in this fitting proced-
ure are listed in table 4. The GB and PP ‘factors’ are refer-
f(b) = 3.49 b p1 (1 − b)q1 (GB)
ring to C1 and (1-C1 ) in equation (12), representing how much
f(b) = 6.75 b p2 (1 − b)q2 (PP) (11) the respective pinning character is contributing to the fitted
10Supercond. Sci. Technol. 34 (2021) 035028 M Ortino et al
Figure 11. Layer-F p (B) at 4.2 K as an output of the simulated Jc accounting for the experimental Sn gradient in both generations of APC
wires (‘ter’ stays for ternary T-685x236 and ‘bin’ for binary B-650x250). The weights of the two pinning contributions were obtained by
fitting the experimental data (dots).
F p (B). In particular, we focused on the evaluation of the abso- 4. Conclusions
lute F p at specific fields, 12 T and 16 T, namely the opera-
tional points of the HiLuminosity-LHC and FCC-hh dipole We presented a comparative characterization following the
magnets (vertical lines in figure 11). Here, the dashed and development of the APC Nb3 Sn wire. The study has high-
dotted lines represent the single F p (B) of GB and PP pin- lighted how the still not optimized ternary wires already
ning mechanisms in both samples. At 12 T, the binary wire approached the high J c FCC-hh requirements at 16 T and
has a F p (B) of 5.28 × 10¹⁰ (N m3 ), split in a 50 %–50 % con- 4.2 K, eventually reaching them with the T-685x236 wire.
tribution of GB- and PP-pinning. These numbers change in The principal responsible for these achievements is not sur-
T-685x236, showing a lower participation of the precipitates prisingly the Ta-driven new behaviour at high fields, together
below ≃ 10 T, after which the PP contribution takes over. The with the clear role played by the nano-inclusions and the
weight of the PP mechanism increases indeed more at 16 T: B- grain refinement. Both effects are more evident than in the
650x250 shows 46.4 % of GB and 53.6 % of PP-pinning, and binary generation, since both inclusion-size and density were
T-685x236 exceeds as well the 50-50 scenario (43.7 % GB and improved, being clear from SEM-TKD/TEM measurements
56.3 % PP-pinning). and from more pronounced right-shifts of bpeak . On the other
As a further conclusion, a reliable allocation of these per- side, the combination of the different pinning mechanisms
centages requires the specific (experimental) Sn concentra- (GB and PP) is less clear, since the Dew–Hughes model would
tion gradient and cannot be univocally determined otherwise. foresee a higher increase of FP-max in the ternaries considering
In fact, by looking at the black solid line ‘ter-fit homog’ in the finer microstructure.
figure 11, it seems clear that it is impossible to get a perfect Finally, we showed how Ta additions are affecting the
fit if one neglects inhomogeneities. This curve represents the superconducting properties of the samples by analysing their
fit to the experimental data of the T-685x236 wire without radial homogeneity and comparing these results to the bin-
including Sn composition gradients: experimental F p (B) are ary generation and the commercial ternary reference wire. It
simply fitted via equation (11). In this case, the currents in is evident from the critical temperature distributions that, in
the high-field region (from 10 T on) are clearly overestimated, the best ternary, Ta worsen the phase homogeneity even less
most probably due to a decrease of the exponent q from the than what we observe in no-APC PIT samples. However, this
real case as already shown in [30]. The weights (so the abso- Sn concentration gradient appears hard to improve since part
lute values) of the single pinning mechanisms involved change of the unavoidable Sn diffusion process. The effects of Sn con-
by including Sn concentration gradients that are strictly centration gradients on the evaluation of the pinning force at
necessary to get valuable estimations of the pinning forces 4.2 K were assessed between the two generations: the pinning
above 10 T. mechanisms involved were derived by fitting the experimental
11Supercond. Sci. Technol. 34 (2021) 035028 M Ortino et al
F p (B) values and taking the experimentally observed Sn gradi- [14] Kramer E J 1973 J. Appl. Phys. 44 1360–70
ents into account. Absolute values of the single mechanisms [15] Baumgartner T, Hecher J, Bernardi J, Pfeiffer S,
at specific fields were calculated, showing that PP pinning is Senatore C and Eisterer M 2016 Supercond. Sci. Technol.
30 014011
clearly playing a role, taking over the GB-pinning contribu- [16] Baumgartner T 2013 Effects of fast neutron irradiation on
tion at 16 T in the ternary sample. Moreover, the importance critical currents and intrinsic properties of state-of-the-art
of including Sn gradients in F p (B) evaluations becomes evid- Nb3Sn PhD Thesis Technische Universität Wien
ent. If they are not accounted for, a low quality fit results at [17] Helfand E and Werthamer N R 1964 Phys. Rev. Lett.
high-fields and erroneous weights are ascribed to the involved 13 686–8
[18] Helfand E and Werthamer N R 1966 Phys. Rev.
pinning mechanisms. 147 288–94
[19] Werthamer N R, Helfand E and Hohenberg P C 1966 Phys.
Acknowledgments Rev. 147 295–302
[20] Baumgartner T, Eisterer M, Weber H W, Flükiger R,
Scheuerlein C and Bottura L 2013 Supercond. Sci. Technol.
This work has been carried out thanks to the support of 27 015005
EASITrain—European Advanced Superconductivity Innov- [21] Tarantini C, Balachandran S, Heald S M, Lee P J, Paudel N,
ation and Training. This Marie Sklodowska-Curie Action Choi E S, Starch W L and Larbalestier D C 2019
(MSCA) Innovative Training Networks (ITN) has received Supercond. Sci. Technol. 32 124003
funding from the European Union’s H2020 Framework Pro- [22] Hawes C D, Lee P J and Larbalestier D C 2000 IEEE Trans.
Appl. Supercond. 10 988–91
gramme under Grant Agreement No. 764879. [23] Hecher J, Baumgartner T, Weiss J, Tarantini C, Yamamoto A,
Jiang J, Hellstrom E, Larbalestier D and Eisterer M 2015
ORCID iDs Supercond. Sci. Technol. 29 025004
[24] Wang X et al 2015 IEEE Trans. Appl. Supercond. 25 1–6
[25] Xu X, Majoros M, Sumption M D and Collings E W 2015
M Ortino https://orcid.org/0000-0001-6509-4763 IEEE Trans. Appl. Supercond. 25 1–4
S Pfeiffer https://orcid.org/0000-0002-2085-0390 [26] Mess K H, Schmüser P and Wolff S 1996 Superconducting
T Baumgartner https://orcid.org/0000-0002-2228-1072 Accelerator Magnets (Singapore: World Scientific)
M Sumption https://orcid.org/0000-0002-4243-8380 [27] Xu X, Peng X, Sumption M and Collings E 2016 IEEE Trans.
J Bernardi https://orcid.org/0000-0002-4626-9246 Appl. Supercond. 27 1–5
[28] Ortino M and Eisterer M submitted
X Xu https://orcid.org/0000-0003-2728-5854 [29] Fischer C M 2002 Master of Science Thesis University of
M Eisterer https://orcid.org/0000-0002-7160-7331 Wisconsin-Madison
[30] Baumgartner T, Pfeiffer S, Bernardi J, Ballarino A and Eisterer
M 2018 Supercond. Sci. Technol. 31 084002
References [31] Dew-Hughes D 1974 Phil. Mag.: J. Theor. Exp. Appl. Phys.
30 293–305
[1] Godeke A 2006 Supercond. Sci. Technol. 19 R68–R80 [32] Witcomb M and Dew-Hughes D 1973 J. Mater. Sci.
[2] Tommasini D et al 2016 IEEE Trans. Appl. Supercond. 27 1–5 8 1383–400
[3] Dietderich D and Godeke A 2008 Cryogenics 48 331–40 [33] Campbell A M, Evetts J E and Dew-Hughes D 1968 Phil.
[4] Spina T, Ballarino A, Bottura L, Scheuerlein C and Flukiger R Mag.: J. Theor. Exp. Appl. Phys. 18 313–43
2017 IEEE Trans. Appl. Supercond. 27 395 [34] Maki K 1964 Phys. Phys. Fiz. 1 127–43
[5] Rumaner L E, Benz M G and Hall E 1994 Metall. Mater. [35] Devantay H, Jorda J, Decroux M, Muller J and Flükiger R
Trans. A 25 213 1981 J. Mater. Sci. 16 2145–53
[6] Zeitlin B A, Marte J S, Ellis D, Benz M and Gregory E 2004 [36] Orlando T, Alexander J, Bending S, Kwo J, Poon S,
AIP Conf. Proc 711 395–402 Hammond R, Beasley M, McNiff E and Foner S 1981 IEEE
[7] Zeitlin B, Marte J S, Ellis D, Benz M and Gregory E 2005 Adv. Trans. Magn. 17 368–9
Cryog. Eng. 50B 395 [37] Li Y and Gao Y 2017 Sci. Rep. 7 1–13
[8] Xu X, Sumption M, Peng X and Collings E 2014 Appl. Phys. [38] Hanak J, Strater K and Cullen G 1964 RCA (Radio
Lett. 104 082602 Corporation of America) Rev. (U.S.) 25 342
[9] Xu X, Sumption M and Peng X 2015 Adv. Mater. 27 1346 [39] Suenaga M, Welch D, Sabatini R, Kammerer O and Okuda S
[10] Xu X, Rochester J, Peng X, Sumption M and Tomsic M 2019 1986 J. Appl. Phys. 59 840–53
Supercond. Sci. Technol. 32 02LT01 [40] Xu X, Sumption M, Lee J, Rochester J and Peng X 2020 J.
[11] Balachandran S, Tarantini C, Lee P J, Kametani F, Su Y, Alloys Compd. 845 156182
Waker B, Starch W L and Larbalestier D 2019 Supercond. [41] Ekin J W 2010 Supercond. Sci. Technol. 23 083001
Sci. Technol. 32 044006 [42] Ekin J W, Cheggour N, Goodrich L and Splett J 2017
[12] Eisterer M 2004 Supercond. Sci. Technol. 18 S58–S62 Supercond. Sci. Technol. 30 033005
[13] Godeke A 2005 Performance boundaries in Nb3Sn [43] Ekin J W, Cheggour N, Goodrich L, Splett J, Bordini B
superconductors PhD Thesis University of Twente and Richter D 2016 Supercond. Sci. Technol.
Netherlands 29 123002
12You can also read