Exploring 2D Data Augmentation for 3D Monocular Object Detection
←
→
Page content transcription
If your browser does not render page correctly, please read the page content below
Exploring 2D Data Augmentation for 3D Monocular Object Detection
                                          Sugirtha T1 , Sridevi M1 , Khailash Santhakumar2 , B Ravi Kiran3 , Thomas Gauthier3 and Senthil Yogamani4
                                                 1 NIT Tiruchirappalli, India   2 SASTRA University, India    3 Navya, France  4 Valeo, Ireland

                                         Cutout 2 holes

                                         Cutout 4 holes
arXiv:2104.10786v1 [cs.CV] 21 Apr 2021

                                           Box-MixUp

                                          Box-Cut-paste

                                           Mosaic-Tile

                                         Fig. 1: Illustration of of different 2D data augmentations for Monocular 3D Object Detection. Red boxes highlight cutout
                                         regions and blue boxes denote object annotations which are used to mix or paste.

                                            Abstract— Data augmentation is a key component of CNN           constraints [2], (3) Keypoints detection [3] or (4) Direct 3D
                                         based image recognition tasks like object detection. However,      proposals generation [4].
                                         it is relatively less explored for 3D object detection. Many
                                         standard 2D object detection data augmentation techniques do          Convolutional Neural Networks (CNNs) learn complex
                                         not extend to 3D box. Extension of these data augmentations        hierarchical features from images. However, the models are
                                         for 3D object detection requires adaptation of the 3D geometry     susceptible to overfitting and require proper regularization
                                         of the input scene and synthesis of new viewpoints. This           techniques to be applied. Usual regularization techniques
                                         requires accurate depth information of the scene which may
                                         not be always available. In this paper, we evaluate existing 2D    include data augmentation, ie. image transformations such
                                         data augmentations and propose two novel augmentations for         as scaling, translation, random flipping etc. In computer
                                         monocular 3D detection without a requirement for novel view        vision, data augmentation is pervasive due to its simplicity to
                                         synthesis. We evaluate these augmentations on the RTM3D            implement and efficiency. In recent years, few regularization
                                         detection model firstly due to the shorter training times .        methods have been proposed to reduce overfitting of the
                                         We obtain a consistent improvement by 4% in the 3D AP
                                         (@IoU=0.7) for cars, 1.8% scores 3D AP (@IoU=0.25) for             model while training. This also improves the robustness of
                                         pedestrians & cyclists, over the baseline on KITTI car detection   CNNs to learn complex features.
                                         dataset. We also demonstrate a rigorous evaluation of the mAP         RTM3D[5] is a monocular 3D object detector that only
                                         scores by re-weighting them to take into account the class
                                         imbalance in the KITTI validation dataset.                         applies flipping to augment the training samples. In this
                                                                                                            paper, we propose variants of 2D data augmentations such
                                                              I. I NTRODUCTION                              as Cutout, CutPaste and Mixup and try all possible com-
                                                                                                            binations to find out the best suited combination in order
                                            3D object detection is crucial perception task in modern        to improve the detection accuracy over the baseline RTM3D
                                         autonomous driving applications, used upstream for scene           detector model. We define a family of 2D data augmentations
                                         understanding, object tracking and trajectory prediction and       and their transformations on monocular images for 3D object
                                         decision making. Initially, autonomous cars are equipped           detection. Also, we perform an ablation study on which our
                                         with LiDAR sensors and most 3D detectors rely on LiDAR             proposed augmentation methods improve the performance
                                         data to perform 3D object detection. LiDAR provides precise        over the RTM3D baseline. 3D monocular detection requires
                                         distance measure which makes it feasible to detect accurate        an expensive annotation process. 3D detection methods have
                                         3D bounding boxes. But, they are expensive to be deployed          mostly been trained on large-scale datasets, while data aug-
                                         in autonomous cars. Recent autonomous cars use single              mentation methods do exist but have not been explored
                                         monocular camera and hence monocular 3D object detection           further as in case of YOLOv3[6] or modern object detectors.
                                         (3D OD)became a research focus in computer vision com-             Our new data augmentation methods improve performance
                                         munity. 3D OD methods are usually part of the 4 following          greatly on 3D object detection for occlusion, pixel corruption
                                         categories: (1) 2D proposal generation [1], (2) Geometric          and better localization.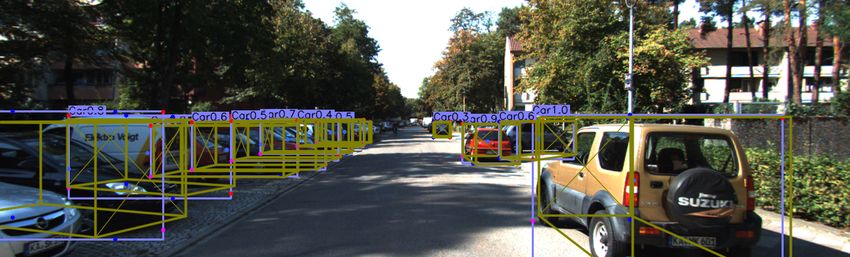
This paper evaluates an initial set of 2D data augmentation   improve their performances.
techniques for monocular 3D detection, without changing the
3D geometry of bounding boxes in the scene and avoiding          Advanced 2D Data Augmentations : Motivated by dropout
the requirement to synthesize new viewpoints of the input        regularization technique, few 2D data augmentations were
camera view. In summary, the contributions of our paper are      proposed in recent years for object classification task.
as follows:                                                      CutOut[11] removes a square region from the input image
   • We evaluate the performance of photometric as well as       and fills it with any of the following : (i) black pixels (ii)
     region based 2D data augmentations for the monocular        grey pixels (iii) Gaussian noise. In other words, it performs
     3D object detection task.                                   dropout but in the input space. This drives the model to
   • We propose three new 2d data augmentation strategies        spotlight on the whole image instead of focusing on a few
     that significantly improve the detection accuracy of the    key features. Still, there is a chance to loose informative pix-
     baseline RTM3D detector namely Box-MixUp, Box-              els during training. Mixup[12] performs linear interpolation
     Cut-Paste, and Mosaic-Tile.                                 of two randomly drawn images. Yet, the resultant images
Extensive analysis on KITTI dataset[7] demonstrates that our     sometimes look unusual and it may confuse the model during
proposed augmentations improve performance under various         localization task.
conditions: occlusions, contrasted/shadowed pixels, changing        CutMix[13] overcomes the limitations in CutOut and
the diversity of viewpoints of objects seen in the dataset.      Mixup by replacing the square region with a patch of
                                                                 identical dimensions from another image. This results in no
                    II. R ELATED W ORK                           loss of informative pixels while training, besides preserving
   2D OD on image plane is inadequate for reliable               the advantages of regional dropout in input space. Also, the
autonomous driving scenario because it does not provide          images formed are legitimate compared to Mixup. Smooth-
an accurate estimation of 3D objects sizes and space             mix[14] is proposed to minimize the “strong-edge” problem
localization. In other words, 2D OD methods have limited         caused due to regional dropout. The model takes two images
performance in following scenarios namely Occlusion,             from training set and generates augmented images by per-
Object pose estimation and 3D position information. A 3D         forming element-wise addition of two images (xi , xj ) after
bounding box provides precise information about size of          an element-wise multiplication with a smoothly transitioning
the object and its position in 3D space.                         mask G.
                                                                    All 2D data augmentations discussed above when applied
3D Object Detection : Recently, many researchers proposed        to 3D space require synthesizing new view points of the
various techniques for 3D Monocular Object Detection.            input view and orientation of the bounding boxes will
RTM3D[5] and its extension KM3D[4] use CenterNet[3] to           get distorted. In this paper, we extend existing 2D data
regress a set of 9 projected keypoints corresponding to a        augmentations without modifying the 3D geometry of
3D cuboid in image space (8 vertices of the cuboid and its       bounding box and avoid synthesizing new view points for
center). They also perform direct regression for the object’s    the input camera view.
distance, size and orientation. These values are then used for
offline initialization of an optimizer to estimate 3D bounding   YOLOv4[15] is a 2D object detector which which has im-
boxes under geometric constraints. CenterNet provides basic      proved object detection accuracy mainly thanks to adequate
data augmentation such as affine transformations (shifting,      data augmentation such as Cutout, Mixup and CutMix. Ad-
scaling) and random horizontal flipping. Over these, KM3D        ditionally, they introduced the mosaic data augmentation to
adds coordinate independent augmentation via random color        detect small objects. Mosaic data augmentation in YOLOv4
jittering.                                                       merges 4 training samples directly and applies random crop-
    SMOKE[8] regresses 3D bounding box directly from             ping to produce augmented image. The recent developments
image plane which eliminates 2D bounding box regression.         in 2D data augmentations suggest their potential utility for
It represents an object by a single keypoint and these           the monocular 3D detection task, while assuming some
keypoints are projected as 3D center of each object.             geomtrical constraints.
Mono3D[9] is a region proposal based method that uses            3D augmentations with view synthesis: Both traditional
semantics, object contours and location priors to generate       and advanced data augmentations discussed above can be ap-
3D anchors. It generates proposal by performing exhaustive       plied only in 2D image space. To handle data augmentations
search on 3D space and use Non-maximal suppression               for objects in 3D, performing in varying viewpoints a view
for filtering. SMOKE augments the training samples with          synthesis problem is required to be solved. RoI-10D[17] lifts
horizontal flipping, scaling and shifting. GS3D[10] predicts     2D RoIs to 3D for 6 DoF pose regression. Authors show
the guidance of cuboid and performs feature extraction by        that 3D synthetic data augmentation was achieved by in-
projecting region of guidance. GS3D performs monocular           painting 3D meshes directly onto the 2D scenes. MoCa -
3D detection without augmenting the training data. We            multi modality cut and paste[18] was proposed to overcome
observe that few detectors applied basic augmentations and       the limitations of cut-paste[19] that is applicable for single-
few others applied none. In this paper, we propose data          modality 3D detectors. MoCa is readily applicable for multi-
augmentations that can be deployed on the 3D detectors to        modality 3D object detection while preserving consistency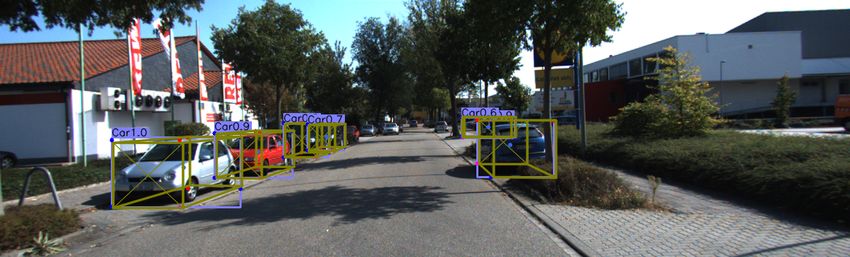
∗
             TABLE I: List of data augmentations studied for 3D-MOD.                       indicates proposed 2D transforms.
             Data augmentation Transforms   Description and Utilization
             Cutout (holes, W)              Cutout removes a randomly chosen patch from the image and those pixels are zeroed.
                                            Cutout parameters include the number of square holes and their side.
             Photometric pixel-wise DA      Standard pixel level data augmenations which apply motion blur, RGB shifts and
                                            Random contrast from the albumentations library [16].
             Box - MixUp∗                   Generates an augmented (image, bounding box set) pairs by averaging the pixel values
                                            between the two images (reference & random samples) only within masks defined by
                                            the bounding box.
             Box - Cut - Paste∗             A variation of Box-Mixup is local-cut-paste where regions of the 2D bounding box
                                            from the second image is pasted on to the reference image.
             Mosaic-Tile∗                   Augmented image is created by tiling/concatenating the 4 corresponding quadrants of
                                            four different training samples into one image.

when fusing point cloud and image pixels. Dense LiDAR                     in Fig. 1.
pre-mapping can be leveraged to aid cutting out dynamic
objects [20].                                                                Box-Mixup : Motivated by the work on Mixup data
                                                                          augmentation [12] which was applied to image level classifi-
                  III. P ROPOSED M ETHOD                                  cation problems, we aim here to propose an equivalent for 2D
                                                                          object detection. Box-MixUp is thus proposed to augment an
   Generally there are multiple families of 2D data augmen-
                                                                          image with object patches from other images, thus providing
tations that are employed in literature discussed below.
                                                                          the same advantages of MixUp but localized over multiple
   Pixel level data augmentation : Photometric augmenta-
                                                                          regions in the image. Box-MixUp generates an augmented
tion includes changes to the pixel values such as contrast,
                                                                          sample pair by averaging pixels of two input images under a
blurring, brightness or color changes.
                                                                          mask containing all bounding boxes from the second image,
   Regional data augmentation : We refer to data augmen-
                                                                          while concatenating both ground truth bounding box sets.
tations that mask, transform or change multiple locations in
the image domain at the same time as regional data augmen-                       e = (0.5xA + 0.5xB ) · MB + xA · (1 − MB )
                                                                                 x
tations. Coarsedrop [16] is an example of region transform.                                                                          (1)
                                                                                 ye = yA ∪ yB
Occlusion occurs because of regional augmentation and our
proposed Cutout helps the detector to detect occluded objects                Box-Cut-Paste : Cut-Paste data augmentation [19] uses
more accurately. Hence it overcomes the effects due to region             pre-existing masks and background scenes to artificially cre-
based augmentations and thus increasing the robustness                    ate an augmented dataset to train an object detection model.
of the detector. Motion blur is simulated by the blurring                 In Box Cut-Paste, we propose not to use a separate mask.
transformation which is regional augmentation.                            The transformation directly pastes pixels under a bounding
   Geometric data augmentation : transfers image pixels to                box from a reference image onto another image. This further
new positions and hence changes the image geometry. This                  ensures the object context is preserved and avoids unrealistic
can include reflection, rotation, cropping, translation, scaling,         scenarios possible in Cut-Paste, such as cars in the sky. This
flipping, etc.                                                            is because the cut paste is only done over bounding box
                                                                          masks already existing in source images from the dataset.
A. Data augmentation (DA) methods                                         There might be cases where objects could get pasted on walls
                                                                          or other unusual backgrounds, though the perspective of the
   The input training image is represented by tensor x ∈                  object remains natural.
RW ×H×3 while the training bounding boxes coordinates by
y along with its class label. The data augmented samples are                                e = xA · (1 − MB ) + xB · MB
                                                                                            x
                                                                                                                                     (2)
represented by (ex, ye). They are generated from reference im-                              ye = yA ∪ yB
ages designated by (xA , yA ) and (xB , yB ) (image, bounding
                                                                             Mosaic-Tile : YOLOV4 proposed by authors [15] in-
box set). The data augmentations we proposed in this paper
                                                                          troduces the Mosaic augmentation, which takes 4 training
are under one of the two categories:
                                                                          images in different contexts and tiles them into one. It then
  •   Data augmentations that transform only the input train-             performs random cropping to produce an augmented image
      ing image xA without modifying the ground truth boxes               of size equal to the original training image size. The batch
      yB , Ex. Cutout and Photometric transformations.                    normalization evaluates activation values across 4 different
  •   Augmentations that modify both image and ground truth               images reducing the requirement for a large mini-batch size.
      boxes. Ex. Box-Mixup                                                Mosaic increases the scale diversity of objects by tiling
   Finally, let M ∈ {0, 1}W ×H be a binary mask which is 1                images at different scales.
for pixels included by the set of bounding boxes in ground                   Our proposed Mosaic-Tile augmentation takes distinct
truth y, and 0 otherwise. The list of data augmentations                  parts from four different training images and combines them
evaluated in this study are described in Table I and illustrated          into one as shown in Fig. 2. To ensure that we do not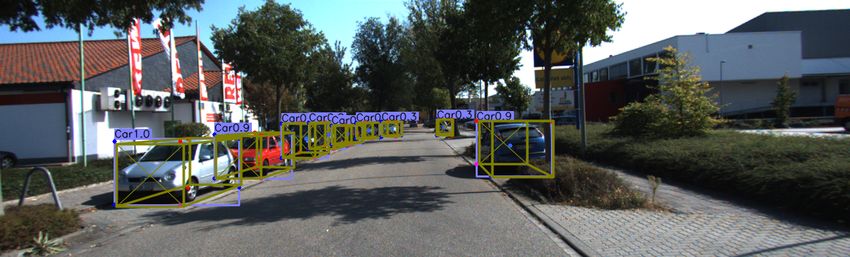
Fig. 2: Proposed mosaic data augmentation that preserves relative positions of 3D bounding box locations within each time
as well as the final resolution of images.

select bounding boxes from an input sample, which is outside        to any other Monocular 3D object detection model. RTM3D
its corresponding tile’s extent in the augmented image, we          and few other models had begun evaluating a simple set of
ensure that at least 40% of boxes area is within the corre-         2D data augmentations, while there was no systematic study
sponding tile. Ground truth boxes under this threshold and          yet done, and was the motivation for this study.
outside their tiles are eliminated from training to avoid over-
                                                                    B. Dataset and Implementation Details
fitting (insufficient image pixels available for these boxes). In
future work this threshold hyper-parameter shall be studied            We evaluate our data augmentations on the KITTI 3D
to obtain the best detection results. The advantage of our          detection benchmark which consists of 7,481 labeled training
proposed Mosaic-Tile are quite similar to the original Mosaic       samples and 7518 unlabeled testing samples. Since the
augmentation. In our current evaluation we do not randomize         ground truth labels for the test set are not available, we evalu-
the image coordinates at which we split the image and keep          ated our model by splitting the training set into 3711 training
this to be the center of the image across all training. Here        samples and 3768 validation samples. We experiment with
again, this a way to somehow preserve the scene geometry            ResNet-18 as backbone. We implemented our deep neural
while combining different contexts.                                 network in Pytorch and trained using Adam optimizer with
    IoU check : The Box-Mixup & Box Cut-Paste augmen-               learning rate of 1.25*1e-4 for 200 epochs. We trained our
tations were evaluated under two different conditions.              network with a batch size of 16. Our model achieved best
                                                                    speed with 33 FPS on a NVIDIA GTX 2080Ti GPU.
    • In the first case we enforce that no two boxes between
      the two input samples overlap by a large margin.              C. Results
      This was achieved by evaluating the 2D-IoU between               The KITTI benchmark evaluates the models by Average
      pairs of boxes coming from two different samples and          Precision(AP) of each class (Car, Pedestrain and Cyclist)
      ensuring the intersection was smaller than 0.4. That          under easy, moderate and hard conditions. We report two
      is IoU(Bi , Bj ), ∀Bi ∈ yA , Bj ∈ yB . If the IoU is          official evaluation metrics for “Test set” for comprehensive
      too high, the incoming bounding box is rejected from          evaluation: AP for 3D bounding boxes AP3d and AP for
      the augmentation and the mixup/paste operation is not         Birds Eye View APbev . We tabulate the results under two IoU
      performed in the image domain.                                thresholds for each class. IoU = 0.7 and IoU = 0.5 for Car
    • In the second case, we do not filter boxes using any IoU
                                                                    category. IoU = 0.5 and IoU = 0.25 for Pedestrian and Cyclist
      threshold and permit all possibilities.                       categories. Comparison of baseline results with our proposed
    In Table III the presence of IoU condition is designated        data augmentations is shown in Table II. IoU thresholds for
by B+Box-Mixup (w iou) and its absence B+Box-Mixup (w/o             Car are 0.7 while 0.25 for pedestrian and cyclists.
iou).                                                                  To further describe the results we use two other evaluation
                                                                    metrics already known in literature: First, the Mean Average
                         IV. R ESULTS
                                                                    Precision (mAP) The mean value of the Average Precision
A. Baseline Model                                                   (AP) over all classes :
   RTM3D[5] is a real-time network that is based on the Cen-                                         1 X
terNet architecture, which enables both fast training cycles                           mAP3D =             APc                 (3)
                                                                                                   |C|
and small inference times. Authors have already provided                                                c∈C

a set of baseline data augmentations which include flip,            where C = {car, pedestrian, cyclist}. Second we introduce
affine transformations, stereo dataset augmentation using the       the, Inverse Class Frequency Weighted (ICFW) mAP metric.
left/right images in the KITTI dataset. RTM3D architecture          This new metric was introduced to demonstrate the class im-
enables a faster evaluation of data augmentation strategies.        balance inherent in the KITTI dataset. The relative frequency
It is important to note that the data augmentation methods          (denoted by fc and in blue) of car, pedestrian and cyclist
proposed in this study are quite generic and can be employed        classes in the validation classes for the different difficulty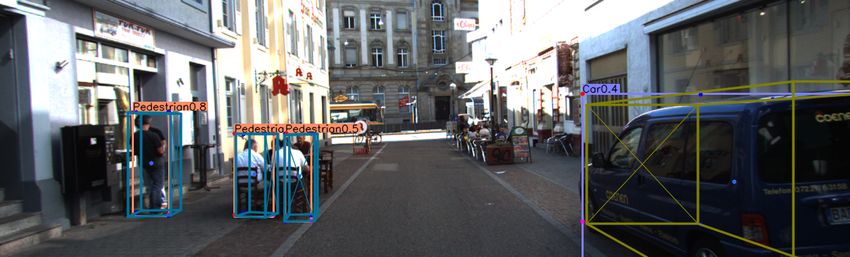
TABLE II: AP3D scores for data augmentations with RTM3D evaluated over : Car, Pedestrain and Cyclist. For each data
augmentation method we show the difference in AP scores w.r.t the baseline. Green refers to positive gains, while red refers
to negative drops in performance. The highest improvements have been highlighted for each difficultly level and class.
Classes Car(IoU=0.7) Pedestrian(IoU=0.25) Cyclist(IoU=0.25)
AP3D APBEV AP3D APBEV AP3D APBEV
Augmentations E M H E M H E M H E M H E M H E M H
Baseline (B) 12.28 9.7 8.12 18.74 14.13 13.33 17.64 17 16.26 20.81 17.42 16.6 23.02 16.27 14.34 23.64 16.57 14.39
B+cutout 2 holes 1.24 0.18 0.25 6.17 3.86 3.74 2.4 0.31 0.23 -0.35 0.33 0.17 -0.27 -0.41 -0.95 -0.47 -0.57 1.41
B+Mosaic 2.77 3.82 3.97 1.45 2.74 2.29 2.79 0.54 0.48 0.18 0.36 0.44 -0.21 -0.5 1.2 1.56 -0.27 1.28
B+pixAug 0.78 0.01 0.05 5.53 4.12 3.97 3.4 0.56 0.44 0.88 0.82 0.42 -3.55 -3.31 -2.02 -2.73 -3.49 -1.99
B+pixAug+mosaic -1.92 -1.85 -0.64 1.89 2.79 2.25 4.1 1.52 0.95 1.01 1.18 0.66 -7.27 -5.67 -3.72 -6.92 -5.78 -3.4
B+Box-Mixup (w/o iou) 4.59 4.42 4.42 4.99 5.41 3.83 1.76 -0.98 -1.6 -0.89 -1.2 -1.46 4.29 1.39 2.32 4.94 1.89 2.83
B+Box-Mixup (w iou) 3.42 3.9 4.2 3.15 3 3.03 3.64 1.16 1.01 1.18 1.07 1.3 -1.31 -1.98 0.04 -1.44 -1.89 0.22
B+Box-CutPaste (w/o iou) 2.35 3.87 4.15 1.49 2.83 2.98 3.51 0.59 0.58 0.98 0.51 0.83 2.51 0.55 1.42 2.01 0.36 1.91
B+Box-CutPaste (w/ iou) 4.08 4.17 4.27 3.63 3.3 3.42 3.58 1.21 0.72 1 1 0.72 3.54 0.94 1.92 3.03 0.69 1.93
TABLE III: mAP and ICFW mAP scores for both 3D and BEV detection bounding boxes at various IoUs. The values of
different data augmentations below the baseline correspond to the difference. Green refers to positive gains, while red refers
to negative drops in performance.
IoU = 0.25 mAP3D mAPBEV ICFW mAP3D ICFW mAPBEV
E M H E M H E M H E M H
Baseline (B) 32.60 25.63 24.57 40.87 32.74 29.19 15.16 19.63 16.59 27.03 19.63 16.59
B+Box-Mixup (w/o iou) -0.50 0.80 -0.83 1.43 0.56 0.78 1.05 1.80 1.85 3.51 1.80 1.85
B+Box-Mixup (w iou) -0.10 1.89 0.29 -0.26 -0.32 0.50 0.09 -1.74 0.44 -0.88 -1.74 0.44
B+Box-CutPaste (w/o iou) -6.17 -3.60 -5.32 -8.19 -5.50 0.84 -2.84 0.31 1.60 1.53 0.31 1.60
B+Box-CutPaste (w/ iou) -0.50 1.84 0.22 0.88 0.54 0.91 0.15 0.65 1.60 2.33 0.65 1.60
IoU = 0.5 mAP3D mAPBEV ICFW mAP3D ICFW mAPBEV
E M H E M H E M H E M H
Baseline (B) 22.78 17.80 16.85 33.39 25.08 22.23 13.05 18.16 15.73 25.42 18.16 15.73
B+Box-Mixup (w/o iou) 0.04 -0.59 -0.78 1.80 0.62 0.71 1.17 1.81 1.85 3.59 1.81 1.85
B+Box-Mixup (w iou) 0.04 0.41 0.21 -0.11 -0.31 0.44 0.12 -1.74 0.43 -0.85 -1.74 0.43
B+Box-CutPaste (w/o iou) -6.52 -5.29 -5.50 -9.26 -5.75 0.69 -2.91 0.26 1.58 1.30 0.26 1.58
B+Box-CutPaste (w/ iou) -0.39 0.39 0.23 0.45 0.42 0.71 0.17 0.62 1.58 2.24 0.62 1.58
IoU = 0.7 mAP3D mAPBEV ICFW mAP3D ICFW mAPBEV
E M H E M H E M H E M H
Baseline (B) 4.53 3.67 3.07 6.73 5.20 4.93 1.54 1.36 1.08 2.12 1.79 1.74
B+Box-Mixup (w/o iou) 1.16 1.10 1.18 1.37 1.48 0.96 -0.26 -0.27 -0.10 -0.04 -0.09 -0.20
B+Box-Mixup (w iou) 1.49 1.52 1.63 1.36 1.25 1.29 0.51 0.52 0.69 0.40 0.37 0.38
B+Box-CutPaste (w/o iou) 0.92 1.06 1.23 1.14 1.01 1.02 -0.08 -0.06 0.12 0.61 0.44 0.44
B+Box-CutPaste (w/ iou) 0.76 1.12 1.29 0.62 0.87 0.92 0.15 -0.07 0.12 0.41 0.08 0.09
levels (based on thresholds over object occlusion levels) are all classes for IoU = 0.5. The table shows in red cases where
shown in Table IV. To reduce the effect of the dominant class the data augmentation performed poorly, and in green where
(here the car) and observe which data augmentation method it performed better, with each entry showing the difference
produces gains in detection in least represented class, we w.r.t the baseline.
introduce the inverse class weighting. This is evaluated by We observe that even though the mAP scores improve-
the following formula : ments might be negligible or negative in for some data aug-
f −1 X mentations the ICFW mAP scores reflect the improvement
wc := P c −1 ∈ [0, 1] and wc = 1 (4) in performance reweighted due to reflect poor pedestrian and
c∈C fc c∈C cyclist class frequencies.
The values of wc are shown in Table IV in red. Now the The mAP of the RTM3D detector is improved reasonably
ICFW mAP is evaluated as : with our proposed data augmentations. We find that our
X proposed augmentations are applicable over any baseline
ICFW mAP3D = wc APc (5) independent of the method. The RTM3D has two main
c∈C
data augmentation schemes already implemented which we
D. Analysis consider as our baseline model : 1. Affine transformations,
From Table II, it is clear that Box - Mixup outperforms all 2. image transforms. We do not include the stereo image pair
other augmentations for “Car” class in terms of AP3d and from the KITTI dataset to extend the size of the dataset, or
APbev for both IoU = 0.7 and 0.5. Cutout-2 holes is best cited by [5] as stereo dataset augmentation. This produces a
suited augmentation for “Pedestrian” class for AP3d (IoU = different baseline result in our case.
0.5) and APbev (IoU = 0.5&0.25). For “Cyclist” class, Fig. 3 shows the detection results of our proposed
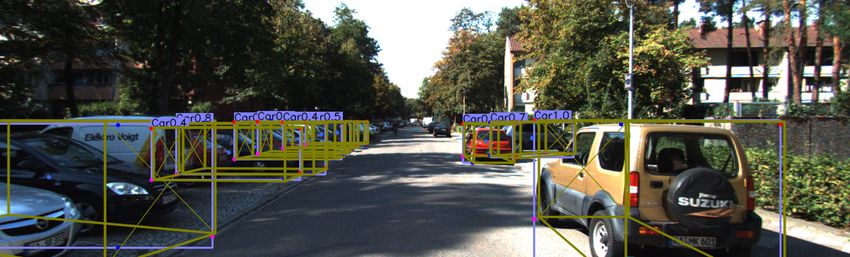
different augmentations suit different conditions. Box-Mixup data augmentation on KITTI in different
Table III shows different combinations of the proposed scenarios. Ex. Occluded objects, missed detections and
augmentations experimented on KITTI dataset. It tabulates mis-classification by baseline. It shows baseline, Box-Mixup
the average mAP for each difficulty level (E, M and H) over predictions on left panel and their corresponding BEV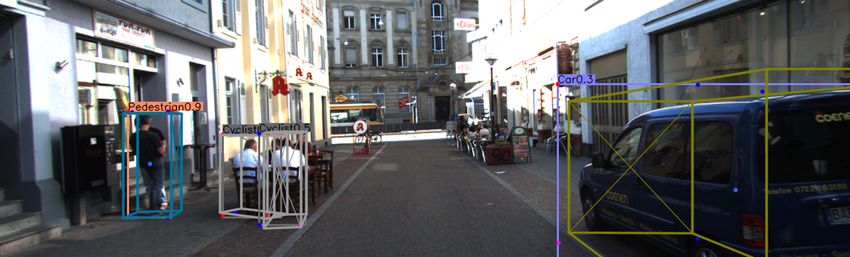
Baseline model

               BoxMixup Augmentation

                                                                              (a) Left: Baseline, Right : Box-MixUp
                    Baseline model

               BoxMixup Augmentation

                                                                              (b) Left: Baseline, Right : Box-MixUp
                    Baseline model

               BoxMixup Augmentation

                                                                              (c) Left: Baseline, Right : Box-MixUp
Fig. 3: Illustration of Box-Mixup data augmentation in various scenarios. Each time contains the (baseline, Box-Mixup)
prediction pair on the left panel, while the BEV representations (baseline, data augmented) pair on the right panel.

representations on right panel.                               TABLE IV: Class Frequencies over different difficulty cases
                                                              Easy, Moderate, Hard with (fc /wc ) pair in each cell.
                                                                     Class/Difficulty      Car      Pedestrian    Cyclist
E. Analysis of Results                                               Easy               0.68/0.07    0.26/0.19   0.07/0.74
                                                                     Moderate           0.78/0.06    0.17/0.01   0.05/0.92
   From the comparison in Table III, the key data augmen-            Hard               0.80/0.04    0.16/0.21   0.04/0.75
tation where observed improvement were the Box-Mixup
and Box-CutPaste with an IoU check. When used without
the IoU check we observe the drop in ICFW mAP scores          a more diverse augmented images.
denoting that the car AP score dominated the mAP scores.        Effect of IoU : Box-MixUp augmentations generated with
Ensuring that no two boxes from different images have a       low IoU constraint between training images, provide better
large intersection enables the data augmentation to provide   performance for pedestrian and cyclists classes.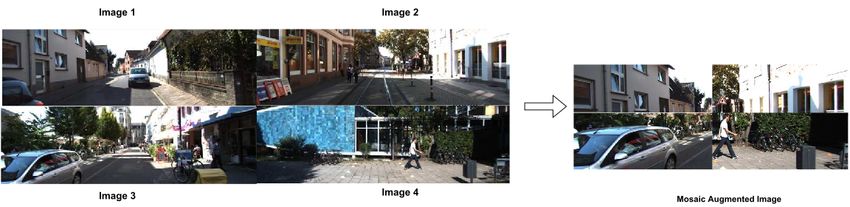
Effect of Class imbalance : The data augmentations that                   [10] B. Li, W. Ouyang, L. Sheng, X. Zeng, and X. Wang, “Gs3d: An
performed well on the majority class are not optimal for the                      efficient 3d object detection framework for autonomous driving,” in
                                                                                  The IEEE Conference on Computer Vision and Pattern Recognition
low frequency pedestrian and cyclist classes.                                     (CVPR), June 2019.
   Table II shows the class-wise performance of all data                     [11] T. Devries and G. W. Taylor, “Improved regularization of convolutional
augmentation methods. Global evaluation of all proposed                           neural networks with cutout,” ArXiv, vol. abs/1708.04552, 2017.
                                                                             [12] H. Zhang, M. Cisse, Y. N. Dauphin, and D. Lopez-Paz, “mixup:
data augmentations is shown in Table III. Almost all data                         Beyond empirical risk minimization,” International Conference on
augmentations have increased performance over "Car" and                           Learning Representations, 2018.
"Cyclists" classes. But, performance gain across data aug-                   [13] S. Yun, D. Han, S. J. Oh, S. Chun, J. Choe, and Y. Yoo, “Cutmix:
                                                                                  Regularization strategy to train strong classifiers with localizable
mentation methods on "Pedestrian" class is lower. We hy-                          features,” in Proceedings of the IEEE/CVF International Conference
pothesize that this is due to the symmetry in width and height                    on Computer Vision, 2019, pp. 6023–6032.
of pedestrians (which is not the case with cyclists where there              [14] J.-H. Lee, M. Z. Zaheer, M. Astrid, and S.-I. Lee, “Smoothmix: a
                                                                                  simple yet effective data augmentation to train robust classifiers,” in
are 3 distinct dimensions). This makes the network uncertain                      Proceedings of the IEEE/CVF Conference on Computer Vision and
in localizing "Pedestrian" class.                                                 Pattern Recognition Workshops, 2020, pp. 756–757.
                                                                             [15] A. Bochkovskiy, C.-Y. Wang, and H. Liao, “Yolov4: Optimal speed
                                                                                  and accuracy of object detection,” ArXiv, vol. abs/2004.10934, 2020.
                          V. C ONCLUSION                                     [16] A. Buslaev, V. I. Iglovikov, E. Khvedchenya, A. Parinov, M. Druzhinin,
                                                                                  and A. A. Kalinin, “Albumentations: Fast and flexible image
   We have evaluated a family of 2D data augmentations                            augmentations,” Information, vol. 11, no. 2, 2020. [Online].
for monocular 3D object detection in images, along with                           Available: https://www.mdpi.com/2078-2489/11/2/125
                                                                             [17] F. Manhardt, W. Kehl, and A. Gaidon, “Roi-10d: Monocular lifting
a set of novel 2D data augmentations without changing the                         of 2d detection to 6d pose and metric shape,” in Proceedings of the
3D geometry and avoids synthesizing new viewpoints. The                           IEEE/CVF Conference on Computer Vision and Pattern Recognition,
data augmentations were applied over the RTM3D detector                           2019, pp. 2069–2078.
                                                                             [18] W. Zhang, Z. Wang, and C. C. Loy, “Multi-modality cut and paste for
as baseline. In spite of these 2D data pixel/region level                         3d object detection,” ArXiv, vol. abs/2012.12741, 2020.
augmentations, improvements were observed in (mAP3D )                        [19] D. Dwibedi, I. Misra, and M. Hebert, “Cut, paste and learn: Surpris-
and (mAPbev ) scores. This was due to improved invariance                         ingly easy synthesis for instance detection,” 2017 IEEE International
                                                                                  Conference on Computer Vision (ICCV), pp. 1310–1319, 2017.
to conditions like occlusion, corrupted pixels, novel orien-                 [20] B. Ravi Kiran, L. Roldao, B. Irastorza, R. Verastegui, S. Suss,
tations of object masks in 3D with varying background. As                         S. Yogamani, V. Talpaert, A. Lepoutre, and G. Trehard, “Real-time
seen in Fig. 3 the Box-MixUp augmentation provides better                         dynamic object detection for autonomous driving using prior 3d-
                                                                                  maps,” in Proceedings of the European Conference on Computer
separation of occluded vehicles, as well at a farther distance                    Vision (ECCV) Workshops, 2018.
detection.
   To achieve a better performance across all classes we aim
to study a better sampling mechanism in future work that
takes into account the class imbalance inherent in the KITTI
dataset.

                            R EFERENCES
 [1] H. Law and J. Deng, “Cornernet: Detecting objects as paired key-
     points,” in The European Conference on Computer Vision (ECCV),
     September 2018.
 [2] X. Zhou, J. Zhuo, and P. Krahenbuhl, “Bottom-up object detection
     by grouping extreme and center points,” in The IEEE Conference on
     Computer Vision and Pattern Recognition (CVPR), June 2019.
 [3] X. Zhou, D. Wang, and P. Krähenbühl, “Objects as points,” ArXiv,
     vol. abs/1904.07850, 2019.
 [4] P.-X. Li, “Monocular 3d detection with geometric constraints embed-
     ding and semi-supervised training,” ArXiv, vol. abs/2009.00764, 2020.
 [5] P. Li, H. Zhao, P. Liu, and F. Cao, “Rtm3d: Real-time monocular
     3d detection from object keypoints for autonomous driving,” in Com-
     puter Vision – ECCV 2020, A. Vedaldi, H. Bischof, T. Brox, and
     J.-M. Frahm, Eds. Cham: Springer International Publishing, 2020,
     pp. 644–660.
 [6] J. Redmon and A. Farhadi, “Yolov3: An incremental improvement,”
     ArXiv, vol. abs/1804.02767, 2018.
 [7] A. Geiger, P. Lenz, and R. Urtasun, “Are we ready for autonomous
     driving? the kitti vision benchmark suite,” in 2012 IEEE Conference
     on Computer Vision and Pattern Recognition, 2012, pp. 3354–3361.
 [8] Z. Liu, Z. Wu, and R. Tóth, “Smoke: single-stage monocular 3d object
     detection via keypoint estimation,” in Proceedings of the IEEE/CVF
     Conference on Computer Vision and Pattern Recognition Workshops,
     2020, pp. 996–997.
 [9] X. Chen, K. Kundu, Z. Zhang, H. Ma, S. Fidler, and R. Urtasun,
     “Monocular 3d object detection for autonomous driving,” in Pro-
     ceedings of the IEEE Conference on Computer Vision and Pattern
     Recognition (CVPR), June 2016.
You can also read