User Localization Based on Call Detail Record
←
→
Page content transcription
If your browser does not render page correctly, please read the page content below
User Localization Based on Call Detail Record

                                             Buddhi Ayesha1 , Bhagya Jeewanthi2 , Charith Chitraranjan1 , Amal Shehan
                                                                Perera1 , and Amal S. Kumarage2
                                                  1
                                                       Department of Computer Science & Engineering, University of Moratuwa
                                              2
                                                      Department of Transport & Logistics Management, University of Moratuwa
arXiv:2108.09157v1 [cs.LG] 20 Aug 2021

                                                                        buddhiayesha.13@cse.mrt.ac.lk

                                                      Abstract. Understanding human mobility is essential for many fields,
                                                      including transportation planning. Currently, surveys are the primary
                                                      source for such analysis. However, in the recent past, many researchers
                                                      have focused on Call Detail Records (CDR) for identifying travel pat-
                                                      terns. CDRs have shown correlation to human mobility behavior. How-
                                                      ever, one of the main issues in using CDR data is that it is difficult to
                                                      identify the precise location of the user due to the low spacial resolution
                                                      of the data and other artifacts such as the load sharing effect. Exist-
                                                      ing approaches have certain limitations. Previous studies using CDRs
                                                      do not consider the transmit power of cell towers when localizing the
                                                      users and use an oversimplified approach to identify load sharing effects.
                                                      Furthermore, they consider the entire population of users as one group
                                                      neglecting the differences in mobility patterns of different segments of
                                                      users. This research introduces a novel methodology to user position
                                                      localization from CDRs through improved detection of load sharing ef-
                                                      fects, by taking the transmit power into account, and segmenting the
                                                      users into distinct groups for the purpose of learning any parameters of
                                                      the model. Moreover, this research uses several methods to address the
                                                      existing limitations and validate the generated results using nearly 4 bil-
                                                      lion CDR data points with travel survey data and voluntarily collected
                                                      mobile data.

                                                      Keywords: Call Detail Records · Localization · Load Sharing Effect ·
                                                      Mobile Network Big Data · Data fusion · Data mining.

                                         1        Introduction
                                         Human mobility patterns are critical sources of information for designing, analyz-
                                         ing and enhancing transport planning activities. These transportation initiatives
                                         require mobility rich data to become a continuous process. Currently, manually
                                         carried out roadside surveys or household surveys are done once every few years
                                         provide input data for such initiatives. Such data collection while being expen-
                                         sive, takes time and is often outdated by the time it is available for analysis. Such
                                         drawbacks of the existing methodologies create the necessity for more advanced
                                         data extraction techniques to analyze human motion.
                                             The recent adoption of ubiquitous computing technologies, including mobile
                                         devices by very large portions of the world population has enabled the capturing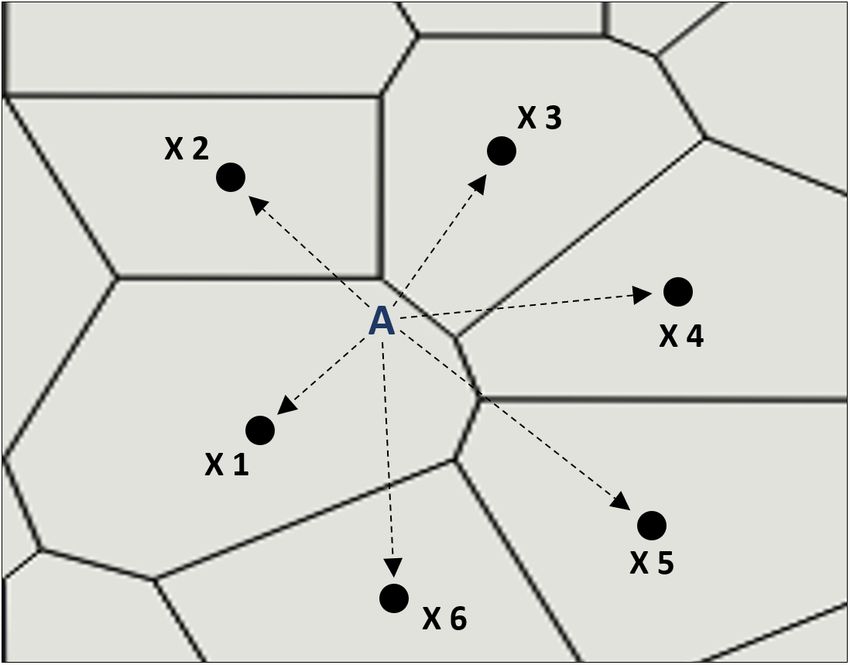
2      B. Ayesha et al.

of large-scale spatio-temporal data about human motion [8]. Large-scale pene-
tration of mobile phones serves as a dynamic source to derive insights on human
mobility due to the generation of big data. Mobile Network Big Data makes it
possible to locate mobile devices in time and space with a certain accuracy using
the mobile network infrastructure that includes location information of the mo-
bile device [7]. In the present scenario, Call Detail Records (CDR) data, which
is collected by mobile phone carriers for billing purposes is the most common
type of MNBD used in a variety of transportation studies. CDRs generate the
time-stamped locations of the users. All the phone numbers are replaced by a
computer generated unique identifier by the operator to preserve the anonymity
and the privacy of the users. A single CDR contains a random ID number of the
phone, device and phone number, exact time and date, call duration, location in
terms of latitude and longitude of the cell tower that provide the network signal.
When a person makes a call, all this information gets recorded as an array of
data. These arrays of data provide information on the mobility of the users based
on the places they have travelled.
    Though CDR has the potential to provide information on human mobility
insights at a wider scope, there are certain limitations embedded within CDR
data that makes the accuracy of the derived information to be low. One main
limitation of the CDR data is that for a given call, there may be frequent changes
in the serving tower with no actual displacement of the user, which is referred to
as the load sharing effect [2]. This is mainly because the operator often balances
call traffic among adjacent towers by allocating a new call to the tower that is
handling a lower call volume at that moment. As an example, Fig. 1 indicates
the general demonstration of cell towers. User has the possibility of connecting
to any tower depicted. But the tower is allocated by the operator based on the
total number of calls each one can handle. With that, user might get connected
to X1 at one time and next time to X2, even though the A’s location does not
change.

                            Fig. 1. Load sharing effect

   Due to this process, the towers providing the signal varies without actual
displacement of the user. This has a large effect on the transportation aspect
User Localization Based on Call Detail Record 3
since the trip counts between origins and destinations may exceed actual val-
ues, behavioral structures may incorrectly be identified and etc. Therefore, it
is mandatory to fix the existing issues in order to use these real-time data for
transportation forecasting processes.
Other than the load sharing effect, one other main issue is the localization
error, which means the user’s location is identified as anywhere within the area of
the connected cell tower. For an example, user A’s ( Fig. 1) location is identified
as anywhere within the coverage area of X1, X2 or X6. Existing studies do not
take into account, the load sharing effect or the transmit power of the connected
cell tower when localizing the user. The study propose an improved method to
localize the user by incorporating the load sharing effect as well as the transmit
power levels of the cell towers. Furthermore, when it is required to fit any model
parameters to the data, the first attempt is to identify separate groups of users
based on demographic attributes and fit the parameters separately to different
groups as opposed to the conventional approach of fitting parameters to the
entire population of users as one.
This study demonstrates a method to reduce the localization error from CDR
data. Second section presents an overview of the previous works done and the
drawbacks of the existing studies. Section 3 summarizes the methodology of the
research conducted, and section 4 validate the results against the independent
data sources from the study area. Based on these findings, the study concludes
with a discussion of the limitations and applications of CDR data in future
studies.
2 Background and Related Work
Previous studies have used different methodologies to minimize the load shar-
ing effect. Basically there are two techniques that have been used as trajectory
smoothing and spatial clustering.
2.1 Trajectory Smoothing
In trajectory smoothing, the sequence of CDR within a certain time threshold
is taken into consideration and different smoothing or filtering algorithms were
taken into account to reduce the “jumps” in the location sequence. Speed based
filtering, time weighted smoothing and assigning a single medoid location to
records which are close by were different algorithms used in trajectory smoothing
to smooth the location sequence.
In speed based filtering a small trajectory of data points within five minutes
are inspected and any points which have irrational travel distance or travel speed
(more than 120 kmph) are removed from the database [9]. In the studies which
use time weighted smoothing, the preprocessing is initiated by smoothing the
positions independently for each user. In time weighted smoothing, the maximum
stay region size is set to d = 300m to approximate the area that might likely
be traversed on foot as part of an urban activity. Then the entire region is4 B. Ayesha et al.
divided into rectangular cells of size d/3. Then, all the stay points were mapped
and iteratively merge the unlabeled cell with the maximum stay-points and its
unlabeled neighbors to a new stay-region and labeled the stay regions [4].
In conclusion, the trajectory smoothing also has its own drawbacks. The
user visited locations are removed in the trajectory smoothing method which
minimize the possibility to identify exact locations of the users
2.2 Spatial Clustering
Spatial clustering is the other main technique that is used to remove the load
sharing effect. There the data points were clustered based on the spatial dis-
tribution without considering the temporal distribution of CDR. This process
allows to consolidate points that may represent the same location but, visited
in different days. Agglomerative [1] and leader clustering [3] are the two main
clustering techniques used for this categorization.
Both these methodologies have their own drawbacks. Initially the speed be-
tween two consecutive records were calculated using the time difference and the
distance parameter. The distance between two consecutive points is the Eu-
clidean distance. Then in speed based filtering of trajectory smoothing, only the
data within five minutes were inspected, where the travel speed considered is
120 miles per hour. But the speed should be sensitivity tested rather than using
a selected speed.
In trajectory smoothing the positions were smoothed based on a weight. The
positions were smoothed for all users based on their caller activities.
In spatial clustering, a stay-point is identified by a sequence of consecutive
cell phone records bounded by both temporal and spatial constraints. The spa-
tial constraint is the roaming distance when a user is staying at a location,
which should be related to the accuracy of the device collecting location data.
The temporal constraint is the minimum duration spent at a location, which is
measured as the temporal difference between the first and the last record in a
stay. In most of the studies that used spatial clustering techniques for the load
sharing removal, only the latitudinal and longitudinal locations were considered
without taking the number of caller activities in each location into consideration.
Leader clustering is one of the techniques used in spatial clustering, initially the
cell towers are sorted and one with the most counts is taken as the centroid
of the first cluster. Then, for each subsequent cell tower, it checks whether the
tower falls within a threshold radius of the centroid of any existing cluster. If it
does not, the tower becomes the centroid of a new cluster. If it does fall within
the threshold radius of an existing cluster, the algorithm adds the tower to the
cluster and moves the centroid of the cluster to be the weighted average of the
locations of all the cell towers in the cluster. Choosing a particular threshold ra-
dius around cell towers helps to equalize for the fact that in urban areas towers
might be as dense as 200 meters apart, while in suburban areas, a spacing of 1-3
miles are more common. These threshold values should be sensitivity tested and
validated with another data source, to be used in the studyUser Localization Based on Call Detail Record 5
Additionally, with respect to spatial clustering only the spatial behavior is
taken into account, without considering about the time factor. Specially the se-
quence of location visits were not considered. Other main limitation in literature
is the lack of models to minimize location error using label data.
In summary, There are three main influencing factors for the localization to
be stated as load sharing, signal strength of the cell tower and the frequency
of connecting to a particular tower. Existing studies has a gap where they have
not considered all these three factors together to remove the localization error.
Additionally this study combines with user profiling for the localization error
reduction in a novel manner.
3 Methodology
This section describes the overall research methodology that was carried out.
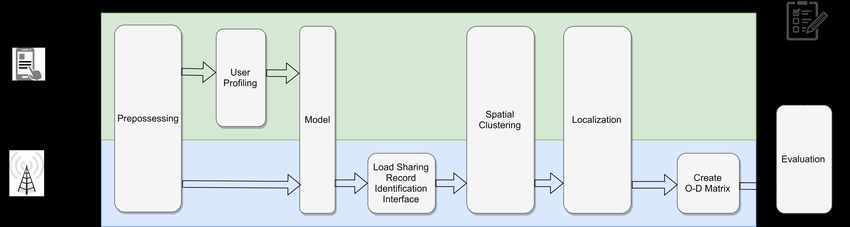
Each section below, addresses a component in the overall methodology. An
overview of the methodology proposed is illustrated in Fig. 2.
Fig. 2. Flow diagram for the overall methodology
3.1 Data
The study uses Call Detail Records of nearly 13 million SIMs from a mobile
operator in Sri Lanka. Data was provided for this research by LIRNEasia - a re-
gional ICT policy and regulation think-tank. Data is completely pseudonymized
by the operator, where phone numbers are present.
Study also use voluntarily collected CDR and GPS data in a pseudonymized
manner from an unbiased sample of mobile users. Data was collected through a
mobile application developed for Android devices and users could download the
mobile application from the Google play store. Data was collected from more
than 700 users for a period of three months from 21-03-2018 to 21-06-2019.
This app collects socioeconomic data, CDR data, signal strength data as well
as travel data. For validation purposes, the App also collects signal strength
and GPS data every 10 minutes and it identifies user’s travelling movements6 B. Ayesha et al.
automatically through GPS data and prompts the user to indicate their travel
purpose.
The main data source used for the purpose of validation is obtained from
transportation-related data collected from household surveys within the Western
Province of Sri Lanka, which was conducted as part of the CoMTrans study [5].
The Household Visit Survey (HVS) data provide transportation information,
including social-demographic records, travel time, trip purposes, travel modes,
etc. which can be used for validating the results from CDR trip analysis.
3.2 Preprocessing
Preprocessing is done using two filtering techniques. First filter is used for the
removal of atypical users. As an example users with low caller activity levels,
users with low appearance within the study area (e.g. tourist, visitors). Most of
the previous researchers on this was done based on call activity count (CAC). It
is required to remove the infrequently visited users who are entering the focused
research area, but the removal should be done based on their spatial behaviour
but not considering the caller activity counts. Our main approach is to use a
filter based on spatial behavior, to filter the users. Shannon Entropy is used for
the analysis of user’s spatial activities.
N
X
H=− Pi log2 Pi (1)
i=1
In the Shannon entropy equation, P refers to the probability that an activity
was observed at location i from the set of N locations that the user visits. Number
of locations appeared directly affect the behavioral measure. When the total
number of locations appeared increase the appearance probability of locations
increase by which the entropy value increase. The spatial behavior of 80% of the
users are more of a homogeneous behavior compared to others.
Then the Western Province users were filtered since the study area is the
Western Province of Sri Lanka.
3.3 User Profiling
One of the major drawbacks of previous research studies is that they consider
all users as a single group and use the same model parameters for all users.
Especially, when considering mobility patterns at individual level, initially it
is essential to profile users based on their socio-economic parameters. Since the
travelling behaviour of people highly depend on their socio-economic parameters
such as occupation, age, income and etc. As an example, for a public sector
worker the general working hours are between 8.30 AM to 4.30 PM and do not
work during weekends. But an employee in the private sector may work beyond
4.30 PM and also can appear in work locations during weekends. The behavior of
a shift worker or a school worker might be completely different to this. A school
employee generally work from 7.30 AM - 1.30 PM but a shift worker may beUser Localization Based on Call Detail Record 7
employed in the night. Hence the behavior can be completely different to each
other. Considering the age, a student’s travelling pattern cannot be expected
from a retired adult and income also has a significant influence on the travelling
patterns.
Study selected top features for user profiling based on correlation analysis.
The identified features are as follows.
– Call frequency for each hour
– Distance for each hour
– Appeared cell frequency
– Appearance in weekday or weekends
The study uses several classification methods such as Nearest Neighbor, Ran-
dom Forest, Neural Networks and Support Vector Machine for the data collected
from mobile app. Since the dataset has some class imbalance problem, study used
SVM weighted classes method (SV MW C ). Then the same models were used to
classify the main CDR dataset, as the next step.
3.4 Load Sharing Record Identification Interface
Main aim of this section is the identification of Load sharing records. Initial
attempt was to use a speed based filtering method. In speed based filtering a
small trajectory data within the corresponding time are inspected and any points
which have irrational travel distance or travel speed are labeled as load shared
record CDRs. Then the speed is calculated based on two consecutive CDRs for
each user and a speed filter was added. This methodology tries to identify the
jumps between location sequence.
The speed limit was selected as 120 kmph based on previous studies. But the
results were not as expected. In this method precision is good but recall is very
low. In other words, the majority of the records which were categorized as load
shared record are actually load shared records. But that method missed a lot of
load shared records.
Then the study attempts on a new approach to identify load shared records.
Main drawback of the predefined speed based filtering method is that speed of the
vehicle in the road is not always equal. For an example in the morning 7am-9am
average vehicle speed is low compared to 8.30pm-10pm. Generally the speed in
one of the main corridors to Colombo at peak hours is 6 kmph but during off peak
hours the speed can be high up to 100 kmph. Vehicle speed also depends on the
geographical area. In urban cities the vehicle speed is slow compared to remote
areas. Our approach is to address both scenarios. Speed limit data was taken
from previous transportation origin-destination surveys. Since the speed limit is
based on the time, time frames were defined for our study as, 07:00-09:00, 09:00-
12:00, 12:00-13:00,13:00-16:30,16:30-19:00,19:00-22:00 and 22:00-07:00. Then the
study area is divided based on the Divisional Secretariat Divisions (DSD)and the
average speeds were taken based on separate time windows. CDR were filtered
based on the θ values, which represent in kmph, θ = [0, 5, 10, . . . , 200] Then8 B. Ayesha et al.
the records were evaluated and labeled as Load shared records using GPS data
which represent actual movements. Based on this result, the same process was
carried out for the main dataset.
3.5 Reduce Localization Error
Main part of this research is the identification of the user’s location. CDR data
was clustered based on their spatial behaviour to identify different regions of
stay for the user (Stay location clusters). The study use DBSCAN to perform
the clustering.
Majority of the previous research considered call frequency related data only.
However, that does not provide acceptable results. Therefore, this study propose
a new approach to minimize user’s localization error. It is noted that the assign-
ment of a cell tower to a user depends, among others, on user’s location, signal
strength and the call traffic load of the particular cell tower. Following three
factors were consider to assign locations for users.
– Load sharing records
– Signal strength of the particular cell tower
– Number of days appeared in the particular cell tower.
Consider the following scenario. Assume that User X is connected with cell
towers A, B, C, D with an equal number of caller activities. When the weights
are based on the caller activities, then the user’s location should be the centroid
of the considered 4 locations within the particular time period (Fig. 3).
Fig. 3. Use locations based on the Fig. 4. Use locations based on the sig-
number of appearances days nal strength
In order for the above to happen the signal strength of the cells should be
equal to each other. But when the signal strength data of cell towers is taken
as the weight, the position of the centroid will change from that of the position
taken from caller activity levels as shown in the Fig. 4.
Similarly, based on Load shared record frequency, it is possible to assign a
location to the particular user.User Localization Based on Call Detail Record 9
The study collects signal transmit power for each cell in the study area,
and it is used as a measurement to rank the power of connecting to users. Pi
demonstrate the signal transmitting power of the ith cell.
Based on those factors, the weight is given by Equation 2. For a given cell i,
Load sharing records, signal transmit power and Number of appearances days
are denoted by Li , Pi , Ci , respectively for particular user.
1
Wi = αLi + β + γCi (2)
Pi
Then, the Li , Pi and Ci values were scaled as in Equation 3.
1
0 ≤ Li ,, Ci ≤ 1 (3)
Pi
α, β, γ are distinct weights calculated for each user segmentation separately
within the range mentioned in the Equation 4.
0 ≤ α, β, γ ≤ 1 (4)
The study used weighted k-means++ algorithm to find the centroid of the
cluster using the weights given by Equation 2. Centroids are assigned as user
location for a given time.
Table 1. User profiling results comparison (P=Precision, R=Recall, F1=F1 Score)
Full-Time Part-Time
Student Housewife Retired Others
Model Employees Employees
P R F1 P R F1 P R F1 P R F1 P R F1 P R F1
RF 0.64 0.53 0.58 0.45 0.39 0.42 0.70 0.91 0.79 0.68 0.72 0.70 0.32 0.21 0.26 0.52 0.64 0.57
AN N 0.70 0.44 0.54 0.55 0.40 0.46 0.71 0.93 0.81 0.72 0.78 0.75 0.36 0.24 0.28 0.56 0.36 0.44
SV MW C 0.71 0.66 0.68 0.50 0.43 0.46 0.77 0.95 0.85 0.71 0.81 0.76 0.31 0.29 0.30 0.65 0.53 0.58
4 Results
Results of the User Profiling models are shown in Table 1. The SV MW C model
showed higher accuracy values for user profiling.
Then Load Sharing Record identification is evaluated. If the last recorded cell
tower changes without an actual movement of 100m of the user, study considered
that record as a load shared one. The result is shown in Table 2. Our approach
shows significant accuracy improvement, especially in recall.
To evaluate the Localization result, two approaches were used. First, result
were evaluated using mobile app data. To calculate home location error, initially
the user’s home location which is provided by the user was taken and compared
with the location predicted by our method. Fig. 5 indicates the generated re-
sults. The same process was carried out for the work location identification of10 B. Ayesha et al.
users and the generated results are shown in Fig. 6. Our proposed methodology
outperforms existing results in majority of the population. In the study work
location was more accurately identify than the home location. The study reveals
that 70% (468) of the users are working in an urban area, but their home lo-
cations are in suburban areas. In urban areas cell tower density is high and, in
the suburban area cell tower density is low. Therefore, work location error is low
compared to the home location.
As the second approach to evaluate the Localization result, Origin-Destination
(O-D) matrices [10] were created from the large (13 million subscribers) CDR
dataset. Accordingly, the weekends and holidays were removed from the large
CDR dataset. Home activities are defined between 8PM and 5AM [6] and work
activities from 10am to 12pm and 1pm to 4pm [4]. Then the results were com-
pared with HVS O-D matrix data.
Table 3 indicates the O-D matrices derived from HVS data at district level.
This study has been done by covering the Western Province which consists of
three districts namely Colombo, Gampaha, Kalutara. As an example cell 1 says
that 44% of users have both their home and work location at the Colombo
district, cell 2 says that 3% of users have their work location within Gampaha
and home location within the Colombo district.
Further Table 4 indicates the user localization based on the number of days
the cell tower was connected [3] derived from CDR dataset, which contain nearly
13 million users home-work location distribution. And this table also has the
same interpretation as in Table 3.
Table 5 indicates the user localization based on our proposed methodology,
which considers the user’s Load shared record, Signal strength and Number of
appearance days and also has the same interpretation as in Table 3.
In order to statistically compare the extracted O-D matrices with ground
truth (HVS data), study used the Pearson’s chi-squared test given by Equation 5.
n
X (Oi − Ei )2
χ̃2 = (5)
i=1
Ei
χ refers to the Pearson’s cumulative test statistic, where the Ei denotes
the Expected value, Oi the Observation value and n is the number of cells in
the table. Based on Chi-squared test values, p value for Table 4 is 0.64 and
for Table 5 is 0.88. Our approach outperforms the result, and it shows similar
outcomes based on the HVS dataset according to the statistic.
Table 2. Load sharing record identification results comparison
Method Precision Recall F1
Pre-define speed base filter 0.914 0.166 0.281
Our Method 0.864 0.728 0.790User Localization Based on Call Detail Record 11
100 100
80 80
Percentage of Population
Percentage of Population
60 60
40 40
Call-days based Method Call-days based Method
20 Our Approach 20 Our Approach
Error in Meters Error in Meters
0 0
0 2,000 4,000 6,000 8,000 0 1,000 2,000 3,000 4,000 5,000 6,000
Fig. 5. Home localization error Fig. 6. Work localization error
Table 3. Home work distribution - HVS data
Trip Attractors
Home/Work
Colombo Gampaha Kalutara
Colombo 44% 2% 1%
Trip Generators Gampaha 10% 27% 1%
Kalutara 4% 1% 10%
Table 4. Home work distribution - Call days based method
Trip Attractors
Home/Work
Colombo Gampaha Kalutara
Colombo 52% 2% 2%
Trip Generators Gampaha 12% 18% 1%
Kalutara 5% 1% 7%
Table 5. Home work distribution - Proposed methodology
Trip Attractors
Home/Work
Colombo Gampaha Kalutara
Colombo 44% 3% 2%
Trip Generators Gampaha 8% 30% 1%
Kalutara 1% 1% 10%
5 Conclusion
As mentioned in the previous studies, real time datasets such as mobile phone
traces provide rich information to support transportation planning and opera-
tion. Meanwhile, some related limitations should also be addressed when using
these datasets in mobility analysis. The most prominent outcome of this research
is the formulation of a methodology to reduce the error in localizing the user by
considering the load sharing effects of the CDR records and transmit power of
the cell towers. This has a significant effect on the travel conclusions obtained
from CDR data. The study identifies that there are different optimum speeds for12 B. Ayesha et al.
different geographical areas in separate time windows. Findings were validated
by comparing with the HVS data. Findings had a significant improvement after
reducing the localization error. An additional validation was done using volun-
tarily collected CDR data. Since the voluntarily collected data also contains GPS
data, it provides an accurate way to evaluate localization error. With this, the
load sharing effect can be identified easily and hence the accuracy of the findings
were also compared with the mobile application data.
Future work is possible through the use of Google traffic data and by setting
a speed limit based on the corridors and input load sharing filtering techniques,
which are computationally efficient and accurate in result acquisition.
Acknowledgment. The authors wish to thank the DataSEARCH Centre for
supporting the project which was partially funded by the Senate Research Coun-
cil under the grant number SRC/LT/2018/08 of the University of Moratuwa.
References
1. Hariharan, R., Toyama, K.: Project lachesis: parsing and modeling location histo-
ries. In: International Conference on Geographic Information Science. pp. 106–124.
Springer (2004)
2. Iqbal, M.S., Choudhury, C.F., Wang, P., González, M.C.: Development of origin–
destination matrices using mobile phone call data. Transportation Research Part
C: Emerging Technologies 40, 63–74 (2014)
3. Isaacman, S., Becker, R., Cáceres, R., Kobourov, S., Martonosi, M., Rowland, J.,
Varshavsky, A.: Identifying important places in people’s lives from cellular network
data. In: International Conference on Pervasive Computing. pp. 133–151. Springer
(2011)
4. Jiang, S., Fiore, G.A., Yang, Y., Ferreira Jr, J., Frazzoli, E., González, M.C.: A re-
view of urban computing for mobile phone traces: current methods, challenges and
opportunities. In: Proceedings of the 2nd ACM SIGKDD international workshop
on Urban Computing. p. 2. ACM (2013)
5. JICA: Urban transport system development project for colombo metropolitan re-
gion and suburbs (2014)
6. Kung, K.S., Greco, K., Sobolevsky, S., Ratti, C.: Exploring universal patterns in
human home-work commuting from mobile phone data. PloS one 9(6), e96180
(2014)
7. Tiru, M.: Overview of the sources and challenges of mobile positioning data for
statistics. In: Proceedings of the International Conference on Big Data for Official
Statistics, Beijing, China. pp. 28–30 (2014)
8. Vieira, M.R., Frı́as-Martı́nez, E., Bakalov, P., Frı́as-Martı́nez, V., Tsotras, V.J.:
Querying spatio-temporal patterns in mobile phone-call databases. In: Mobile Data
Management (MDM), 2010 Eleventh International Conference on. pp. 239–248.
IEEE (2010)
9. Wang, M.H., Schrock, S.D., Vander Broek, N., Mulinazzi, T.: Estimating dynamic
origin-destination data and travel demand using cell phone network data. Interna-
tional Journal of Intelligent Transportation Systems Research 11(2), 76–86 (2013)
10. Zhang, Y., Qin, X., Dong, S., Ran, B.: Daily od matrix estimation using cellular
probe data. In: 89th Annual Meeting Transportation Research Board. vol. 9 (2010)You can also read