Faces Divulge the origins of caribbean prehistoric inhabitants - Nature
←
→
Page content transcription
If your browser does not render page correctly, please read the page content below
www.nature.com/scientificreports
OPEN Faces Divulge the Origins of
Caribbean Prehistoric Inhabitants
1,2*
Ann H. Ross , William F. Keegan3, Michael P. Pateman4 & Colleen B. Young5
The origins of the first peoples to colonize the Caribbean Islands have been the subject of intense debate
for over 30 years. Competing hypotheses have identified five separate migrations from the mainland
with a separate debate concerning the colonization of The Bahamas. Significant differences in the facial
morphology of the pre-Columbian inhabitants of Hispaniola and Cuba led to the present study of Lucayan
skulls from The Bahamas. The goal was to determine which group the native Lucayans more closely
resembled to resolve this long-standing dispute. The results indicate that they are related to groups from
Hispaniola and Jamaica and not to Cuban inhabitants. This study clarified the larger picture of Caribbean
migrations and supports evidence for a Carib invasion of the Greater Antilles around AD 800.
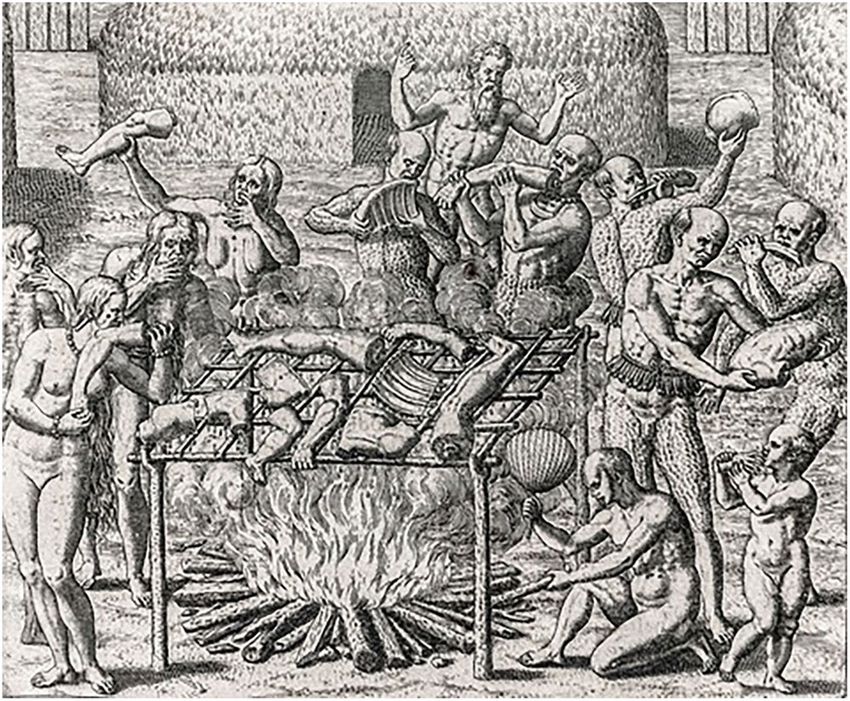
The defining image of the Columbian encounter is ravenous cannibals descending upon unsuspecting peaceful
Arawak villages, whence they ate the men and took the women as wives (Fig. 1). From the moment he landed
on the first Bahamian island – Guanahaní – Columbus wrote, “I saw some who had marks of wounds on their
bodies and I made signs to them asking what they were, and they showed me how people from other islands
nearby came there and tried to take them, and how they defended themselves; and I believed and believe that
they come from Tierra Firme to take them captive”1. This is the first of ten allusions to Carib raids during the first
voyage2. Archaeologists have questioned this assertion based on the possible confusion of Caribe and Caniba (the
Asiatic subjects of the Grand Khan), content with the knowledge that the true Caribs never advanced further than
Guadeloupe in the Lesser Antilles3,4.
The Caribbean archipelago extends almost 3,000 km from the mouth of the Orinoco River in northern South
America to Florida and the Yucatán enclosing the Caribbean Sea with three major island groupings consisting of
the Lesser Antilles, the Greater Antilles, and The Bahamas5. The Caribbean’s stepping stone arrangement facili-
tated human and animal dispersals into the islands throughout prehistory.
The first and still popular framework for the peopling of the Caribbean by small groups of hunters, fishers,
and foragers most likely infiltrated the archipelago by canoe was based on technological differences4,6,7 that iden-
tified a “Lithic Age” (flaked-stone technology) migration as crossing the Yucatán passage from Central America
to Hispaniola and Cuba between 4000–5000 BC, an “Archaic Age” (ground-stone technology) migration from
Trinidad to the Greater Antilles through the Lesser Antilles around 2500 BC, and a “Ceramic Age” (Saladoid
series pottery) migration from the mouth of the Orinoco River (Venezuela/Guiana) through the Lesser Antilles
to Puerto Rico around 500 BC. After reaching Puerto Rico there was a 1,000-year hiatus before Ceramic Age
expansion resumed with the colonization of Hispaniola, Jamaica, Cuba, and The Bahamas.
To date, the different proposed migration routes have been largely based on archaeological evidence of sim-
ilarity and dissimilarity of pottery styles, which has provoked heated debate within the discipline3,4,7–13. The
Bahamas was the last of the Caribbean archipelagoes to be settled by humans. The earliest evidence of human
arrival is the well-dated Coralie site on Grand Turk, Turks & Caicos Islands indicate initial occupation in the
early 8th century AD14. Pottery analysis showed different materials mixed in the clay that was not endemic to the
Bahamas suggest it was brought to the Turks & Caicos from Hispaniola15. This evidence supported the conclusion
that the archipelago was first colonized by people from Hispaniola16,17. The name originally used by the Spanish
to describe the Bahamas was used to argue that the Lucayans originally came from Cuba18. Early radiocarbon
dates obtained from three Lucayan sites in the central Bahamas (i.e., New Providence, northern Eleuthera, and
San Salvador) supported this Cuban connection19,20.
Ancient DNA data suggests a northern South American origin for initial dispersal into the Caribbean21 yet it
is based on a single individual and should be viewed with caution. Craniofacial morphology (e.g., craniometrics)
1
Department of Biological Sciences, North Carolina State University, Raleigh, NC, 27695, USA. 2Research Associate,
National Museum of Natural History, Smithsonian Institution, Washington, DC, 20013, USA. 3Curator of Caribbean
Archaeology, Florida Museum of Natural History, University of Florida, Gainesville, FL, 32611, USA. 4Director, Turks
& Caicos National Museum, Grand Turk, Turks & Caicos Islands, Turks, USA. 5Department of Anthropology, University
of Missouri, Columbia, MO, 65203, USA. *email: ahross@ncsu.edu
Scientific Reports | (2020) 10:147 | https://doi.org/10.1038/s41598-019-56929-3 1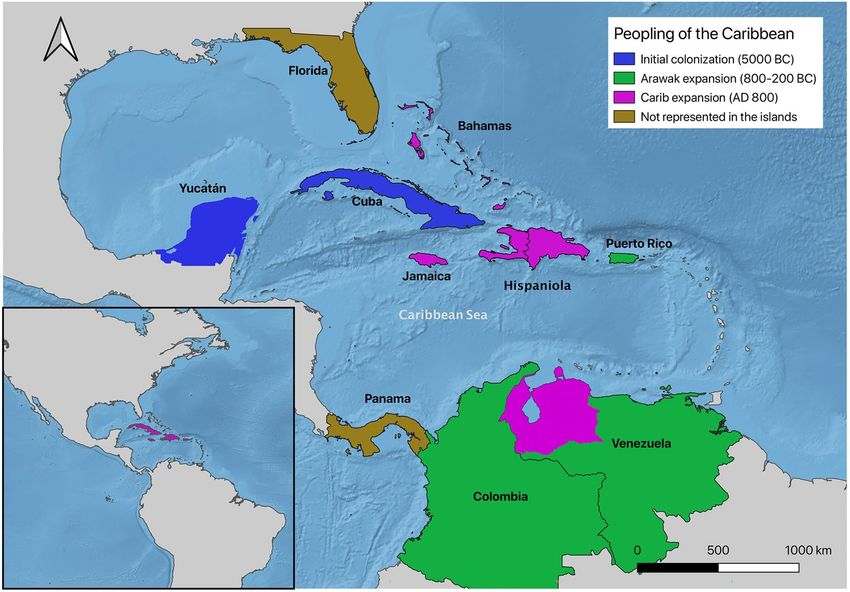
www.nature.com/scientificreports/                                                              www.nature.com/scientificreports

                           Figure 1. Cannibalism in Brazil by Theodor de Bry, 1596. [The author died in 1598, so this work is in the public
                           domain in its country of origin and other countries and areas where the copyright term is the author’s life plus
                           100 years or less].

                           Figure 2. Sixteen homologous anatomical landmarks used in this study.

                           has been empirically demonstrated as a suitable genetic proxy for examining population structure as cranial data
                           have a greater spatial and temporal coverage than ancient DNA from pre-Contact New World populations22,23.
                           The cranial base, facial and neurocranial modules are integrated systems that maintain stability throughout the
                           whole complex during growth and development with the neurocranium being more susceptible to phenotypic
                           plasticity23,24.
                               Studies of population diffusion into the Caribbean have been neglected until recently, partly due to the scarcity
                           of available skeletal material resulting from unfavorable preservation environments and thus, there are signifi-
                           cant gaps in knowledge22,25–29. Here, we propose evidence for multiple dispersal events and ancestral origins of
                           Pre-Contact Caribbean Amerindians employing facial morphology as a genetic proxy.

                           Results
                           Three migration routes are evident in a sample of 103 individuals from 10 localities using 16 homologous ana-
                           tomical landmarks (Fig. 2, Tables 1 and 2, see Materials and Methods section; raw coordinate data are available
                           in the Supplementary File).

                           Geometric morphometrics. The Procrustes ANOVA results show significant group variation for shape
                           (F (369, 3813) = 2.27, p =  < 0.0001) and centroid size (F(9,93) = 737.92, p =  < 0.0001). The canonical variates
                           analysis (CVA) produced nine significant canonical axes and the eigenvalues indicate that 35% of the shape vari-
                           ation is accounted for on the first canonical axis, 21% on the second canonical axis, and 14% on the third axis for
                           70% of the total shape variation (Fig. 3). The Mahalanobis distance (D) matrix, a measure of biological distance,

Scientific Reports |   (2020) 10:147 | https://doi.org/10.1038/s41598-019-56929-3                                                             2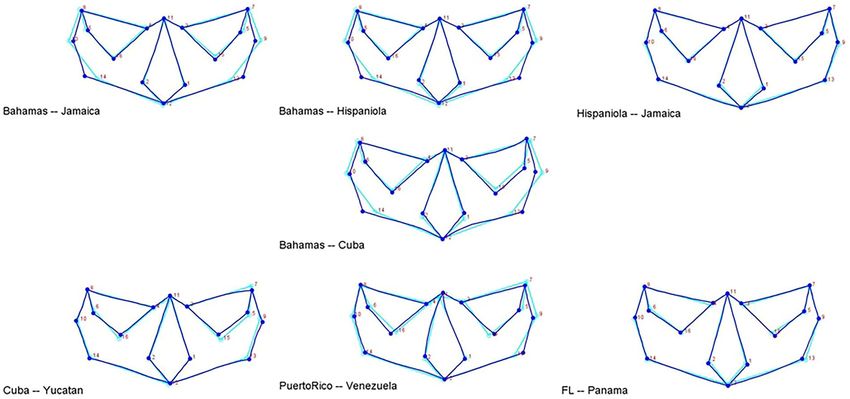
www.nature.com/scientificreports/                                                                           www.nature.com/scientificreports

                            1, 2 Alare right/left                    11 Nasion
                            3, 4 Dacryon right/left                  12 Subspinale
                            5, 6 Ectochonchion right/left            13, 14 Zygomaxillare right/left
                            7, 8 Frontomalare temporale right/left   15, 16 Zygoorbitale right/left
                            9, 10 Jugale right/left

                           Table 1. Homologous anatomical landmarks included in this study.

                            Sample                    N     Provenience
                            Bahamas                   8     (ca. 1000–1500 A.D.) National Museum of the Bahamas’ Antiquities
                            Colombia                  5     Pre-Contact, American Museum of Natural History
                            Cuba                      21    (ca. 800–1500 A.D.) Museo de Montane, Havana, Cuba and National Museum of Natural History
                            Hispaniola                15    (ca. 800–1500 A.D.) National Museum of Natural History
                            Jamaica                   7     (ca. 800–1500 A.D.) National Museum of Natural History
                            Yucatan, Mexico           12    Chichen-Itza, Peabody Museum, Harvard
                            Panama                    6     Pre-Contact, Patronato Panama Viejo, Panama
                            Puerto Rico               10    (ca. 800–1542 A.D.) American Museum of Natural History
                            Florida                   15    (ca. 1300–1400 A.D.) American Museum of Natural History
                            Venezuela                 4     Pre-Contact, American Museum of Natural History

                           Table 2. Sample composition and provenience.

                           Figure 3. Scatter plots of the first three canonical variates (accounting for 70% of the total shape variation).

                           shows that the two closest groups are Hispaniola and Jamaica, followed by Puerto Rico and Venezuela, Hispaniola
                           and the Bahamas, with the most dissimilar groups being Panama and The Bahamas, Hispaniola, and Jamaica.
                           (Table 3).
                               Morphological variation is illustrated via wireframe graphs that depict the magnitude and direction of shape
                           change between two mean configurations generated using the discriminant function analysis (Fig. 4). The groups
                           illustrated were selected according to the clusters produced by the hierarchical cluster analysis outlined in the next
                           section. The variation between The Bahamas and Hispaniola and Jamaica samples primarily involves those land-
                           marks related to facial breadth. The variation between The Bahamas and Cuba includes overall facial morphology,
                           while the variation between Cuba and the Yucatán is associated with orbital shape. The variation between Puerto
                           Rico and Venezuela is also linked to orbital shape (e.g., zygoorbitale is more inferiorly and laterally placed in the
                           Puerto Rican sample). The global morphological similarity is evident between Hispaniola and Jamaica and like-
                           wise, between the samples from Florida and Panama.

                           Hierarchical cluster analysis. The dendrogram produced by the agglomerative cluster analysis using the
                           Mahalanobis distance matrix shows four distinct clusters (Fig. 5): (1) Panama/Florida, (2) Yucatán/Cuba (initial
                           colonization), (3) Colombia/Venezuela/Puerto Rico (Arawak expansion), and (4) Hispaniola/Jamaica/Bahamas
                           (Carib invasion). The constellation plot clarifies the biological relationship among the clusters and shows that
                           Cuba clusters with the Yucatán sample, which is twice as distant as the other two Caribbean clusters (purple and
                           teal) are to each other (Fig. 6).

Scientific Reports |   (2020) 10:147 | https://doi.org/10.1038/s41598-019-56929-3                                                                       3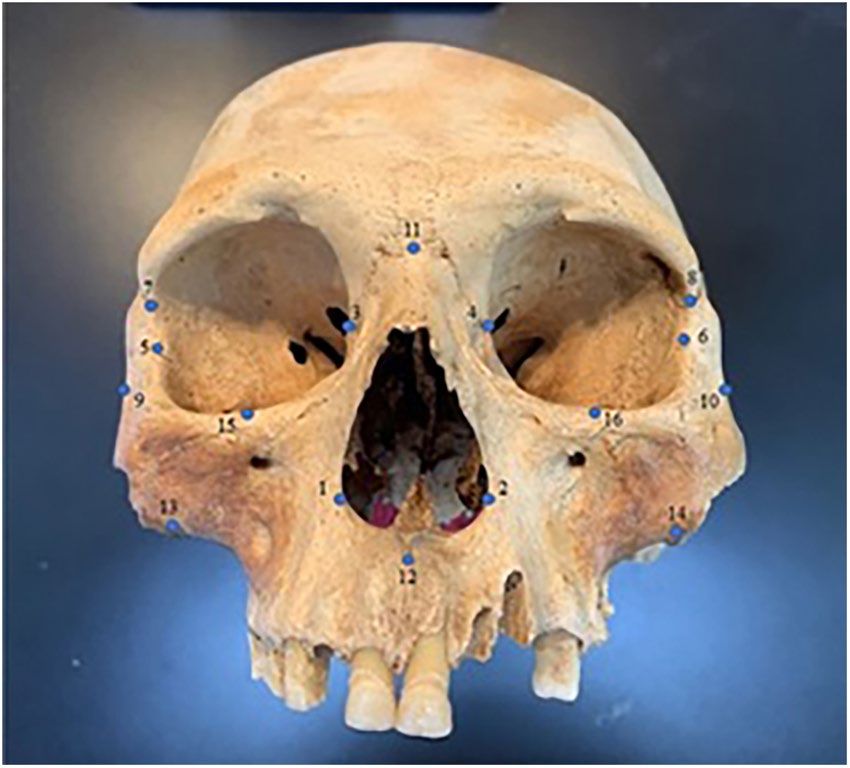
www.nature.com/scientificreports/                                                                 www.nature.com/scientificreports

                                         Bahamas   Colombia   Cuba     Florida   Hispaniola   Jamaica   Panama   PuertoRico   Venezuela   Yucatan
                            Bahamas      0
                            Colombia     8.7213    0
                            Cuba         7.0197    7.2287     0
                            FL           7.4521    8.0386     6.584    0
                            Hispaniola   4.9188    6.5737     6.5664   8.2246    0
                            Jamaica      6.2524    7.8868     8.19     8.9742    3.9442       0
                            Panama       9.6924    8.0138     8.3187   6.1025    9.6082       9.5254    0
                            PuertoRico   6.9211    6.5522     6.9993   7.5231    5.7005       5.0428    7.4326   0
                            Venezuela    8.0587    6.2165     8.0882   8.7086    6.4041       6.2769    8.5496   4.8494       0
                            Yucatan      7.1968    7.2409     6.8812   6.6578    7.0205       8.2154    8.0951   6.324        7.106       0

                           Table 3. Mahalanobis distances showing the shape change between all pairs of groups. All groups were
                           significantly different with p-values ranging from 0.01 to < 0.0001 level based on 10,000 permutations.

                           Spatial analysis. The spatial autocorrelation for shape based on the first principal component and centroid
                           size does not show a spatial association for morphological shape but does show a strong positive spatial asso-
                           ciation for centroid size (Table 4). The correlogram (Moran’s I by kilometers) for shape (PC1) shows no spatial
                           structure while the correlogram for centroid size shows the autocorrelations decreasing with increasing distance
                           (Fig. 7a,b). However, the decrease is not monotonic.

                           Discussion
                           Because on average, phenotypic traits and global patterns of craniometric variation are consistent with neutral
                           evolutionary forces such as genetic drift and flow, inferences can be made regarding past population history and
                           structure including origins and demic diffusion using craniofacial morphology30. In a recent regional approach
                           of pre-Contact New World craniofacial variation, a strong positive spatial association on morphology was found
                           for both shape and size suggesting that these New World Amerindians were heterogeneous, which is consistent
                           with an isolation-by-distant model after initial diffusion22. The results of the present study, per contra, show
                           that Caribbean Amerindians were not spatially patterned (i.e., for shape, Fig. 6a) suggesting homogeneity rather
                           than heterogeneity of the populations. Population homogeneity can arise by the migration of cohesive demes (or
                           breeding populations) who are genetically different that settles in an area within the local population31. And while
                           a significant spatial pattern (Table 4) was observed for centroid size, it did not show a monotonic decrease with
                           distance or a clinal pattern (Fig. 6b) as would be expected under an isolation-by-distance model similar to kin-
                           ship32. The morphological variation and similarity and spatial patterning observed in this study reasonably reflect
                           repeated population migrations and expansions by various groups from different directions.
                               Contacts between Florida and the islands have long been proposed33–35 as have connections between the
                           Isthmo-Colombian region36. However, the individuals from Florida and Panama in our sample show no clear
                           relationship with individuals from the islands. Archaeological evidence documents a strong relationship between
                           Venezuela and Puerto Rico beginning, at least, with the movement of Saladoid pottery into the islands between
                           800 and 200 BC. Our data confirm a biological relationship between individuals from Venezuela and Puerto
                           Rico. However, the movement of peoples between the islands and mainland, and between the islands aligned
                           from Trinidad to Puerto Rico, is far more complicated than origins alone can resolve3. Similarities in stone-tool
                           technology observed in Belize and Cuba have been used to identify the Yucatán Passage as the first crossing of
                           humans from the mainland to the islands37,38. Our data support this association, especially given the significant
                           differences between individuals from Cuba and those from other islands in the Greater Antilles. Differences in
                           facial morphology between Cuba and The Bahamas further support that the Lucayans did not originate in Cuba.
                           The earliest Ceramic Age settlements on Hispaniola and Jamaica are dated to around AD 6003. They are few
                           in number, widely scattered, and are recognized by the presence of “redware” pottery, associated with Archaic
                           Age communities2. Meillacoid style pottery appears suddenly in Hispaniola around AD 800 and was brought to
                           Jamaica (circa AD 900) and The Bahamas (circa AD 1000) during population expansion into essentially unoc-
                           cupied territories. Meillacoid pottery also reaches eastern Cuba around AD 100039. Diffusion into Cuba is dif-
                           ferent because it reflects the infiltration of long-established Archaic Age communities, which would explain why
                           individuals in Cuba are morphologically different from their neighbors. Meillacoid pottery is identical to the
                           pottery associated with the Carib expansion13. Commencing in the northwestern Amazon basin around AD 500,
                           the timing is appropriate for the sudden appearance around AD 800 of this new pottery style in Hispaniola10,11.
                           Their arrival clarifies why population expansion suddenly resumed after a 1,000-year hiatus. The Carib invaders
                           were on the move, as attested to their rapid expansion across South America and also resolves Columbus’ often
                           perplexing descriptions of fierce raiders in The Bahamas, Jamaica, and western Hispaniola. Raiders that Las Casas
                           would identify in a marginal note to Columbus’ Diario as “Caribes”1.
                               Genetic evidence eventually may help to verify or refute our proposed Carib migration hypothesis. However,
                           there are currently three main problems. First, too few studies have been completed, although we would note that
                           our Bahamas samples are part of an ongoing study of genetic relationships in the circum-Caribbean. Second,
                           community-level identifiers are not yet available, it is difficult to evaluate the impacts of admixture over time21,40,
                           and a high degree of genetic variability has been reported for the northwest Amazon homeland of the Carib
                           migrants41,42. Third, previous studies have looked only at the two generally accepted Archaic Age and Arawak/

Scientific Reports |   (2020) 10:147 | https://doi.org/10.1038/s41598-019-56929-3                                                                   4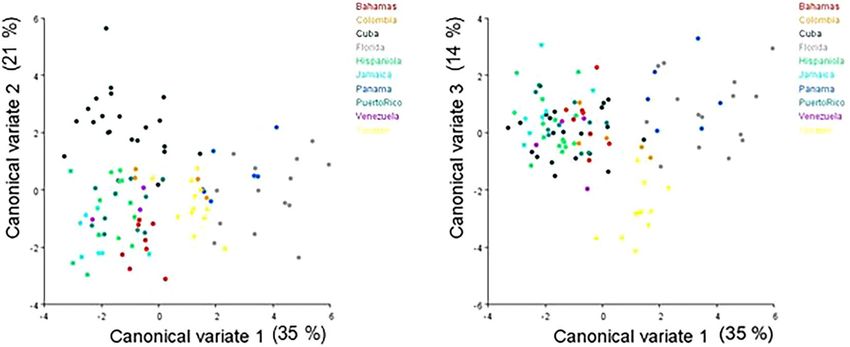
www.nature.com/scientificreports/                                                              www.nature.com/scientificreports

                           Figure 4. Wireframes showing the direction and shape change between one consensus configuration and the
                           other showing facial breadth variation among The Bahamas, Hispaniola, and Jamaica samples, the variation
                           between Cuba and the Yucatán, which is associated with orbital shape. The variation between Puerto Rico and
                           Venezuela is related to orbital shape. And the global morphological similarity is evident between Hispaniola and
                           Jamaica and between the samples from Florida and Panama.

                           Figure 5. Dendrogram produced from the hierarchical cluster analysis showing 4 clusters. One cluster (purple)
                           groups Hispaniola, Jamaica, and the Bahamas samples. The second cluster (teal), groups Puerto Rico, Venezuela,
                           and Colombian samples. The third cluster groups Cuba and Yucatan and the fourth cluster groups Florida and
                           Panama.

                           Taíno expansions, with some reference to the centuries later Carib migration into the Lesser Antilles27. If future
                           studies do not look for Carib influences, they will produce incomplete results.
                              Nevertheless, several studies support our conclusions. The DNA analysis of Saladoid individuals strongly sug-
                           gest a common origin and genetic continuity over time27, although genetic contributions in Puerto Rican individ-
                           uals that are more closely related to northwestern South America has been recognized40; and the study of dental
                           morphology identified a distinct Cuban cluster25. These results independently confirm the Puerto Rico-Venezuela
                           and Cuba-Yucatán clusters identified here. Finally, “marked haplogroup variation seems to be present among
                           the three neighboring Caribbean islands (Puerto Rico, Hispaniola, and Cuba),” such that colonization of the
                           Caribbean was mainly due to successive migration movements from mainland South America in different time
                           periods26. Haplogroup diversity among the three islands and successive waves of migrations are exactly what our
                           data predict. Finally, guinea pigs (Cavia porcellus) first appeared in the Antilles “sometime after AD 500,” and
                           their origins were genetically traced to northwestern South America43. Their translocation occurred at the same
                           time and from the same place that we propose for the Carib expansion into the Caribbean islands.
                              The reasons that most archaeologists failed to make this connection is that Rouse4 was adamant that there
                           was only one Ceramic Age population expansion, archaeologists were fixated on the shortest geographical water
                           crossings, especially the “stepping-stone” Lesser Antilles44, and interest in Island Caribs was focused on the 17th
                           century testimony of French missionaries living in the eastern Caribbean. It is only in the past decade that archae-
                           ologists have recognized the pre-Columbian capacity to directly cross the Caribbean Sea3,28,45. Looking at faces,
                           instead of islands, we see three distinct populations from three distinct places (Fig. 5). The first was the initial
                           peopling of Cuba and the northern Antilles across the Yucatán Passage around 5000 BC. Next was the arrival of

Scientific Reports |   (2020) 10:147 | https://doi.org/10.1038/s41598-019-56929-3                                                            5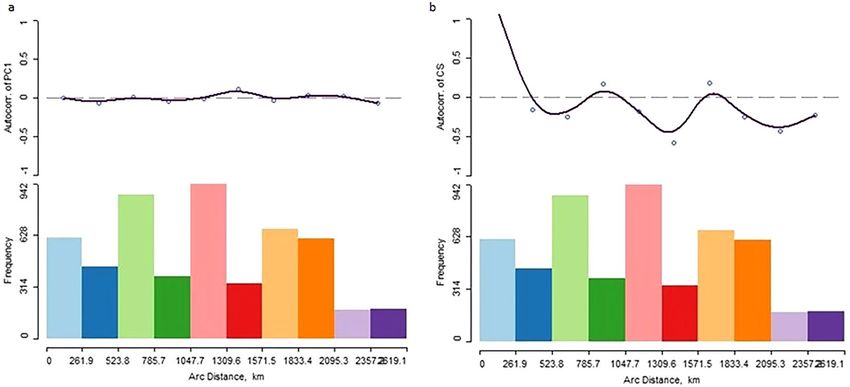
www.nature.com/scientificreports/                                                                  www.nature.com/scientificreports

                           Figure 6. The constellation plot, which arranges the samples as endpoints, was also produced by the
                           hierarchical cluster analysis. The length of a line between cluster joins represents the distance between the
                           cluster joins. The plot illustrates that the most distinct groups are Florida and Panama and shows that this
                           cluster is the most distant from the clusters on the lower half of the plot (purple and teal) and the cluster on the
                           upper half (blue) of the plot is about the same distance from the Panama/Florida cluster as it is from the clusters
                           on the lower half of the plot.

                           Figure 7. Correlograms for PC1 (a) and centroid size (b) depicting the lack of spatial autocorrelation for shape
                           and a non-monotonic decrease in centroid size with increasing distance.

                            Variable     Coefficient    Observed      Expected      Std Dev   Z          Pr > Z
                                         Moran’s I      −0.0022       −0.0098       0.0288    −0.264      0.7920
                            PC1
                                         Geary’s c        0.6921       1.00000      0.2968    −1.037      0.2995
                                         Moran’s I        1.1458      −0.0098       0.0366        31.5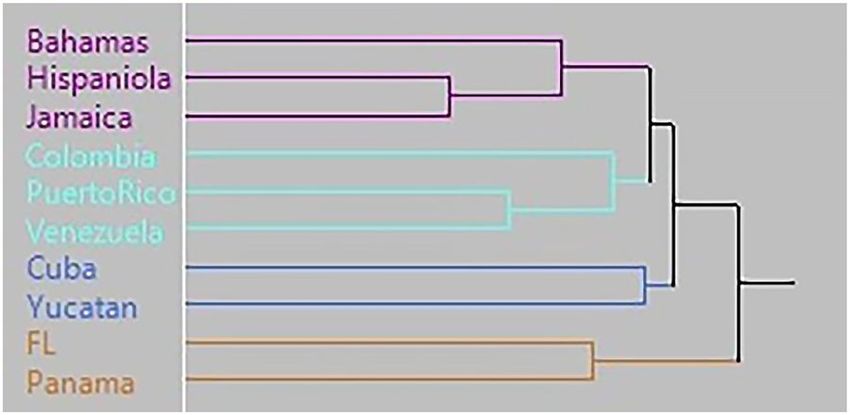
www.nature.com/scientificreports/                                                               www.nature.com/scientificreports

                           Figure 8. Proposed new three migration routes for the peopling of the Caribbean. [The map was generated
                           using public domain free raster + vector data from @naturalearth.com].

                           Arawak-speaking peoples in Puerto Rico from coastal Venezuela between 800 and 200 BC. Finally, Carib colo-
                           nists crossed the Caribbean Sea to arrive in Hispaniola around AD 800 and then continue their rapid expansion
                           into Jamaica and The Bahamas (Fig. 8). The evidence highlights a completely new perspective on the people and
                           peopling of the Caribbean.

                           Materials and Methods
                           Samples. Samples were selected for their availability at various museums and excellent preservation. The
                           samples used in this study total 103 individuals from the Caribbean and pre-Contact Amerindian samples from
                           Florida and Panama for comparison. The Caribbean samples from Jamaica, Hispaniola, and Puerto Rico have all
                           been temporally identified as Ceramic Age or Taíno of the Arawak language group. The sample from Cuba was
                           also archaeologically identified as Ceramic Age. The samples from The Bahamas have radiocarbon dates ranging
                           from AD1000-1500. Regrettably, there is little contextual information available for the other museum samples
                           from Venezuela, Colombia, and Florida. The sample composition and provenience are presented in Table 1.
                               For this project, we selected 16 homologous facial landmarks that should reflect the among group variation
                           (Table 2 and Fig. 1). Only facial landmarks were utilized because these populations practiced intentional cra-
                           nial modification and facial landmarks have been found not to be affected by cranial vault modification24,46. A
                           Microscribe G2X and i digitizer were utilized to obtain the x,y, and z coordinates for each anatomical landmark.
                           Due to the nature of prehistoric skeletal preservation from tropical areas, some of the sample sizes are small.

                           Geometric morphometrics. Because skeletal preservation is a problem in archaeological samples, data had
                           to be imputed in some of the individuals in order to increase sample sizes and retain maximum morphological
                           coverage but no more than 20% (or 3 landmarks) were imputed for any given individual. Data were imputed using
                           the software Morpheus et al. Java Edition using the GPA mean substitution function47. The mean substitution
                           method was selected over other methods for estimating missing data as it has been found to produce a better fit
                           to the original eigenvectors in human samples48.
                               Coordinate data must first undergo a Generalized Procrustes analysis or GPA transformation before sub-
                           sequent statistical analyses can be performed. GPA translates, rotates, and scales each specimen and brings all
                           individuals into a common coordinate system. Shape is defined as all of the geometric information that remains
                           after the effects of location, scale, and rotational effects are removed49,50. Centroid size is a measure of geometric
                           scale that is mathematically independent of shape50. The GPA procedure was performed using MorphoJ, which is
                           freely available for downloading and developed by Klingenberg51. A principal component analysis (PCA) of the
                           covariance matrix was conducted on the GPA transformed coordinates to reduce the dimensionality of the data
                           for subsequent multivariate statistical analyses50. To examine shape and size (e.g. Centroid Size) variation among
                           the groups, a Procrustes ANOVA was performed using principal component scores calculated from the PCA51.
                           A canonical variates analysis (CVA) (with 10,000 permutation rounds that resulted in 450,000 pairwise compar-
                           isons) was performed to account for the maximum amount of among-group variance relative to within-group
                           variance, which is also uncorrelated within and among groups. MorphoJ uses the standard equation for calculat-
                           ing the number of pairwise comparisons, which is k(k − 1)/2 with k = number of groups. CVA is used to examine

Scientific Reports |   (2020) 10:147 | https://doi.org/10.1038/s41598-019-56929-3                                                              7
www.nature.com/scientificreports/ www.nature.com/scientificreports
variation for more than two groups known a priori that presents the most variation with the least dimensions
possible51. Mahalanobis distance or generalized distance, which considers the correlations among variables when
computing the distance between means, was used to examine group relatedness (Table 3)51. To visualize morpho-
logical variation between the groups the Discriminant Function Analysis (DFA) was used that calculates separate
pairwise comparisons (with 1000 permutation runs) between groups using crossvalidation or n-1 method.
Hierarchical cluster analysis. An average linkage hierarchical (or agglomerative) cluster analysis was con-
ducted using the generalized distance matrix to examine group similarity and are commonly used in population
history and structure studies30,31. Hierarchical clustering begins with every sample in a single cluster, then in each
successive iteration, it merges the closest pair of clusters (distances between all pairs and averages all these dis-
tances) until all the data is in one cluster. The cluster analysis was performed in JMP Pro 1452. ®
Spatial analysis. Moran’s I, a product-moment coefficient, and Geary’s c, a distance-type coefficient, were
used to measure the spatial autocorrelation of shape (PC1) and centroid size. The autocorrelation is a measure of
genetic similarity between individuals with reference to geographic separation (latitude/longitude). This proce-
dure was performed using the Proc Variogram procedure in SAS 9.4, which reports Moran’s I and Geary’s c as a
standardized z-score with a positive autocorrelation indicated by a ZI > 0 and Zc < 053. Spatial correlograms were
computed for shape (PC1) and centroid size to evaluate the spatial autocorrelation coefficients for all pairs of
localities at specified geographic distance classes54. The correlograms were performed using the freeware software
GeoDa v1.14.055.
Data availability
Raw coordinate data (with accession codes) are available in the online version of this work.
Received: 16 August 2019; Accepted: 19 December 2019;
Published: xx xx xxxx
References
1. Dunn, O. C. & Kelley Jr., J. E. The Diario of Christopher Columbus’s first voyage to America. 1492–1493 (Univ. of Oklahoma Press,
Norman, 1989).
2. Keegan, W. F. Mobility and disdain: Columbus and cannibals in the land of cotton. Ethnohistory 62, 1–15 (2015).
3. Keegan, W. F. & Hofman, C. L. The Caribbean before Columbus (Oxford University Press, New York, NY, 2017).
4. Rouse, I. The Tainos (Yale University Press, New Haven, 1992).
5. Boomert, A. The Caribbean islands in The Cambridge World Prehistory 2 (ed. Renfrew, C. Bahn, P.) 1217–1234 (Cambridge
University Press, NY, 2014).
6. Rouse, I. Migrations in prehistory (Yale Univ. Pr, New Haven u.a, 1986).
7. Rouse, I. Prehistory in Haiti (New Haven, 1939).
8. Heckenberger, M. The Arawak diaspora: Perspectives from South America in The Oxford Handbook of Caribbean Archaeology 1 (ed.
Keegan, W. F., Hofman, C. L. & Rodríguez Ramos, R.) 111–125 (Oxford University Press, New York, 2013).
9. Willey, G. R. & Tulloch, A. An Introduction to American Archaeology (Prentice-Hall, Englewood Cliffs, N.J, 1971).
10. Veloz Maggiolo, M. Arqueología prehistórica de Santo Domingo (McGraw-Hill, Singapore [u.a.], 1972).
11. Zucchi, A. La Serie Meillacoide y sus Relaciones con la Cuenca del Orinoco, (Puerto Rico, 1985).
12. Steward, J. H. & Faron, L. C. Native Peoples of South America (McGraw-Hill, New York [u.a.], 1959).
13. Lanthrap, D. W. The Upper Amazon (Thames and Hudson, Great Britain, 1970).
14. Carlson, L. A. Aftermath of a feast: Human colonization of the southern Bahamian, Archipelago and its effects on the indigenous
fauna. Ph.D. dissertation, University of Florida (1999).
15. Cordell, L. A. paper presented at The 55th Annual Meeting of the Southwestern Archaeological Society (Greenville, NC, 1998).
16. Keegan, W. F. The People Who Discovered Columbus (Univ. Press of Florida, Gainesville u.a, 1992).
17. Sears, W. H. & Sullivan, S. D. Bahamas archaeology. Am. Antiquity 43, 3–25 (1978).
18. Granberry, J. Lucayan toponyms. J. Bahamas Hist. Soc. 13, 3–12 (1991).
19. Berman, M. J. & Gnivecki, P. L. The colonization of the Bahamas archipelago: a reappraisal. World Archaeol. 26, 421–441 (1995).
20. Gnivecki, P. L., Berman, M. J. & Pateman, M. P. In The Oxford Handbook of Caribbean Archaeology 1 (Oxford University Press, 2013).
21. Schroeder, H. et al. Origins and genetic legacies of the Caribbean Taino. P. Natl. Acad. Sci. USA 115(no. 10), 2341–2346 (2018).
22. Ross, A. H. & Ubelaker, D. H. Complex nature of hominin dispersals: ecogeographical and climatic evidence for pre-contact
craniofacial variation. Sci. Rep.-UK (2019).
23. von Cramon-Taubadel, N. Evolutionary insights into global patterns of human cranial diversity: population history, climatic and
dietary effects. J. Anthropol. Sci. 92, 43–77 (2014).
24. Ross, A. H. & Ubelaker, D. H. Effect of intentional cranial modification on craniofacial landmarks: a three-dimensional perspective.
J. Craniofac. Surg. 20, 2185–2187 (2009).
25. Coppa, A. et al. New evidence of two different migratory waves in the circum-Caribbean area during the pre-Columbian period
from the analysis of dental morphological traits. Crossing the Borders: New Methods and Techniques in the Study of Archaeological
Materials from the Caribbean. 195–213 (2008).
26. Lalueza‐Fox, C. et al. Mitochondrial DNA from Pre‐Columbian Ciboneys from Cuba and the prehistoric colonization of the
Caribbean. Am. J. Phys. Anthropol. 121(no. 2), 97–108 (2003).
27. Mendisco, F. et al. Where are the Caribs? Ancient DNA from Ceramic Period human remains in the Lesser Antilles. Philos. T. Roy.
Soc. B 370, no. 1660 (2015).
28. Ross, A. H. Cranial evidence of multiple population expansions in the Caribbean. Caribb. J. Sci. 40, 291–298 (2004).
29. Ross, A. H. Ubelaker, D. H. A morphometric approach to Taíno biological distance in the Caribbean in Island Shores, Distant Pasts:
Archaeological and Biological Approaches to the Pre-Columbian Settlement of the Caribbean. (ed. Fitzpatrick, S. M. Ross, A. H.)
108–126 (University Press of Florida, 2010).
30. Pietrusewsky, M. Traditional morphometrics and biological distance methods and an example in Biological Anthropology of the
Human Skeleton 3 (ed. Katzenberg, A. M. Grauer, A. L.) 547–591 (Wiley-Blackwell: NJ, 2019).
31. Sokal, R. R. The continental population structure of Europe. Annu. Rev. Anthropol. 20, 119–140 (1991).
32. Cavalli-Sforza, L. L., Menozzi, P. & Piazza, A. The History and Geography of Human Genes. (Princeton University Press NJ, 1994).
33. Gower, C. D. The Northern and Southern Affiliations of Antillean Culture (American Anthropological Assoc, Menasha, Wis, 1927).
34. Lovén, S. Origins of the Tainan Culture, West Indies (Elander, Göteborg, 1935).
Scientific Reports | (2020) 10:147 | https://doi.org/10.1038/s41598-019-56929-3 8www.nature.com/scientificreports/ www.nature.com/scientificreports
35. Rey Bettancourt, E. & García Rodríguez, F. Similitud entre los artifactos lithicos dellano oriente de Asia y de Cuba. Annuario De
Arqueología. 1–13 (1988).
36. Rodriguez Ramos, R. Isthmo-Colombian engagements in The Oxford Handbook of Caribbean Archaeology 1 (ed. Keegan, W. F.,
Hofman, C. L., Rodríguez Ramos, R.) 155–170 (Oxford University Press, 2013).
37. Wilson, S. M., Iceland, H. B. & Hester, T. R. Preceramic connections between Yucatán and the Caribbean. Lat. Am. Antiq. 9, 342–352
(1998).
38. Callaghan, R. T. Comments on the mainland origins of the preceramic cultures of the Greater Antilles. Lat. Am. Antiq. 14, 323–338
(2003).
39. Persons, A. B. Pottery, people, and place: Examining the emergence of political authority in Late Ceramic Age Cuba. Ph.D.
dissertation, University of Alabama (2013).
40. Nieves-Colón, M.A. et al. Ancient DNA reconstructs the genetic legacies of pre-contact Puerto Rico communities. bioRxiv. 765685
(2019).
41. Arias, L., Barbieri, C., Barreto, G., Stoneking, M. & Pakendorf, B. High‐resolution mitochondrial DNA analysis sheds light on
human diversity, cultural interactions, and population mobility in Northwestern Amazonia. Am. J. Phys. Anthropol. 165(no. 2),
238–255 (2018).
42. Callegari‐Jacques, S. M. & Salzano, F. M. Genetic variation within two linguistic Amerindian groups: Relationship to geography and
population size. Am. J. Phys. Anthropol. 79(no. 3), 313–320 (1989).
43. Kimura, B. K. et al. Origin of pre-Columbian guinea pigs from Caribbean archeological sites revealed through genetic analysis. J.
Archaeol. Sci. Rep. 5, 442–452 (2016).
44. Keegan, W. F. & Diamond, J. M. Colonization of islands by humans: A biogeographical perspective. Advances in Archaeol. Method
and Theory 10, 49–92 (1987).
45. Callaghan, R. T. Archaeological views of Caribbean seafaring in The Oxford Handbook of Caribbean Archaeology 1 (ed. Keegan, W.
F, Hofman, C. L., Rodríguez Ramos, R.) 283–295 (Oxford University Press, New York, 2013).
46. Cocilovo, J. A. Estudio de dos factores que influencian la morfologia craneana en una coleccion andina: El sexo y la deformacion
artificial. Revista del Instituto Antropologico 2, 197–212 (1975).
47. Morpheus et al. Java Edition, http:/morphlab.sc.fsu.edu/ (2013).
48. Arbour, J. H. & Brown, C. M. Incomplete specimens in geometric morphometric analyses. Methods Ecol. Evol. 5(no. 1), 16–26
(2014).
49. Kendall, D. G. The diffusion of shape. Adv. Appl. Probability. 9, 428–430 (1977).
50. Zelditch, M. L., Swiderski, D. L. & Sheets, H. D. Geometric Morphometrics for Biologists: A Primer (Academic Press, 2012).
51. Klingenberg, C. P. MorphoJ: an integrated software package for geometric morphometrics. Mol. Ecol. Resour. 11, 353–357 (2011).
®
52. JMP , Version 14.1. SAS Institute Inc., Cary, NC, 1989–2019.
53. SAS Institute Inc. SAS 9.4. SAS Institute Inc., Cary, NC, 1989-2019.
54. Sokal, R. R. & Uytterschaut, H. Cranial variation in European populations: A spatial autocorrelation study at three time periods. Am.
J. Phys. Anthropol. 74(no. 1), 21–38 (1987).
55. Anselin, L., Syabri, I. & Kho, Y. GeoDa: An Introduction to Spatial Data Analysis. Geogr. Anal. 38(no. 1), 5–22 (2006).
Author contributions
A.H.R. conceived of the idea, conceptualized the framework, carried out the statistical analysis, interpreted the
results; W.F.K. conceived of the idea, conceptualized the framework, interpreted the results, directed the project;
M.P.P. and C.B.Y. contributed to the final version of the manuscript and provided critical feedback.
Competing interests
The authors declare no competing interests.
Additional information
Supplementary information is available for this paper at https://doi.org/10.1038/s41598-019-56929-3.
Correspondence and requests for materials should be addressed to A.H.R.
Reprints and permissions information is available at www.nature.com/reprints.
Publisher’s note Springer Nature remains neutral with regard to jurisdictional claims in published maps and
institutional affiliations.
Open Access This article is licensed under a Creative Commons Attribution 4.0 International
License, which permits use, sharing, adaptation, distribution and reproduction in any medium or
format, as long as you give appropriate credit to the original author(s) and the source, provide a link to the Cre-
ative Commons license, and indicate if changes were made. The images or other third party material in this
article are included in the article’s Creative Commons license, unless indicated otherwise in a credit line to the
material. If material is not included in the article’s Creative Commons license and your intended use is not per-
mitted by statutory regulation or exceeds the permitted use, you will need to obtain permission directly from the
copyright holder. To view a copy of this license, visit http://creativecommons.org/licenses/by/4.0/.
© The Author(s) 2020
Scientific Reports | (2020) 10:147 | https://doi.org/10.1038/s41598-019-56929-3 9You can also read