Feeling Machine for Process Monitoring of Turning Hybrid Solid Components
←
→
Page content transcription
If your browser does not render page correctly, please read the page content below

metals
Article
Feeling Machine for Process Monitoring of Turning
Hybrid Solid Components
Berend Denkena , Benjamin Bergmann and Matthias Witt *
 Institute of Production Engineering and Machine Tools, Leibniz University Hannover, 30823 Garbsen, Germany;
 denkena@ifw.uni-hannover.de (B.D.); bergmann@ifw.uni-hannover.de (B.B.)
 * Correspondence: witt@ifw.uni-hannover.de; Tel.: +49-511-762-18095

 Received: 11 June 2020; Accepted: 8 July 2020; Published: 10 July 2020

 Abstract: The realization of the increasing automation of production systems requires the guarantee
 of process security as well as the resulting workpiece quality. For this purpose, monitoring systems
 are used, which monitor the machining based on machine control signals and external sensors.
 These systems are challenged by innovative design concepts such as hybrid components made of
 different materials, which lead to new disturbance variables in the process. Therefore, it is important
 to obtain as much process information as possible in order to achieve a robust and sensitive evaluation
 of the machining. Feeling machines with force sensing capabilities represent a promising approach to
 assist the monitoring. This paper provides, for the first time, an overview of the suitability of the
 feeling machine for process monitoring during turning operations. The process faults tool breakage,
 tool wear, and the variation of the material transition position of hybrid shafts that were researched
 and compared with a force dynamometer. For the investigation, longitudinal turning processes with
 shafts made of EN AW-6082 and 20MnCr5 were carried out. The results show the feeling machine is
 sensitive to all kinds of examined errors and can compete with a force dynamometer, especially for
 roughing operations.

 Keywords: turning; process monitoring; tailored forming; feeling machine; benchmark

1. Introduction
     In production, the aim is to achieve full automation of manufacturing through autonomous
machining processes. In this context, process monitoring systems are an important part of modern
production plants. They protect machines and machine operators from damage, reduce downtime,
and improve workpiece quality by eliminating chatter [1]. Rehorn et al. estimated, if the computer
numerical control (CNC) machine tool is equipped with a monitoring system, downtime can be
reduced by up to 20% while productivity can be raised by 50%. Machine utilization even increases by
more than 40% [2]. The increasing complexity of series production represents a challenge for process
monitoring. This also includes the use of new design strategies, e.g., by combining different materials
in hybrid workpieces. These workpieces with locally adapted properties offer a promising approach for
designing components with energy-efficient applications while reducing the use of high-alloy materials.
This is the main focus of the Collaborative Research Center (CRC) 1153, where material combinations
are joined and formed with different processes and then machined [3,4]. Due to different material
properties and chemical compositions, the machining properties and chip formation mechanisms
change during the cutting process and pose challenges for machining. In particular, the force gradient
during material transition can lead to increased tool wear and the various material properties affect
the workpiece geometry and surface quality. In addition, the trend to single part production or small
batch sizes as well as the high demands on surface quality and manufacturing tolerances pose further

Metals 2020, 10, 930; doi:10.3390/met10070930                                   www.mdpi.com/journal/metals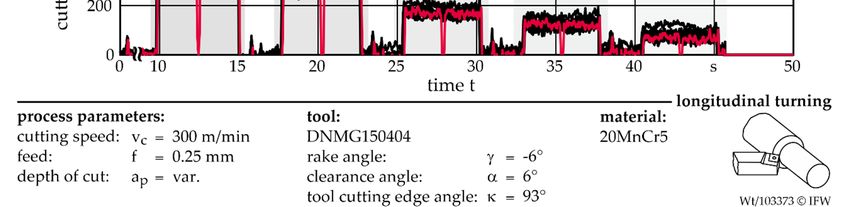
Metals 2020, 10, 930                                                                                 2 of 12

challenges. For this reason, modern process monitoring systems must be provided with process
information of the highest possible quality.
      In this context, more monitoring approaches that combine different signals and features are
being researched [5–7]. A process parameter that offers a high level of information regarding various
production errors is the process force [2,8]. Balsamo et al. showed that a catastrophic tool failure during
turning can be monitored by multi-sensor signal processing of force and acoustic emission [9]. Jie et al.
successfully developed an approach for tool condition monitoring during the machining of titanium
alloys, which is also based on the force and acoustic emission signal [10]. In addition, the development
of a cloud-based framework for monitoring manufacturing processes for online process monitoring
services takes into account process force information due to its high sensitivity [11]. In general,
the machine tool does not provide detailed information about forces. Therefore, various approaches
have been studied in the past to extract this information parallel to the machining. A method to obtain
information about the process force is to extract the process components from control signals [12,13].
This is associated with a high modelling effort, which has to be carried out for each machine due to
manufacturing and assembly tolerances. By using external sensors, process forces can be measured
with high sensitivity [14,15]. These sensor systems require high acquisition costs, are limited in their
flexibility, and restrict the installation space for workpieces [16]. Further approaches to determine
process force information have focused on modelling forces by virtual processing [17]. The simulations
reach their limits if tool wear and thermal effects are to be considered in real time. In addition, a high
modeling effort is required to take the structural dynamic effects into account. To overcome these
challenges, Denkena et al. developed the idea of the "feeling" machine tool. They integrated sensory
machine components, which are placed close to the process and are located directly in the force flow.
These sensory components are equipped with strain gauges that measure the structural strain caused
by the process force. Forces are then reconstructed from the strains. With this approach, the static and
dynamic behavior of the machine structure is generally maintained and a flexible force measurement
is realized. In milling machines, the spindle slides have been modified to become a sensory machine
component. Based on the force sensing properties of the slide, the static tool deflection was determined
during the process. The workpiece quality was improved by online adaptation of the tool position
using an axis offset [18]. The monitoring of geometrical errors of the workpiece was investigated by
a feeling clamping system for a milling process. Therefore, holes were drilled into the workpiece
to represent a material defect for a subsequent flank milling operation. A dynamometer was used
as a reference. The errors could be detected by both measuring systems based on confidence limits.
However, due to a lower signal-to-noise ratio, the feeling clamping system had a lower sensitivity to
the error [19]. Denkena et al. integrated metallic strain gauges in four carriages of a linear guide of
a spindle-driven position axis [20]. The load on the carriages could be measured in two directions
orthogonally to the direction of travel. The quality of the recorded measurement signals was suitable
for detecting parallelism errors in the linear guide. Based on the achieved force, sensitivity process
monitoring could not be performed.
      This paper focuses for the first time on the investigation of the suitability of a feeling machine
for process monitoring of turning operations. In this context, the process force is measured based
on a feeling turret during machining and is compared with the measured forces of a dynamometer.
Individual process errors, which affect the process and workpiece quality, are investigated. These
include tool breakage, tool wear, and the varying material transition position of hybrid workpieces.
Based on the considered process errors and the measuring accuracy of the feeling turret, the sensitivity
of the monitoring is discussed for various process parameters.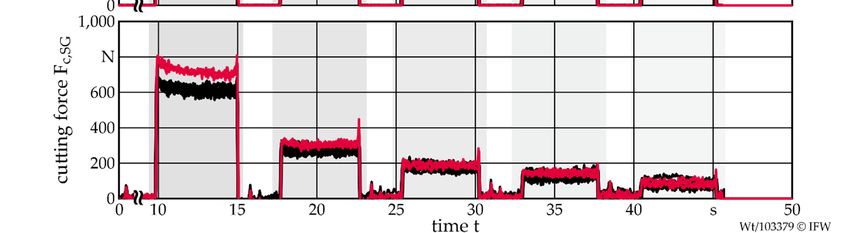
Metals 2020, 10, 930                                                                                    3 of 12

2. Materials and Methods

2.1. Materials
     When researching the system, different investigations were performed with two different materials,
which were presented in Table 1. The samples were shafts with a diameter of 30 or 40 mm and a
length of 120 mm. Mono-material components were selected to investigate tool breakage and tool wear.
When studying the performance of material detection friction-welded specimens, two mono-material
shafts were used.

                                                  Table 1. Material properties.

                                 Material Properties                  EN AW-6082             20MnCr5
                                  density   [g/cm3 ]                       2.70                7.75
                                   hardness [HV]                           100                 268
                           ultimate tensile strength [MPa]                 310               980–1280
                               Young’s modulus [GPa]                        70                  210
                       thermal expansion coefficient [10−6 K−1 ]           23.4                11.5
                           thermal conductivity [W/mK]                   170–220                42

2.2. Machining and Data Acquisition
      Experimental tests were carried out on the turning center Gildemeister CTX420 linear (Germany).
An industrial personal computer (IPC) was connected to an open platform communication server and
fieldbus interface of the Siemens Powerline 840D machine control (München, Germany) as well as to
the CAN bus of the feeling turret. For the longitudinal turning, an indexable insert DNMG150404-FP5
by Walter AG (Tübingen, Germany) was used. The machining operations were all carried out without
the use of cooling lubricant. The process force was measured by the sensory abilities of the turret,
which is equipped with strain gauges (HBM, Darmstadt, Germanycountry). The strain gauges were
set up as a Wheatstone-bridge and glued into the notch ground. The notches were designed by
finite element simulation to increase the measured strain. A total of six strain gauges were set up as
Wheatstone-bridges are placed on the turret. The signals are digitized by electronic devices close to the
measuring position and transmitted to the IPC via a CAN-BUS [21]. According to the occurring strains
during machining, the forces were calculated. The determined force resolution of the feeling turret is
64 N in the x-direction, 43 N in the y-direction, and 44 N in the z-direction. A dynamometer (Kistler
9129A, Winterthur, Switzerland) was used as a reference for the force measurement. Both systems have
a sampling rate of 1000 Hz. The low-pass frequency for the feeling turret is 25 Hz and 30 Hz for the
dynamometer. The passive force Fp acts in the x-direction, the cutting force Fc acts in the y-direction,
and the feed force Ff acts in the z-direction. The numerical control (NC) provided the axis positions
with a frequency of 83 Hz. The measurement setup is shown in Figure 1.
      Within the evaluation, the process force was also simulated to investigate the process parameter
range in smaller steps. The force model was used according to Kienzle [22]. The Kienzle parameters
applied for the modelling were determined experimentally on the presented test set-up for the material
and tool combinations. These parameters are shown in Table 2.

                                       Table 2. Summary of Kienzle parameters.

                              Parameter               Symbol                      Material
                                                                    20MnCr5            EN AW-6082
                         specific cutting force         kc1.1     2140 N/mm2            742 N/mm2
                          material exponent              mc          0.250                 0.236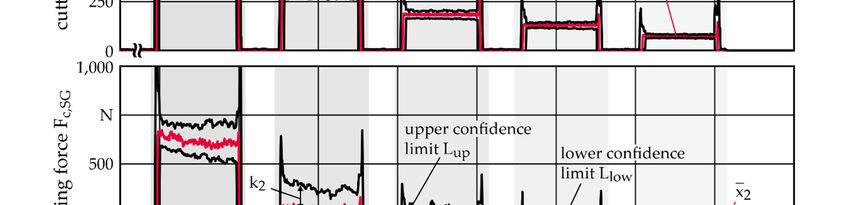
44 N in the z-direction. A dynamometer (Kistler 9129A, Winterthur, Switzerland) was used as a
reference for the force measurement. Both systems have a sampling rate of 1000 Hz. The low-pass
frequency for the feeling turret is 25 Hz and 30 Hz for the dynamometer. The passive force Fp acts in
the x-direction, the cutting force Fc acts in the y-direction, and the feed force Ff acts in the z-direction.
Metalsnumerical
The    2020, 10, 930control (NC) provided the axis positions with a frequency of 83 Hz. The measurement4 of 12

setup is shown in Figure 1.

Metals 2020, 10, x FOR PEER REVIEW                                                                     4 of 12

applied for the modelling were determined experimentally on the presented test set-up for the
material and tool combinations. These parameters are shown in Table 2.

                                     Table 2. Summary of Kienzle parameters.

                           Parameter             Symbol             Material
                                                            20MnCr5      EN AW-6082
                     specific cutting force      kc1.1    2140 N/mm  2    742 N/mm2
                      materialFigure
                                exponent Presentation
                                                  mc of the measurement
                                      1. Presentation         0.250     setup.0.236

 2.3. Simulation of Process Errors
      Within the
2.3. Simulation of evaluation, the process force was also simulated to investigate the process parameter
                   Process Errors
 rangeAintool
           smaller  steps.can
              breakage     Theresult
                               force in
                                     model  was used
                                        a sudden      according
                                                  increase       to Kienzle
                                                            in process force.[22].
                                                                               ThisThe Kienzle
                                                                                     can       parameters
                                                                                         be caused by the
      A tool breakage can result in a sudden increase in process force. This can be caused by the broken
 broken cutting-edge jamming between the tool and workpiece. Afterward, the process force decreases
cutting-edge jamming between the tool and workpiece. Afterward, the process force decreases
 because the gap between tool and workpiece must first be overcome by the travel movement. Then the
because the gap between tool and workpiece must first be overcome by the travel movement. Then
 remaining part of the tool collides with the workpiece, which increases the process forces again [23].
the remaining part of the tool collides with the workpiece, which increases the process forces again
 The described drop in force was simulated in the experiments by a material defect depicted in Figure 2a.
[23]. The described drop in force was simulated in the experiments by a material defect depicted in
 The missing material results in an identical force characteristic as in the case of a tool breakage.
Figure 2a. The missing material results in an identical force characteristic as in the case of a tool
 The advantage of these simulated errors is the reproducibility and the fact that the machine tool
breakage. The advantage of these simulated errors is the reproducibility and the fact that the machine
 components are not critically stressed. To investigate, if tool wear can be identified with the systems,
tool components are not critically stressed. To investigate, if tool wear can be identified with the
 the resulting force for machining with a new and a worn tool was measured. The worn tool exhibits a
systems, the resulting force for machining with a new and a worn tool was measured. The worn tool
 cutting-edge failure with a length of 465 µm, which is depicted in Figure 2b.
exhibits a cutting-edge failure with a length of 465 µm, which is depicted in Figure 2b.

                           (a)Prepared
                Figure2.2.(a)
               Figure          Preparedworkpiece
                                       workpieceand
                                                 and(b)
                                                     (b)presentation
                                                         presentationof
                                                                      ofthe
                                                                         thenew
                                                                             newand
                                                                                 andworn
                                                                                    worntool.
                                                                                         tool.

 2.4. Monitoring
2.4. Monitoring
      The confidence limits for monitoring tool breakage were calculated by performing 10 longitudinal
      The confidence limits for monitoring tool breakage were calculated by performing 10
 turning operations. The measured cutting forces were used to calculate the upper Lup and lower L
longitudinal turning operations. The measured cutting forces were used to calculate the upper Llow      up
 confidence limits. Thus, the confidence estimator approach according to Brinkhaus was used [24].
and lower Llow confidence limits. Thus, the confidence estimator approach according to Brinkhaus
 The confidence limits were updated after each process based on the expected mean value x standard
was used [24]. The confidence limits were updated after each process based on the expected mean
 deviation σ, and a safety value Csaftey for each running measurement value i. The safety value influences
value ̅ , standard deviation σ, and     a safety value Csaftey for each running measurement value i. The
safety value influences the distance between ̅ and the confidence limits. A safety value of Csaftey = 6
was used, which is usually the default setting of a monitoring system.

                                             ,   ( ) = ̅( ) ∓       ∙ ()                                (1)
     In order to take account of temporal fluctuations, the confidence limit was calculated for a
Metals 2020, 10, 930                                                                                 5 of 12

the distance between x and the confidence limits. A safety value of Csaftey = 6 was used, which is
usually the default setting of a monitoring system.

                                      Lup, low (i) = x(i) ∓ Csa f tey ·σ(i)                             (1)

      In order to take account of temporal fluctuations, the confidence limit was calculated for a function
h(i). This function determines an envelope for the expected value x(i), which allows a time lag for a
specified time K. During the investigations, K was set to 100 ms. Based on this value, no false alarms
occurred after four processes in the teach-in phase.

                                  hup (i) = max(x(i − K), . . . , x(i + K))
                                                                                                        (2)
                                  hlow (i) = min(x(i − K), . . . , x(i + K))

     According to the combination of Equations (1) and (2), the shift of time and amplitude was taken
into account when calculating the confidence limits. The values of h and σ were calculated by a moving
average to allow dynamic weighting of the different measurements.

                                    Lup (i) = hup (i) + Csa f tey ·σ hup (i)
                                                                                                        (3)
                                   Llow (i) = hlow (i) − Csa f tey ·σ(hlow (i))

     For detecting the currently machined material, the material-specific cutting force MatFc was
monitored [25]. In this approach, the cutting force Fc was normalized by the material removal rate
Qw . The material removal rate was calculated online using a dexel-based cutting simulation. Input
parameters for the simulation were the axis positions from the machine control. A material compound
was subsequently monitored on the basis of a defined boundary surface.

                                               MatFc = Fc /Qw                                           (4)

3. Results and Discussion

3.1. Tool Breakage
     In cutting operations, process errors typically lead to an increase or decrease of the process force.
For this reason, the process force is well suited for a sensitive and robust monitoring in machining.
To determine the sensitivity of force measuring systems, material defects can be applied to the workpiece.
Similar to tool breakage, missing material lead to a drop in the process force. This characteristic was used
in order to compare the cutting force Fc,SG , which was determined by the feeling turret, and the cutting
force Fc,dyn , which was measured with the dynamometer. A longitudinal turning process was carried out
with a new tool for a cutting speed of 300 m/min and a feed rate of 0.1 mm. During machining, the depth
of cut was reduced stepwise from 1 to 0.1 mm. This process was repeated 10 times. Afterward, a shaft
was machined, which was prepared with a groove that had a width of 3 mm. The missing material
causes a decrease in cutting force at each depth of cut, depicted in Figure 3.
     The comparison of the two force measurement systems showed that they have an identical time
behavior with regard to the signal change. The amplitude of the decreasing cutting force is also
identical for both systems. Therefore, it can be concluded that both systems are highly sensitive to
a change in cutting force due to tool breakage. However, by comparing the signals of the 10 good
processes, it becomes clear that the cutting force Fc,SG has a lower signal-to-noise ratio (SNR).

                                                 SNR = µ/σ                                              (5)

     The SNR was determined for each depth of cut ap by the mean value of the amplitude µ and the
standard deviation σ of the signal. The results of the SNR for both measuring systems are summarized
in Table 3.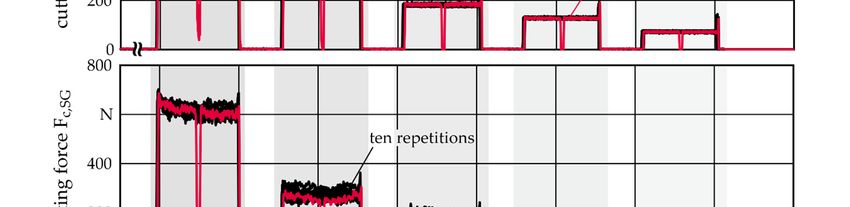
Metals 2020, 10, 930 6 of 12
Table 3. Signal-to-noise ratio for the measured cutting force by using the dynamometer and feeling turret.
Signal-to-Noise Ratio (SNR) Depth of Cut ap [mm]
1 0.5 0.3 0.2 0.1
cutting force by dynamometer Fc,dyn 46 149 78 90 70
cutting force by feeling turret Fc,SG 40 26 16 12 7
Metals 2020, 10, x FOR PEER REVIEW 6 of 12
Figure
Figure 3.
3. Longitudinal
Longitudinal turning
turning with
with and
and without
without aa material
material defect
defect for
for different depths of
different depths of the
the cut.
cut.
The SNR was determined for each depth of cut cut aapp by the mean value of the amplitude µ and the
standard deviationσσof
standard deviation ofthe
thesignal.
signal.At Atan anaapp of
of 0.5
0.5 mm,
mm, FFc,dyn
c,dyn exhibits
exhibits an an SNR
SNR of of 149.
149. With
With a decreasing
decreasing
app, the SNR also decreases further. further. For app == 0.1 mm, the SNR is still 70.
0.1 mm, the SNR is still 70. The measured The measured cutting force by
dynamometer has
the dynamometer has the the lowest
lowest SNR SNR for for aapp = 1 mm with 46. The deviation to the other depths of cut
is caused by different chip chip formation,
formation, which led to to aa higher
higher vibration
vibration of of the system. For app == 11 mm,
the system.
c,SG shows
the Fc,SG shows aa similar
similar SNR SNR with with 40. However,
However, with each reduction of aapp, the signal-to-noise ratio
decreases for the the signal
signal FFc,SGc,SG.. For
For the
the depth
depth of of cut
cut of of app ==0.1
0.1mm,mm,the the SNR
SNR is is 77 and, thus, lower by a
compared to
factor of 10 compared to FFc,dyn
c,dyn. .The
Therepeatability
repeatabilityof ofthetheindividual
individualmeasurements
measurements also also shows
shows a different
different
quality for both signals. The evaluation of the 10 good processes demonstrates that the cutting force
c,SG has
Fc,SG haslarger
largervariations
variationsbetween betweenthe themeasurements
measurementsthan thanFc,dyn . With
Fc,dyn . Witha depth
a depthcutcutof aof 1=
p =ap mm, the
1 mm,
the standard deviation σi for the mean amplitudes of the different workpieces is for both systems
standard deviation σ i for the mean amplitudes of the different workpieces is for both systems being
almostalmost
being identical with approximately
identical with approximately 15 N. 15 ByN. changing
By changing the process
the processparameters
parameters to a tolower ap, the
a lower ap ,
standard
the standard deviation decreases
deviation decreases for for
Fc,dynFc,dyn
to σi to σi =N1.7
= 1.7 while σi of F
N while σc,SG
i of is
F around
c,SG is 10
around N. 10 N.
confidence limits
If confidence limitsare areused
usedtotomonitor
monitorthe thesignal,
signal,the thehigher
higher signal-to-noise
signal-to-noise ratio
ratio andand variation
variation of
of the
the mean mean amplitude
amplitude leadsleads to a widening
to a widening of the statistical
of the statistical limits and, limits
thus,and, thus, to a monitoring
to a decreasing decreasing
monitoringInsensitivity.
sensitivity. order to compareIn orderFc,SG to compare
and Fc,dynFwith c,SG and
regard Fc,dynto with
their regard to their
qualification for qualification
confidence limit for
confidence
based limit based
monitoring, monitoring,
the feature the feature
of the normed bandgapof the normed
(NB) bandgap (NB)
was determined [26]. was determined
The normed [26].
bandgap
The normed bandgap indicates the range in which the normalized signal has to be changed to trigger
an alarm. For this purpose, the confidence limit was calculated based on the distribution of the signal
around its long-term average. After eight processes, the limits had become close to the process. A
further approximation was only possible in very small steps due to the high standard deviation of
the measured signal. It can be assumed that 10 measurements are sufficient to generate the confidence
Metals 2020, 10, 930                                                                                                     7 of 12

 indicates the range in which the normalized signal has to be changed to trigger an alarm. For this
 purpose, the confidence limit was calculated based on the distribution of the signal around its long-term
 average. After eight processes, the limits had become close to the process. A further approximation
 was only possible in very small steps due to the high standard deviation of the measured signal. It can
 be assumed that 10 measurements are sufficient to generate the confidence limit and calculate the NB.

                                                              k   Lup − x
                                                     NB =       =                                                            (6)
Metals 2020, 10, x FOR PEER REVIEW                            x      x                                                  7 of 12

       To evaluate the monitoring quality, the gap between the mean value x and the upper confidence
     ToL evaluate   the monitoring quality, the gap between the mean value ̅ and the upper
 limit   up was evaluated. The distance k between x and Lup was normalized to the average. Figure 4
confidence
 shows thelimit   Lup waslimits
             confidence    evaluated.  The
                                after 10   distancefor
                                         processes     the cutting̅ forces
                                                     k between       and Lup wasand
                                                                           Fc,dyn normalized
                                                                                     Fc,SG andtothe
                                                                                                  thecomparison
                                                                                                       average.
Figure  4 shows  the  confidence   limits after 10 processes
 of the normed bandgap (NB) for both measuring systems.       for the  cutting  forces Fc,dyn and Fc,SG and the

comparison of the normed bandgap (NB) for both measuring systems.

                   Confidencelimits
        Figure4.4.Confidence
      Figure                    limitsand
                                       andnormed
                                            normedbandgaps
                                                   bandgapsfor
                                                            forFFc,dyn  andFc,SG
                                                                  c,dynand  Fc,SG during
                                                                                 during   a longitudinalturning
                                                                                        a longitudinal    turning
       processwith
      process    withdifferent
                      differentdepths
                                 depthsofofcut.
                                            cut.

        Thesensitivity
      The    sensitivityofof the
                             the confidence
                                 confidencelimit,limit,which
                                                          whichis is
                                                                  calculated
                                                                      calculated  based  on the
                                                                                     based   on cutting   forceforce
                                                                                                 the cutting    of theoffeeling
                                                                                                                          the
  turret, declines  with   decreasing   force.  This  is  reflected   by  the  increasing   normed    bandgap.
feeling turret, declines with decreasing force. This is reflected by the increasing normed bandgap. For            For an  ap of
  1 mm,   both  signal   sources   achieve  a   similar   monitoring       performance.      At
an ap of 1 mm, both signal sources achieve a similar monitoring performance. At a normed bandgap a normed    bandgap     of  0.3,
ofa0.3,
    process   error must
        a process   error result   in a signal
                            must result          changechange
                                          in a signal      of 30%of  to30%
                                                                        trigger    the alarm.
                                                                               to trigger  the The   ratio
                                                                                                alarm.     remains
                                                                                                         The          between
                                                                                                              ratio remains
  NB  =  0.1–0.2  for all examined     depths    of cut   if the cutting    force   is measured
between NB = 0.1–0.2 for all examined depths of cut if the cutting force is measured with the      with   the  dynamometer
  (Kistler, Winterthur,
dynamometer       (Kistler,Switzerland).    If the feeling turret
                             Winterthur, Switzerland).         If the is   used, turret
                                                                       feeling     the normed
                                                                                          is used,bandgap
                                                                                                    the normed       = 0.3 mm
                                                                                                             for apbandgap
  shows
for        a mm
    ap = 0.3 maximum           NB = 0.8.ofThe
                  shows aofmaximum           NB =NB  0.8.increases    to 2 withtoa2reduction
                                                          The NB increases                         of ap toof0.1
                                                                                       with a reduction           mm.
                                                                                                               ap to     Thus,
                                                                                                                     0.1 mm.
  the sensitivity  of  the dynamometer       is  higher   by  a factor  of  10   compared    to the
Thus, the sensitivity of the dynamometer is higher by a factor of 10 compared to the feeling turret. feeling  turret.  The  fact
  that the  feeling  turret  has a  significantly   lower    sensitivity    at  low  process  forces  is
The fact that the feeling turret has a significantly lower sensitivity at low process forces is based on based   on  the lower
  measurement
the                resolution
    lower measurement           of the system
                              resolution   of therelative
                                                   systemtorelative
                                                                the dynamometer.         This is primarily
                                                                         to the dynamometer.                  due to a higher
                                                                                                    This is primarily     due
to a higher signal-to-noise ratio, which has an increasing impact on the stochastic distribution of the
signal for lower cutting forces. A generalized statement about the required NB of a signal cannot be
made since each error is represented differently in the signal. However, based on the investigations,
it is considered when no finishing operations can be monitored by the feeling turret. For roughing
operations, on the other hand, a similar monitoring quality as with the dynamometer can be achieved.
Metals 2020, 10, 930 8 of 12
signal-to-noise ratio, which has an increasing impact on the stochastic distribution of the signal for
lower cutting forces. A generalized statement about the required NB of a signal cannot be made since
each error is represented differently in the signal. However, based on the investigations, it is considered
when no finishing operations can be monitored by the feeling turret. For roughing operations, on the
other hand, a similar monitoring quality as with the dynamometer can be achieved.
3.2. Tool Wear
Tool wear generally leads to a change in process force. With increasing flank wear, friction
increases, which, in turn, leads to an increasing cutting force and cutting temperatures. If the wear
is mainly caused by crater wear, the change in rake angle can lead to a decrease in cutting force.
Metals 2020, 10, x FOR PEER REVIEW 8 of 12
Consequently, the change in cutting force is also an indicator for monitoring the type of wear that
will influence the process and the workpiece quality. Tool wear is usually monitored by a static limit.
will influence the process and the workpiece quality. Tool wear is usually monitored by a static limit.
Therefore, the average measured cutting force with a new tool is determined for a predefined tool
Therefore, the average measured cutting force with a new tool is determined for a predefined tool
path. Based on empirical values, a maximum tolerable change in force is defined as the limit for
path. Based on empirical values, a maximum tolerable change in force is defined as the limit for the
the tolerable wear. If the limit is exceeded, the monitoring system initiates a tool change before an
tolerable wear. If the limit is exceeded, the monitoring system initiates a tool change before an
intolerable influence on the workpiece quality occurs. In contrast to the confidence limits, the influence
intolerable influence on the workpiece quality occurs. In contrast to the confidence limits, the
of the signal-to-noise ratio on the monitoring quality is significantly lower since the average value is
influence of the signal-to-noise ratio on the monitoring quality is significantly lower since the average
evaluated over a defined range of the monitored signal. For a sensitive and robust monitoring of tool
value is evaluated over a defined range of the monitored signal. For a sensitive and robust monitoring
wear, the repeat accuracy is mostly important. In addition to the 10 good processes with a new tool,
of tool wear, the repeat accuracy is mostly important. In addition to the 10 good processes with a new
three measurements were carried out with a tool, which has a high chipping length of 465 µm. During
tool, three measurements were carried out with a tool, which has a high chipping length of 465 µm.
the machining, identical process parameters of ap , f, and vc were used as for the previous longitudinal
During the machining, identical process parameters of ap, f, and vc were used as for the previous
turning operations, depicted in Figure 5.
longitudinal turning operations, depicted in Figure 5.
Figure 5. 5.
Figure Cutting force
Cutting characteristics
force forfor
characteristics new and
new worn
and tool
worn forfor
tool different depths
different ofof
depths cut.
cut.
Toolwear
Tool wearresults
resultsininananincreasing
increasingcutting
cuttingforce,
force,which
whichvaries
variesaccording
accordingtotothe thedepth
depthofofcut.cut.AtAt
aa
depth
depth of of
cutcut = 1 mm,
of aofp =ap1 mm, an increase
an increase of 24%of occurs
24% occurs with N
with 158.5 158.5
for FNc,dyn
for Fc,dyna.reduction
. With With a reduction
to ap = 0.5to
ap =the
mm, 0.5wear
mm,lead
the to wear lead to an
an average average
increase increase
in the in force
cutting the cutting
of 38.6 force
N, which of 38.6 N, which
represents represents a
a percentage
percentage
change change
of 13%. of 13%.
The triple The triple
standard standard
deviation deviation
of the of the measurements
measurements with the new tool withisthe3σ new
= 9 Ntool
for is
3σ.=Assuming
Fc,dyn 9 N for Fc,dyn
tool. Assuming
wear can be detected,
tool wear can if be
this value isiflower
detected, than is
this value the resulting
lower change
than the in cutting
resulting change
in cutting
force, force, can
monitoring monitoring
be performedcan beforperformed
both ap. The both ap . of
for increase The increase
Fc,dyn at an aofp ofFc,dyn
0.3 mmat anis,aptherefore,
of 0.3 mm
with 7.5 N too small
is, therefore, with 7.5 to detect
N toothe current
small tool wear
to detect for thetool
the current defined
wearprocess
for theparameters.
defined process For the feeling
parameters.
turret, a 3σ for Fc,SG of 53 N is determined at a depth cut of 1 mm. Thus, the tool wear can be robustly
identified for ap = 1 mm. For the remaining process parameters, the variation of the average cutting
force is too low to realize tool wear monitoring.
As shown by the different depths of cut, no general statement can be made about the effect of
tool wear on the percentage change in cutting force. Therefore, it is not possible to make a universal
prediction of the ability to monitor tool wear. The influence of the wear mechanisms on the cuttingMetals 2020, 10, 930 9 of 12
For the feeling turret, a 3σ for Fc,SG of 53 N is determined at a depth cut of 1 mm. Thus, the tool wear
can be robustly identified for ap = 1 mm. For the remaining process parameters, the variation of the
average cutting force is too low to realize tool wear monitoring.
As shown by the different depths of cut, no general statement can be made about the effect of
tool wear on the percentage change in cutting force. Therefore, it is not possible to make a universal
prediction of the ability to monitor tool wear. The influence of the wear mechanisms on the cutting
force vary significantly based on the selected process parameters. For this reason, it is more relevant to
compare what change in cutting force caused by tool wear can be theoretically identified with different
signals. For this purpose, the cutting force was modelled according to Kienzle for a new tool and three
wear-related force increases. The variation of the cutting speed has a smaller influence on the force
compared to the feed and depth of cut. For this reason, the cutting speed was fixed for the research
at vc = 300 m/min. Based on the modelled cutting forces, an increase in force was determined for a
combination of process parameters. It is assumed that the change can be monitored if the difference is
higher
Metals than
2020, 10,the triple
x FOR REVIEW deviation 3σ of the cutting force measurement. Based on the previous
PEERstandard 9 of 12
investigation, 3σ was set to Fc,dyn,3σ = 9 N and Fc,SG,3σ = 53 N. For both measuring systems, it process
the previouswere
parameters investigation,
researched3σatwas set atoforce
which Fc,dyn,3σ = 9 N and
difference ofF10%, = 53 N.
c,SG,3σ 20%, andFor
30%both measuring
results can be systems,
detected
it
by the individual system, which was depicted in Figure 6. This investigation was carried outresults
process parameters were researched at which a force difference of 10%, 20%, and 30% can
for a steel
be
(20detected
MnCr5) by andtheanindividual
aluminumsystem, which was depicted in Figure 6. This investigation was carried
(EN AW-6082).
out for a steel (20 MnCr5) and an aluminum (EN AW-6082).
Figure
Figure 6.
6. Representation
Representation of
ofthe
the monitorable
monitorablepercentage
percentageincrease
increaseof
ofthe
thecutting
cuttingforce
forcefor
forEN
ENAW-6082
AW-6082
and 20MnCr5 based on the feeling turret and dynamometer.
and 20MnCr5 based on the feeling turret and dynamometer.
With
With the
the dynamometer,
dynamometer, almost
almost thethe total
total process
process parameter
parameter range
range considered
considered forfor both
both materials
materials
can be monitored with regard to the three selected percentile cutting force changes.
can be monitored with regard to the three selected percentile cutting force changes. Only for aluminum, Only for
aluminum, the theoretical detection is not possible for low depths of cut and
the theoretical detection is not possible for low depths of cut and low feeds. In this case, the low feeds. In this case,
cutting
the cutting
force forcecaused
difference difference
by a caused by a wear-related
wear-related force increaseforce increase
of 10% is too of 10%
low. is evaluation
The too low. The of evaluation
the cutting
of the cutting force measured by the feeling turret shows the potential for
force measured by the feeling turret shows the potential for monitoring tool wear for a wide monitoring tool wear forof
range a
wide range of process parameters. Especially for steel, a large range is covered. For
process parameters. Especially for steel, a large range is covered. For aluminum, higher ap and f are aluminum, higher
arequired
p and f are
duerequired due to the
to the different different
material materialFor
properties. properties. Forexpected
the highest the highest expected
change change
of 30%, of 30%,
this includes
this includes process parameters of a = 0.5 mm and f = 0.17 mm. In the case
process parameters of ap = 0.5 mm and f = 0.17 mm. In the case of aluminum, large parts of
p of aluminum, large parts
the
of the considered
considered processprocess parameter
parameter range range can theoretically
can theoretically not benot be monitored,
monitored, especially
especially if the if the cutting
cutting force
force
changeschanges
by onlyby10%onlydue
10% due wear.
to tool to toolInwear. In higher
general, general,aphigher
and f areap and
usedf for
aremachining
used for machining
aluminum
aluminum
than for steel. Then tool wear can also be monitored for aluminum during roughingduring
than for steel. Then tool wear can also be monitored for aluminum roughing
operations.
operations.
3.3. Material Detection
The online detection of the machined material is needed to realize a material-specific machining
of hybrid components. For this reason, the sensitivity of monitoring a material compound based onMetals 2020, 10, 930 10 of 12
3.3. Material Detection
The online detection of the machined material is needed to realize a material-specific machining
of hybrid components. For this reason, the sensitivity of monitoring a material compound based on the
material-specific cutting force was investigated. A longitudinal turning process of EN AW-6082 and
20MnCr5 was performed and the signals of the dynamometer and the feeling turret were compared by
the statistical overlap factor (SOF). The SOF determines the degree of separation of the material-specific
cutting force between the first and second material. If a signal shows a high degree of separation due
to different material properties, the SOF increases. In addition to the resulting standard deviation
when measuring the cutting force, the influence of the variance of the simulated material removal
rate Qw was considered. The determined triple standard deviation for the simulation of Qw is 3–4%.
With Qw,min , the value at the lower end of the triple standard deviation is taken into account for the first
material i. In contrast, Qw,max is assumed for the second material j. This results in the material-specific
cutting force being calculated too low for steel and too high for aluminum in order to obtain the highest
possible variation. To guarantee robust monitoring, an SOF greater than six is necessary to separate
two
Metalsmaterials
2020, 10, x during machining.
FOR PEER REVIEW 10 of 12
Fc,i Fc,j
Qw,min − Qw,max
, ,
SOFij = − (7)
Fc,i , F, c,j
= σ Q + σ Qw,max (6)
w,min
, ,
+
, ,
With a constant ap of 1 mm, the SOF was calculated for a varying feed rate of f = 0.1–0.4 mm and
Withspeed
a cutting a constant
of vc =ap200–400
of 1 mm, the SOF
m/min, whichwasarecalculated
depictedfor in aFigure
varying feedinfluence
7. The rate of f =of0.1–0.4 mm and
the simulation
a cutting speed of v c = 200–400 m/min, which are depicted in Figure 7. The influence of the simulation
error of Qw on the calculated SOF can be neglected. For the investigated aluminum-steel compound,
error
the SOFof decreases
Qw on the by
calculated
a maximumSOFof can5%beif neglected.
the highestFor the investigated
possible variation ofaluminum-steel
Qw is consideredcompound,
instead of
the SOF decreases by a maximum of 5% if the highest possible variation of Q w is considered instead
assuming a constant value for Qw . The significant impact is, therefore, the measuring accuracy and the
of assuming a constant
signal-to-noise ratio of thevalue for Qforces.
cutting w. The significant impact is, therefore, the measuring accuracy and
the signal-to-noise ratio of the cutting forces.
Figure
Figure 7. Material-specific cutting
7. Material-specific cutting force
force for
for varying
varying feed
feed and
and cutting
cutting speed.
speed.
For the feeling
For the feelingturret,
turret,the
thesensitivity
sensitivity
of of
thethe monitoring
monitoring system
system improves
improves if theifthe
thefeed
the and,
feed thus,
and,
thus, the cutting force is increased. This is because the SNR is much more significant
the cutting force is increased. This is because the SNR is much more significant in the signal of the in the signal of
the structure-integrated strain gauges compared to the signals of the dynamometer.
structure-integrated strain gauges compared to the signals of the dynamometer. Consequently, the Consequently,
the
SNR SNR
hashas a larger
a larger impact
impact onon
thethe measurement
measurement ofofFcFand,
c and, subsequently,on
subsequently, onthe
thequality
quality ofof the
the material
material
identification at lower process forces. For a feed of f = 0.1 mm, the average measured
identification at lower process forces. For a feed of f = 0.1 mm, the average measured SOF is 6.0, SOF is 6.0, while,
while,
at f = 0.4 mm, the average SOF increases to 12.6. With the dynamometer, this effect
at f = 0.4 mm, the average SOF increases to 12.6. With the dynamometer, this effect does not appear does not appear
due to the lower SNR. However, the SOF also varies for the material-specific cutting force measured
by the dynamometer over the examined process parameter range. This is caused by the higher
sensitivity to varying chip formation. Different chip forms results in changing peak2peak values of
the signal and, consequently, in different standard deviations of the force signal. This effect is less
significant for strain gauges due to the higher damping of the turret structure. In general, a higherMetals 2020, 10, 930 11 of 12
due to the lower SNR. However, the SOF also varies for the material-specific cutting force measured by
the dynamometer over the examined process parameter range. This is caused by the higher sensitivity
to varying chip formation. Different chip forms results in changing peak2peak values of the signal
and, consequently, in different standard deviations of the force signal. This effect is less significant for
strain gauges due to the higher damping of the turret structure. In general, a higher SOF value and,
thus, better sensitivity is achieved by using the dynamometer for all considered process parameters.
The maximum statistical overlap factor is 23.9 while the minimum SOF is 13.5. Both measuring systems
are, therefore, qualified to robustly monitor the material during the machining of the aluminium-steel
compound for the examined process parameter range.
4. Conclusions
This paper presents the investigation of the application of a feeling machine for process monitoring.
In order to replace the dynamometer, a feeling turret was used, which determines process forces based
on the structure’s integrated strain gauges. The monitoring quality was compared with the performance
of a dynamometer regarding the detection of tool breakage, tool wear, and material transitions of
hybrid components. Investigations have shown that, especially in roughing operations, which are
characterized by higher process forces, the feeling turret has a good monitoring performance. At depths
of cut of ap = 1 mm, similar sensitivities were determined for monitoring with confidence limits as
with a dynamometer. If steel is machined, tool wear can be detected with the cutting force of the
feeling turret for roughing and finishing processes. For aluminum, on the other hand, only monitoring
roughing processes can be realized. However, it must be assumed that the tool wear also leads to
a significant change in cutting force of 10–30%. Similar to the dynamometer, the feeling turret is
suitable for monitoring the materials of aluminium-steel compound (EN AW-6082/20MnCr5). For the
examined process parameter range, the statistical overlap factor was higher than six. Consequently,
a classification of the materials based on the material-specific cutting force can be achieved. In further
steps, it will be investigated how the fusion of signals from the feeling machine and process data from
the machine control and external sensors can be used to improve the monitoring quality.
Author Contributions: Conceptualization, M.W. and B.B.; funding acquisition, B.D. and B.B.; investigation, M.W.;
methodology, M.W. and B.B.; supervision, B.D.; validation, B.B.; writing—original draft, M.W.; writing—review &
editing, B.D. and B.B. All authors have read and agreed to the published version of the manuscript.
Funding: The results presented in this paper were obtained within the Collaborative Research Centre 1153 “Process
chain to produce hybrid high performance components by Tailored Forming” in the subproject B5 (252662854).
The authors would like to thank the German Research Foundation (DFG) for its financial and organisational
support of this project.
Conflicts of Interest: The authors declare no conflict of interest.
References
1. Tönshoff, H.K.; Wulfsberg, J.P.; Jals, H.J.J.; König, W.; Van Luttervelt, C.A. Developments and Trends in
Monitoring and Control of Machining Processes. CIRP Ann. 1988, 37, 611–622. [CrossRef]
2. Rehorn, A.G.; Jiang, J.; Orban, P.E. State-of-the-art methods and results in tool condition monitoring: A
review. Int. J. Adv. Manuf. Technol. 2005, 26, 693–710. [CrossRef]
3. Behrens, B.A.; Chugreev, A.; Selinski, M.; Matthias, T. Joining zone shape optimisation for hybrid components
made of aluminium-steel by geometrically adapted joining surfaces in the friction welding process. In AIP
Conference Proceedings, Proceedings of the 18th International Conference on Positron Annihilation, Vitoria-Gasteiz,
Spain, 8–10 May 2019; AIP Publishing: Melville, NY, USA, 2019. [CrossRef]
4. Behrens, B.A.; Chugreeva, A.; Mildebrath, M.; Diefenbach, J.; Barroi, A.; Lammers, M.; Hermsdorf, J.; Hassel, T.;
Overmeyer, L. Manufacturing of High-Performance Bi-Metal Bevel Gears by Combined Deposition Welding
and Forging. Metals 2018, 8, 898. [CrossRef]
5. Abellan-Nebot, J.V.; Subirón, F.R. A review of machining monitoring systems based on artificial intelligence
process models. Int. J. Adv. Manuf. 2010, 47, 237–257. [CrossRef]Metals 2020, 10, 930 12 of 12
6. Teti, R. Advanced IT Methods of Signal Processing and Decision Making for Zero Defect Manufacturing in
Machining. Procedia CIRP 2015, 28, 3–15. [CrossRef]
7. Siddhpura, A.; Paurobally, R. A review of flank wear prediction methods for tool condition monitoring in a
turning process. Int. J. Adv. Manuf. 2013, 65, 371–393. [CrossRef]
8. Lauro, C.H.; Brandão, L.C.; Baldo, D.; Reis, R.A.; Davim, J.P. Monitoring and processing signal applied in
machining processes—A review. Measurement 2014, 58, 73–86. [CrossRef]
9. Balsamo, V.; Caggiano, A.; Jemielniak, K.; Kossakowska, J.; Nejman, M.; Teti, R. Multi Sensor Signal Processing
for Catastrophic Tool Failure Detection in Turning. Procedia CIRP 2016, 41, 939–944. [CrossRef]
10. Sun, J.; San, W.Y.; Soon, H.G.; Rahman, M.; Zhigang, W. Identification of Feature Set for Effective Tool
Condition Monitoring-A Case Study in Titanium Machining. In Proceedings of the IEEE Conference on
Automation Science and Engineering, Arlington, VA, USA, 23–26 August 2008; IEEE Xplore: Washington,
DC, USA; pp. 273–278. [CrossRef]
11. Caggiano, A. Cloud-based manufacturing process monitoring for smart diagnosis services. Int. J. Comput.
Integr. Manuf. 2018, 31, 612–623. [CrossRef]
12. Altintas, Y. Prediction of cutting forces and tool breakage in milling from feed drive current measurement.
J. Manuf. Sci. Eng. 1992, 114, 386–392. [CrossRef]
13. Aslan, D.; Altintas, Y. Prediction of cutting forces in five-axis milling using feed drive current measurements.
IEEE/ASME Trans. Mechatron. 2018, 23, 833–844. [CrossRef]
14. Möhring, H.C.; Nguyen, Q.P.; Kuhlmann, A.; Lerez, C.; Nguyen, L.T.; Misch, S. Intelligent tools for predictive
process control. Procedia CIRP 2016, 57, 539–544. [CrossRef]
15. Brecher, C.; Eckel, H.M.; Motschke, T.; Fey, M.; Epple, A. Estimation of the virtual workpiece quality by the
use of a spindle-integrated process force measurement. Ann. CIRP 2019, 68, 381–384. [CrossRef]
16. Teti, R.; Jemielniak, K.; Odonnell, G.; Dornfeld, D. Advanced Monitoring of Machining Operations. Ann. CIRP
2010, 59, 717–739. [CrossRef]
17. Altintas, Y.; Kersting, P.; Biermann, D.; Budak, E.; Denkena, B.; Lazoglu, I. Virtual process systems for part
machining operations. Ann. CIRP 2014, 63, 585–605. [CrossRef]
18. Denkena, B.; Boujnah, H. Feeling machines for online detection and compensation of tool deflection in
milling. Ann. CIRP 2018, 67, 423–426. [CrossRef]
19. Denkena, B.; Dahlmann, D.; Kiesner, J. Production Monitoring Based on Sensing Clamping Elements. Procedia
Technol. 2016, 26, 235–244. [CrossRef]
20. Denkena, B.; Park, J.K.; Bergmann, B.; Schreiber, P. Force sensing linear rolling guides. In Proceedings of the
Euspen’s 18th International Conference & Exhibition, Venice, Italy, 4–8 June 2018.
21. Bergmann, B.; Witt, M. Feeling machine for material-specific machining. Ann. CIRP 2020, 69. [CrossRef]
22. Kienzle, O. Die Bestimmung von Kräften und Leistungen an spanenden Werkzeugmaschinen. Zeitschrift des
Vereines Deutscher Ingenieure 1952, 94, 299–305.
23. Tlusty, J.; Andrews, G.C. A Critical Review of Sensors for Unmanned Machining. Ann. CIRP 1983, 32,
563–572. [CrossRef]
24. Brinkhaus, J.W. Statistische Verfahren zur selbstlernenden Überwachung spanender Bearbeitungen in
Werkzeugmaschinen: (Statistical Methods for Self-Teaching Monitoring of Machining Operations in Machine
Tools). Ph.D. Thesis, Leibniz University, Hannover, Germany, 18 December 2008.
25. Denkena, B.; Bergmann, B.; Witt, M. Automatic process parameter adaption for a hybrid workpiece during
cylindrical operation. Int. J. Adv. Manuf. Technol. 2017, 95, 311–316. [CrossRef]
26. Denkena, B.; Dahlmann, D.; Damm, J. Self-adjusting process monitoring system in series production.
Procedia CIRP 2015, 33, 233–238. [CrossRef]
© 2020 by the authors. Licensee MDPI, Basel, Switzerland. This article is an open access
article distributed under the terms and conditions of the Creative Commons Attribution
(CC BY) license (http://creativecommons.org/licenses/by/4.0/).You can also read